Studio Tutorial: Spectral Data Quality - ucdavis/erplab GitHub Wiki
ERPLAB provides extensive information about data quality for averaged ERPs, as described in detail in the manual page about data quality metrics. These metrics mainly rely on the concept of the standard error of measurement, which is straightforward to estimate for averaged ERPs. It is much less straightforward to develop a simple, quantitative metric of data quality for raw EEG.
The Spectral Data Quality panel provides a reasonable but far-from-perfect approach to assessing raw EEG data quality. It allows you to quantify the amplitude or power of the EEG signal across a set of key frequency bands in continuous EEGsets. The rationale is that high levels of power in certain frequency bands can be an indicator of poor data quality. For example, high levels of amplitude in the delta band (defined here as 0–3 Hz) may indicate problems such as skin potentials or movement artifacts. Similarly, high levels of amplitude near the line frequency (50 or 60 Hz, depending on your region) may indicate line noise. However, we would like to caution that these are imperfect metrics of data quality, because high amplitudes in these bands could also indicate the presence of real brain signals that are simply very large.
To see this, go to the EEGsets panel and select 6_N400 (first loading it from disk if it’s not already loaded). Now go to the Spectral Data Quality panel. Click the Browse button and select all of the channels except FP1, FP2, HEOG, and VEOG. We don’t want to include those channels at this point because the blinks and eye movements in these channels will make it seem as if they have poor data quality. [It is often better to obtain the spectral data quality after correcting these artifacts with ICA.]
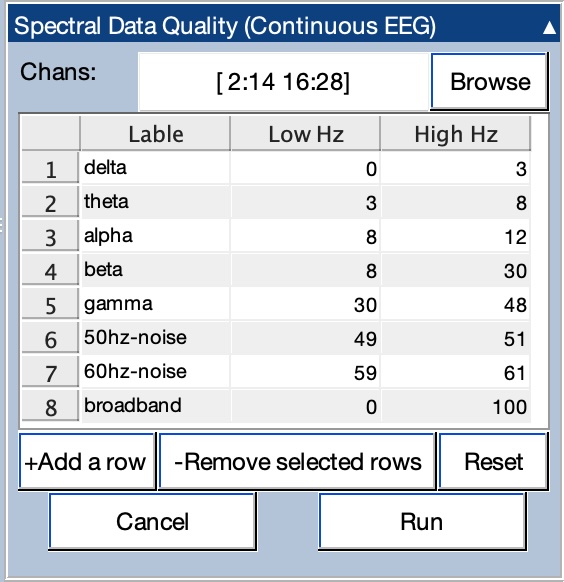
The panel should now be set up as shown in the screenshot above. If not, change the parameters accordingly. Then click Run.
A table will now appear that shows the amplitude within each frequency band for each channel. Select the Outliers option to highlight channel/band combinations with particularly high amplitudes. The result should look like the screenshot below.
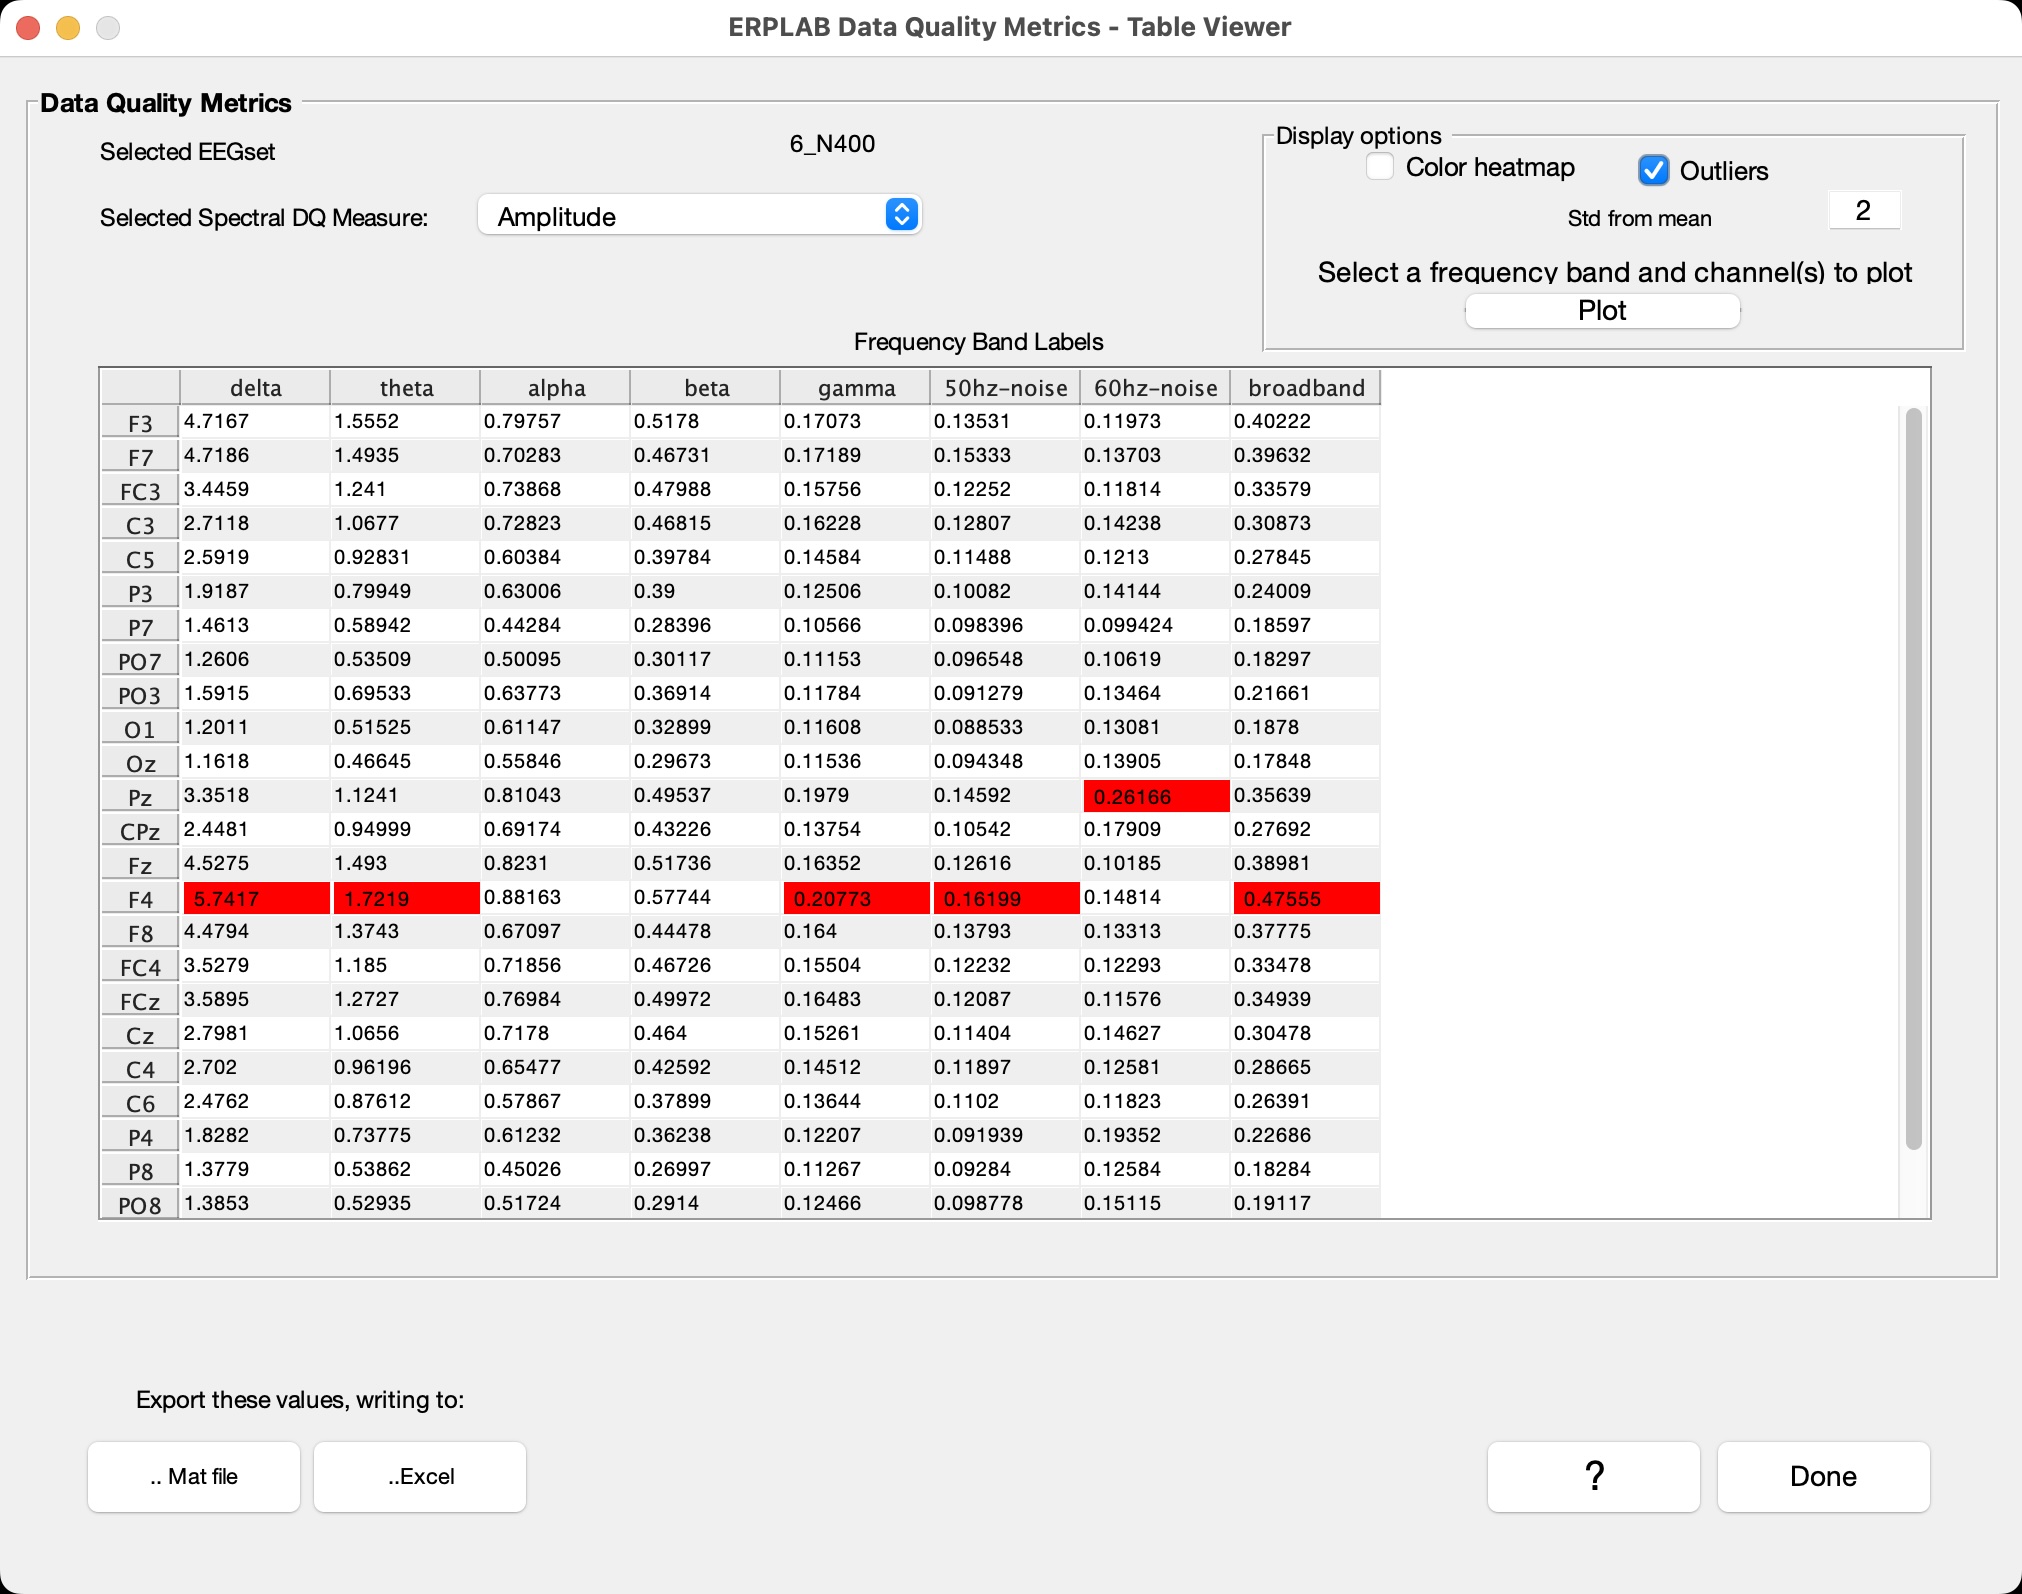
As you can see, the F4 channel contains relatively high amplitudes in both low and high frequencies, and the Pz channel contains relatively high noise near 60 hz (which is the line frequency in the building where the data were recorded). You can see that F4 is unusually noisy by plotting the data just from channels 13–20 with a time range of 30 seconds and a vertical scale of 200 µV. If you scroll through the data, you will see that the F4 channel drifts upward and downward more than the other channels. You can also see a little more high-frequency noise in the Pz channel, but it is difficult to see the 60 Hz oscillations because of the other noise that is present (which is why it is valuable to have the spectral information).
The noise in F4 may make you consider interpolating this channel (using the methods described in the tutorial page on Interpolating Bad Channels). However, this may not be necessary. For a detailed discussion of how to decide whether a channel should be interpolated, see Chapter 7 in Applied ERP Data Analysis.
| Previous Page | Next Page | 🏠 |
|---|---|---|
|
Channels and Locations |
Home |