Studio Tutorial: Averaging and Data Quality - ucdavis/erplab GitHub Wiki
Now that we have assigned events to bins, epoched the EEG, and performed artifact detection, we’re ready to create averaged ERP waveforms for all the bins. First, go to the ERP tab and make sure that no ERPsets are currently loaded in the ERPsets panel. If one or more ERPsets are present, select them and click the Clear button.
Now go back to the EEG tab and make sure that 6_N400_filt_elist_bins_be_ar is selected in the EEGsets menu, and then go to the Compute Averaged ERPs panel.
You should set it up as shown in the screenshot below. It should be set to exclude epochs that were marked during artifact detection. You should also exclude epochs that have a boundary event in them (indicating a discontinuity in the data) or invalid events. Invalid events are extremely rare and are possible only for a few EEG recording systems, so you probably won’t need to worry about them.
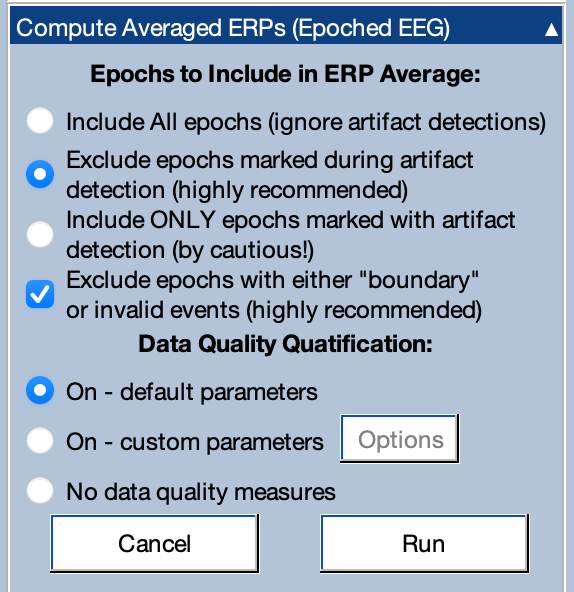
The averaging tool also runs a set of functions to estimate the data quality of the averaged ERPs. To find out about these functions, you can read the manual page about ERPLAB’s data quality metrics. For now, you can leave the panel set to On – default parameters. Note that you can use the Compute Data Quality Metrics panel to compute the data quality metrics without averaging.
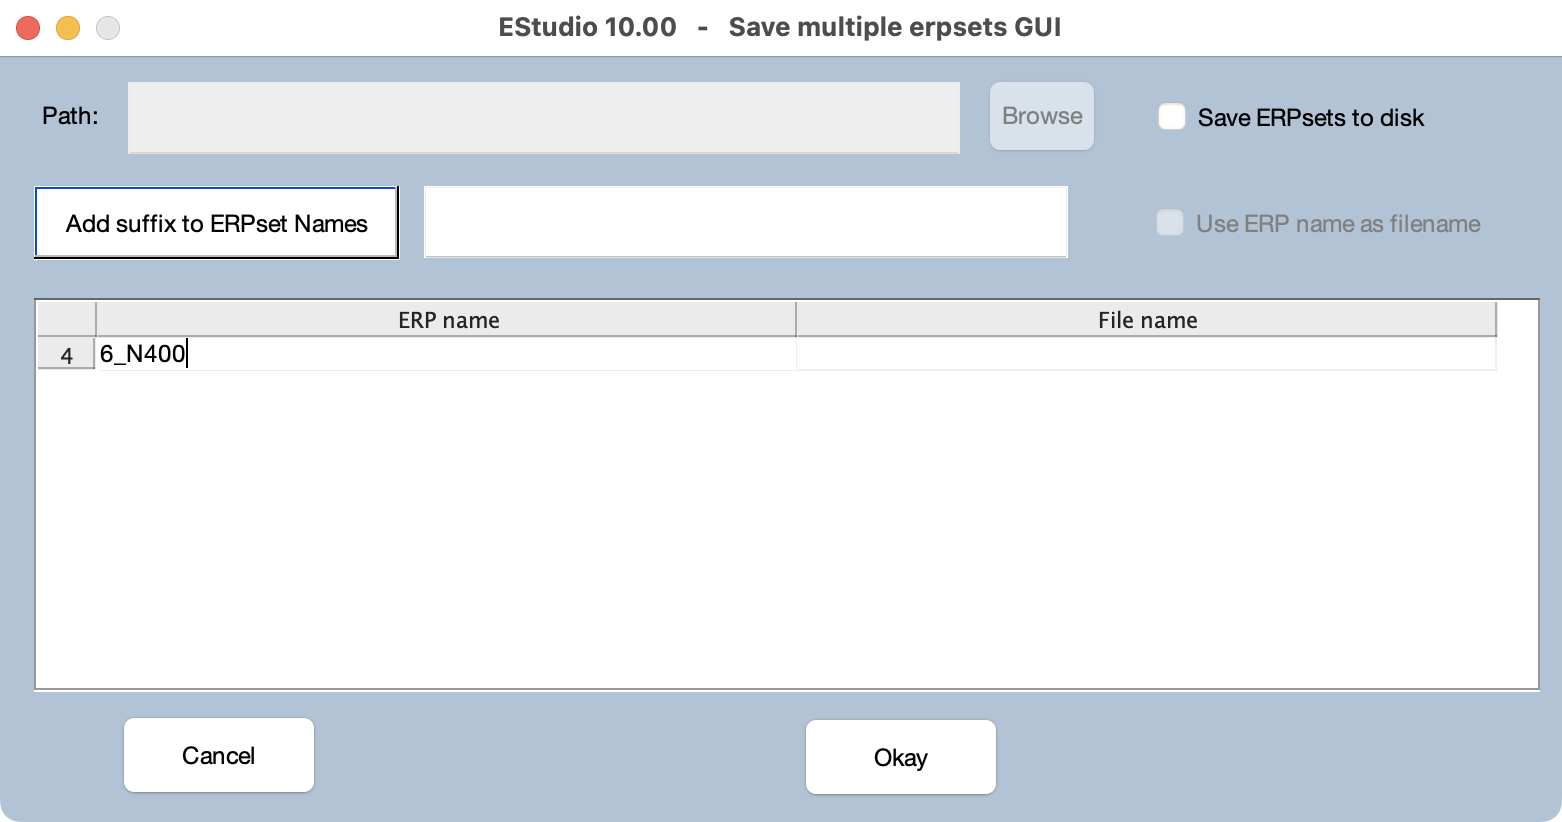
Click Run to create an ERPset containing the averaged ERPs for this subject. You will see a window that will allow you to name the ERPset and (optionally) save it to disk. Change the ERP name to 6_N400 and click Okay.
After a brief delay, you will see a summary of information about the ERPset (see screenshot). This includes a summary of how many trials were included versus rejected from each bin and a summary of the aSME data quality metric (the bin and channel with the best, worst, and median aSME value).
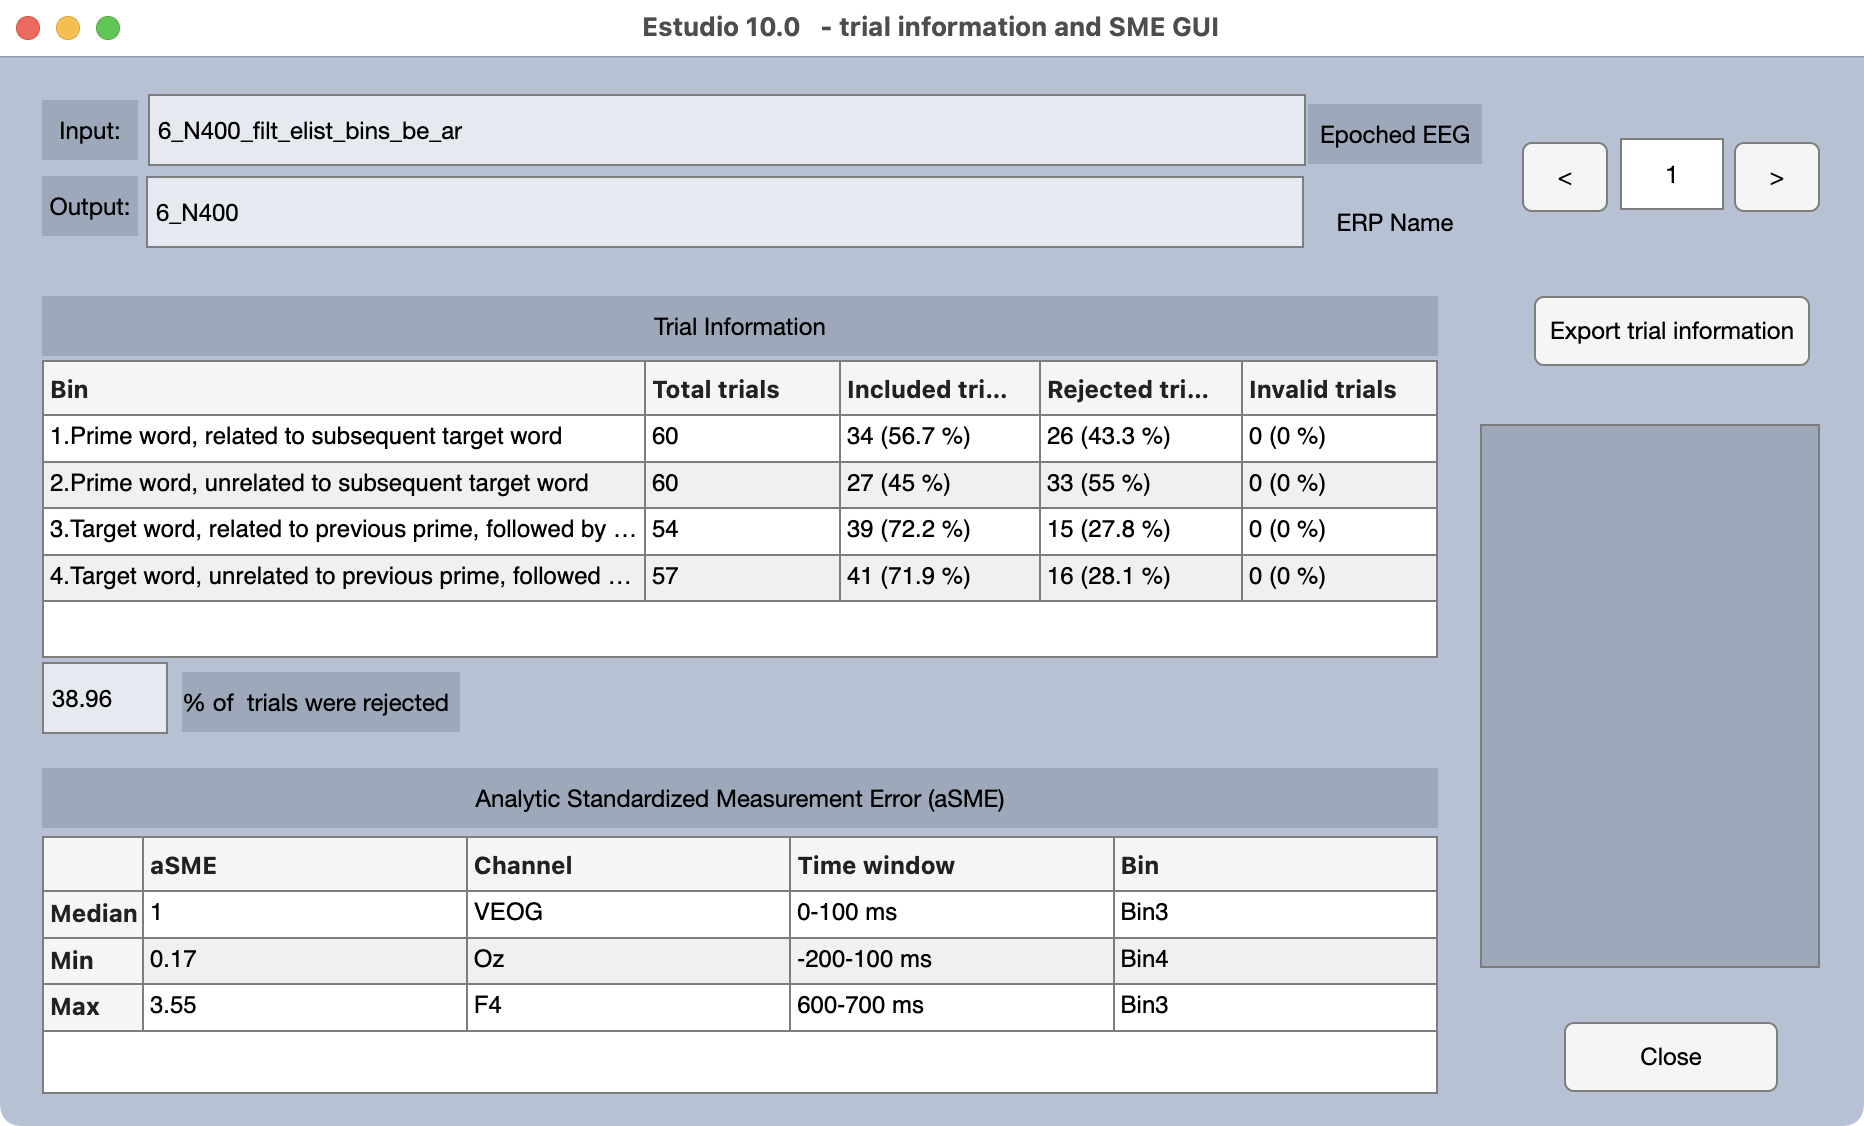
You should now close the window with the ERPset summary. If you want to see this summary again later, you can select one or more ERPsets in the ERPsets panel, go to the ERP & Bin Information panel, and click the Bin Info Table button.
The ERP tab should now be visible in the main ERPLAB Studio window. As shown in the screenshot, you can see that the new ERPset (6_N400) is now visible in the ERPsets panel. The averaged ERP waveforms should also be visible, with all channels and all bins selected in the Bin and Channel Selection panel. You can get various useful pieces of information about the ERPset in the ERP & Bin Information panel.
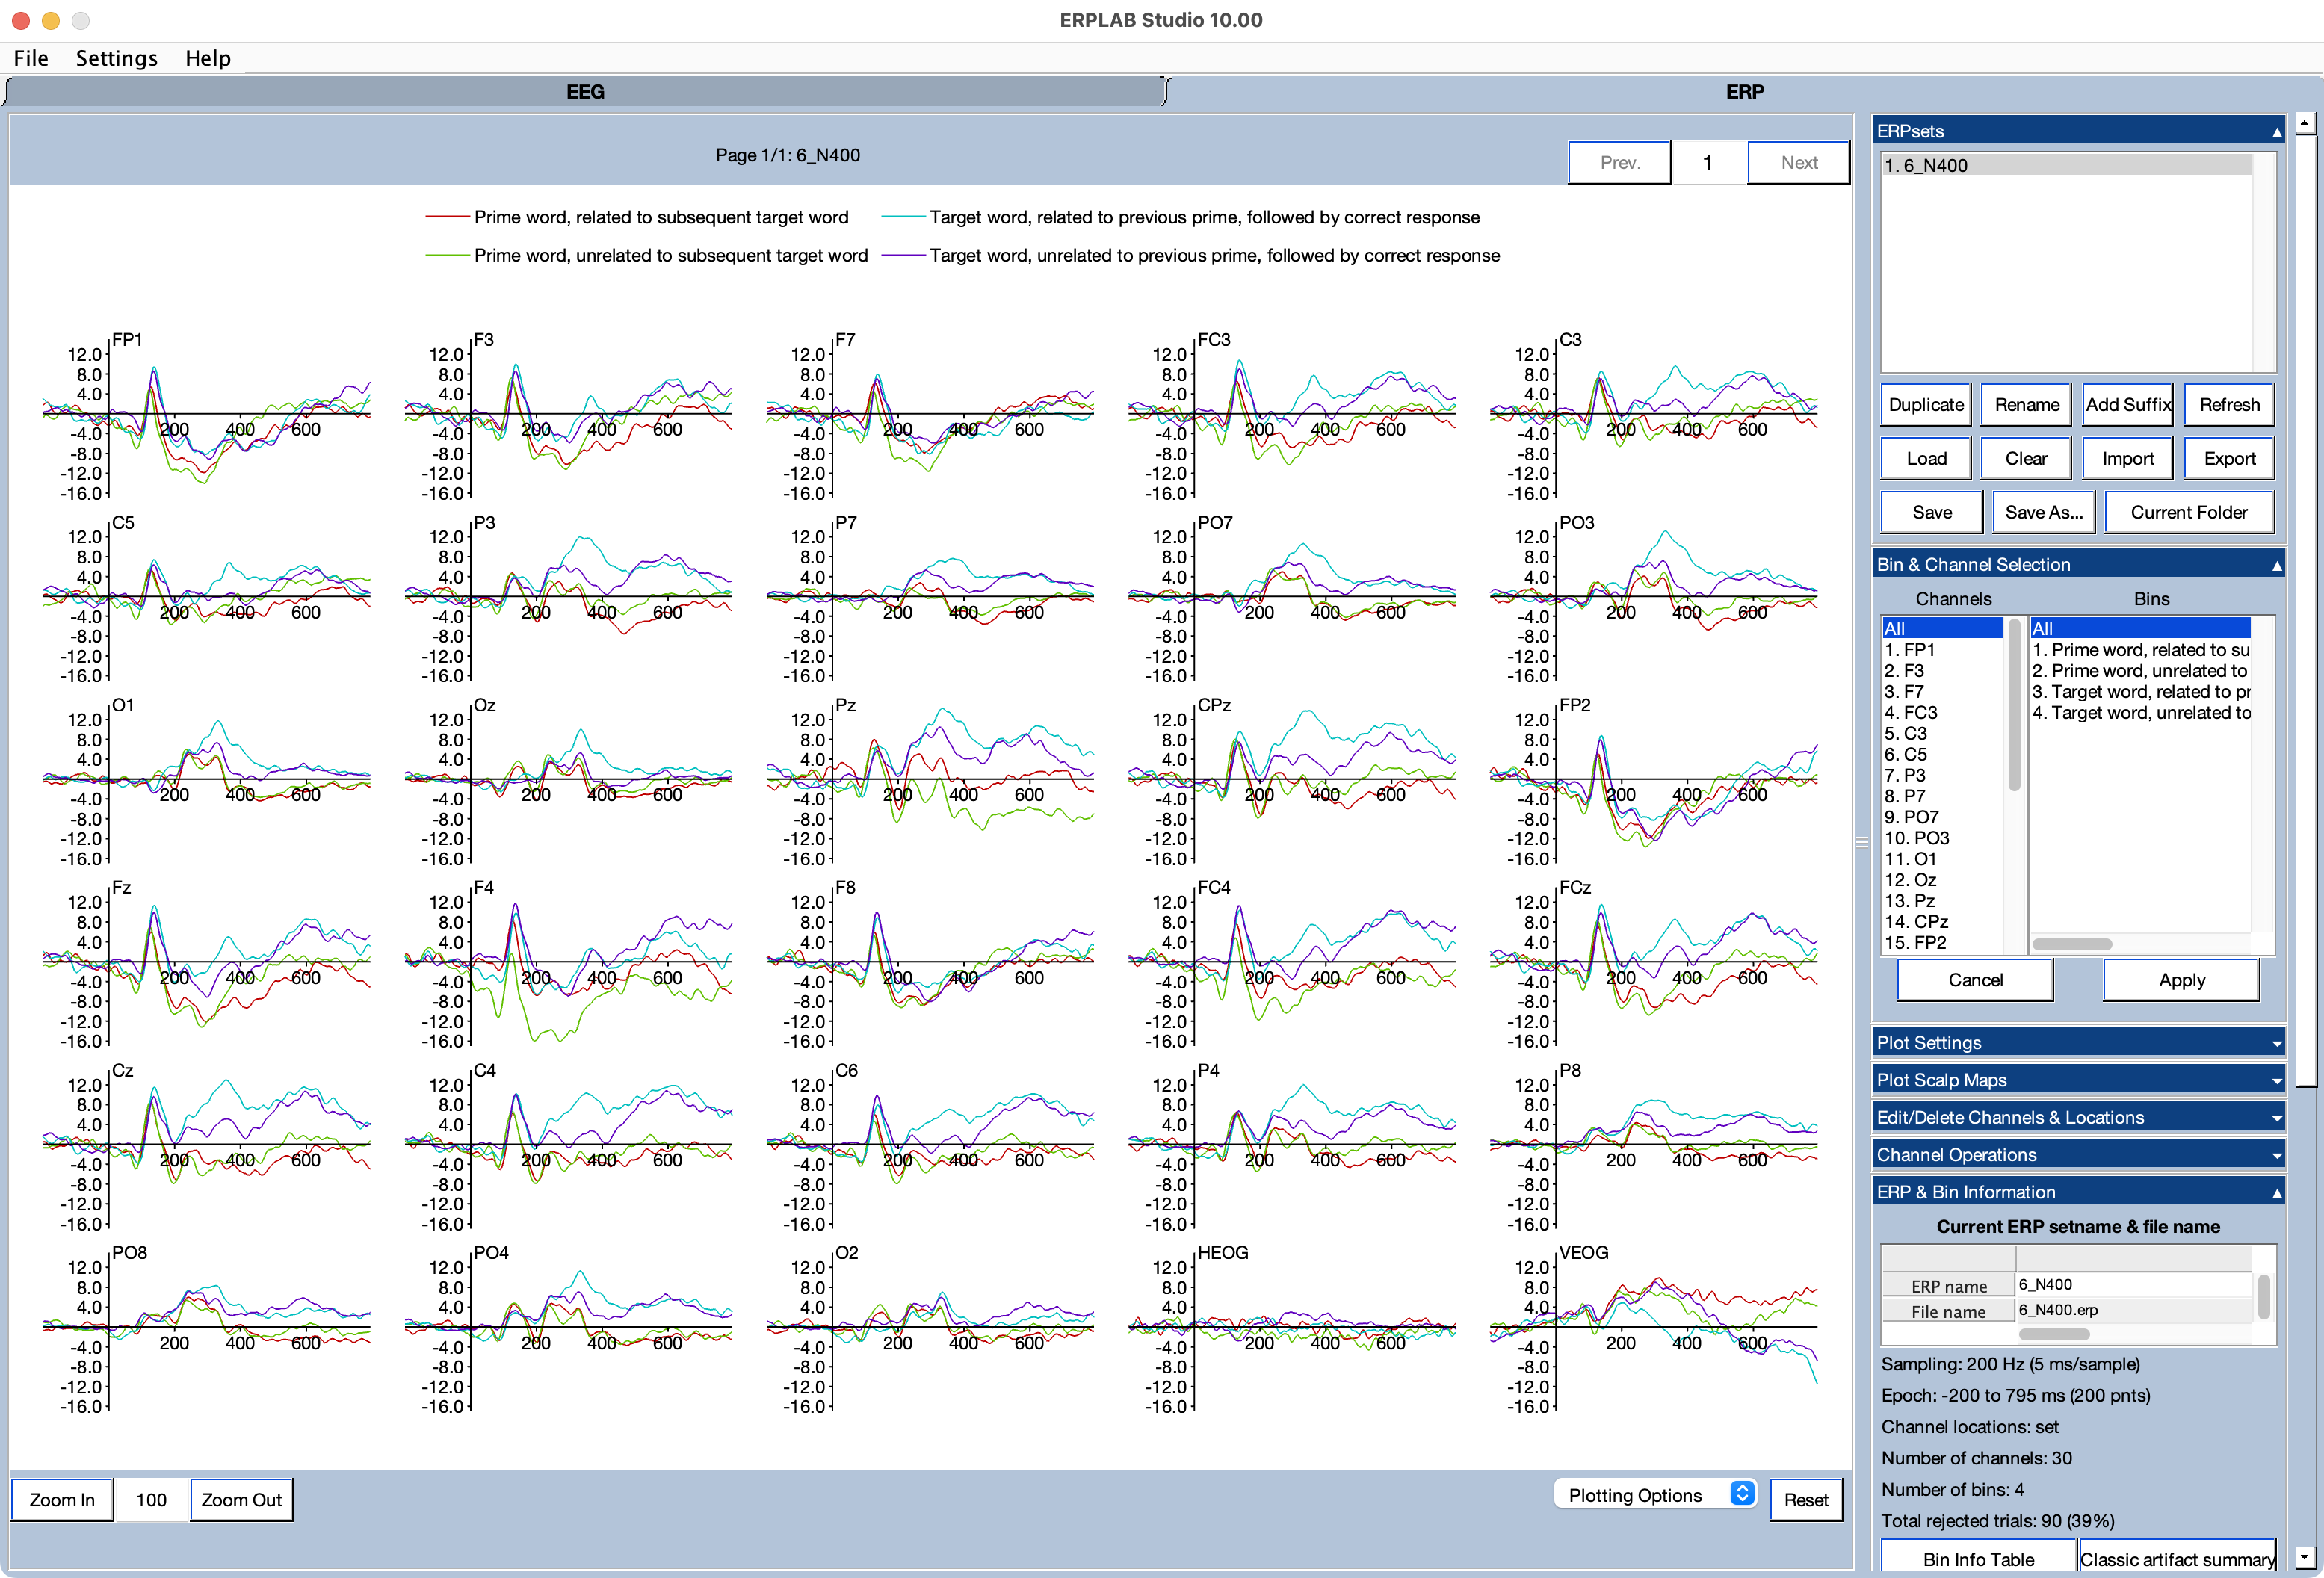
Select the Cz, CPz, and Pz channels (channels 21, 13, and 14) and Bins 3 and 4 in the Bin and Channel Selection panel. Now you can see the classic N400 effect: a more negative (less positive) voltage from ~300-500 ms for the targets preceded by an unrelated prime than for the targets preceded by a related prime.

Multiple EEGsets per Subject
Imagine that you run an experiment with 10 different trial blocks, and you create a different EEG recording file for each block, resulting in 10 different EEGsets for each subject. You will want to average the data across these 10 EEGsets. You have two main options for this.
- You can combine the single-block EEGsets into a single EEGset by loading the EEGsets in the EEG tab, selecting all of them in the EEGsets panel, and then clicking on the Append button in the panel. This will append them all into a single EEGset, which you can then average.
- If you want to keep the EEGsets separate for some reason, you can compute a separate ERPset for each EEGset and then average the ERPsets together using the Average Across ERPsets panel in the ERP tab. Make sure to select the Use weighted average based on trial numbers option in this situation, so that each trial within a bin is given equal weight in the averages.
The ERPset summary table that appeared when you averaged the data contains a tiny bit of information about data quality (the minimum, maximum, and median aSME values). To see all the data quality information, you can go to the View Data Quality Metrics panel in the ERP tab and click the Show in a Table button. This will bring up a window like the one shown in the screenshot below.
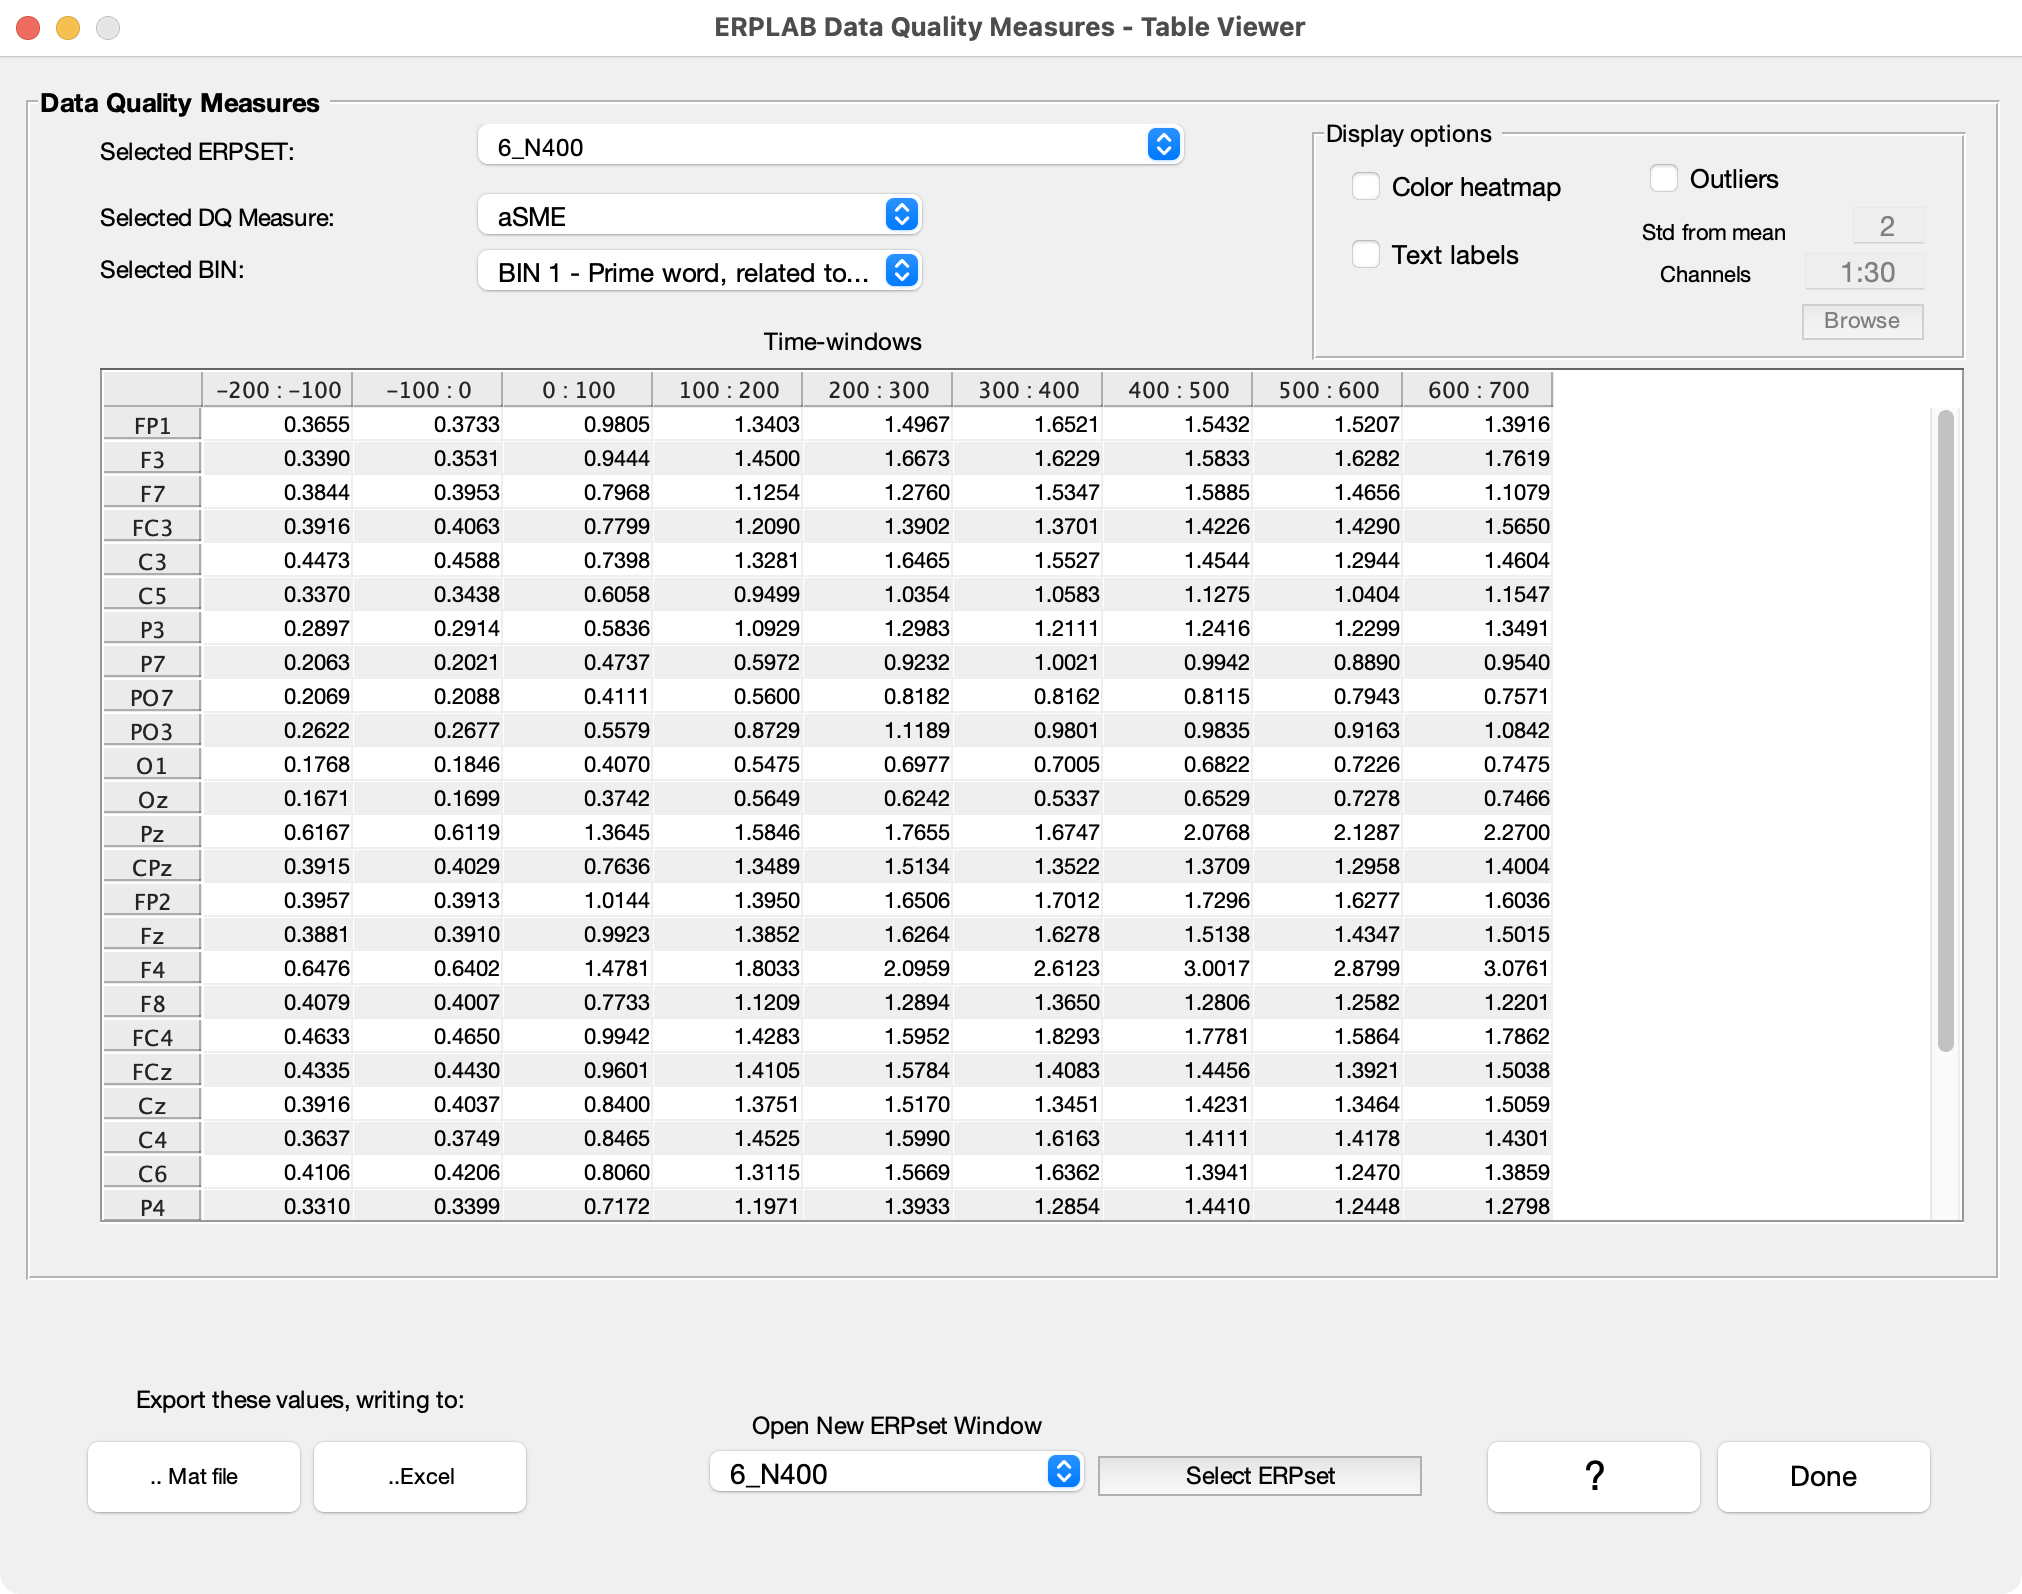
At present, three different metrics of data quality are automatically computed when you average the data, and you can select which to view with the Select DQ Measure menu. The aSME value is the analytic standardized measurement error, which gives you a measure of data quality for the mean amplitude in a given time window. For example, if we were quantifying the N400 as the mean voltage from 300-500 ms, we would use the aSME for 300-500 ms as our metric of data quality. By default, ERPLAB will give you the aSME values for consecutive 100-ms time periods (but you can adjust this by selecting custom values when you compute the averaged ERPs).
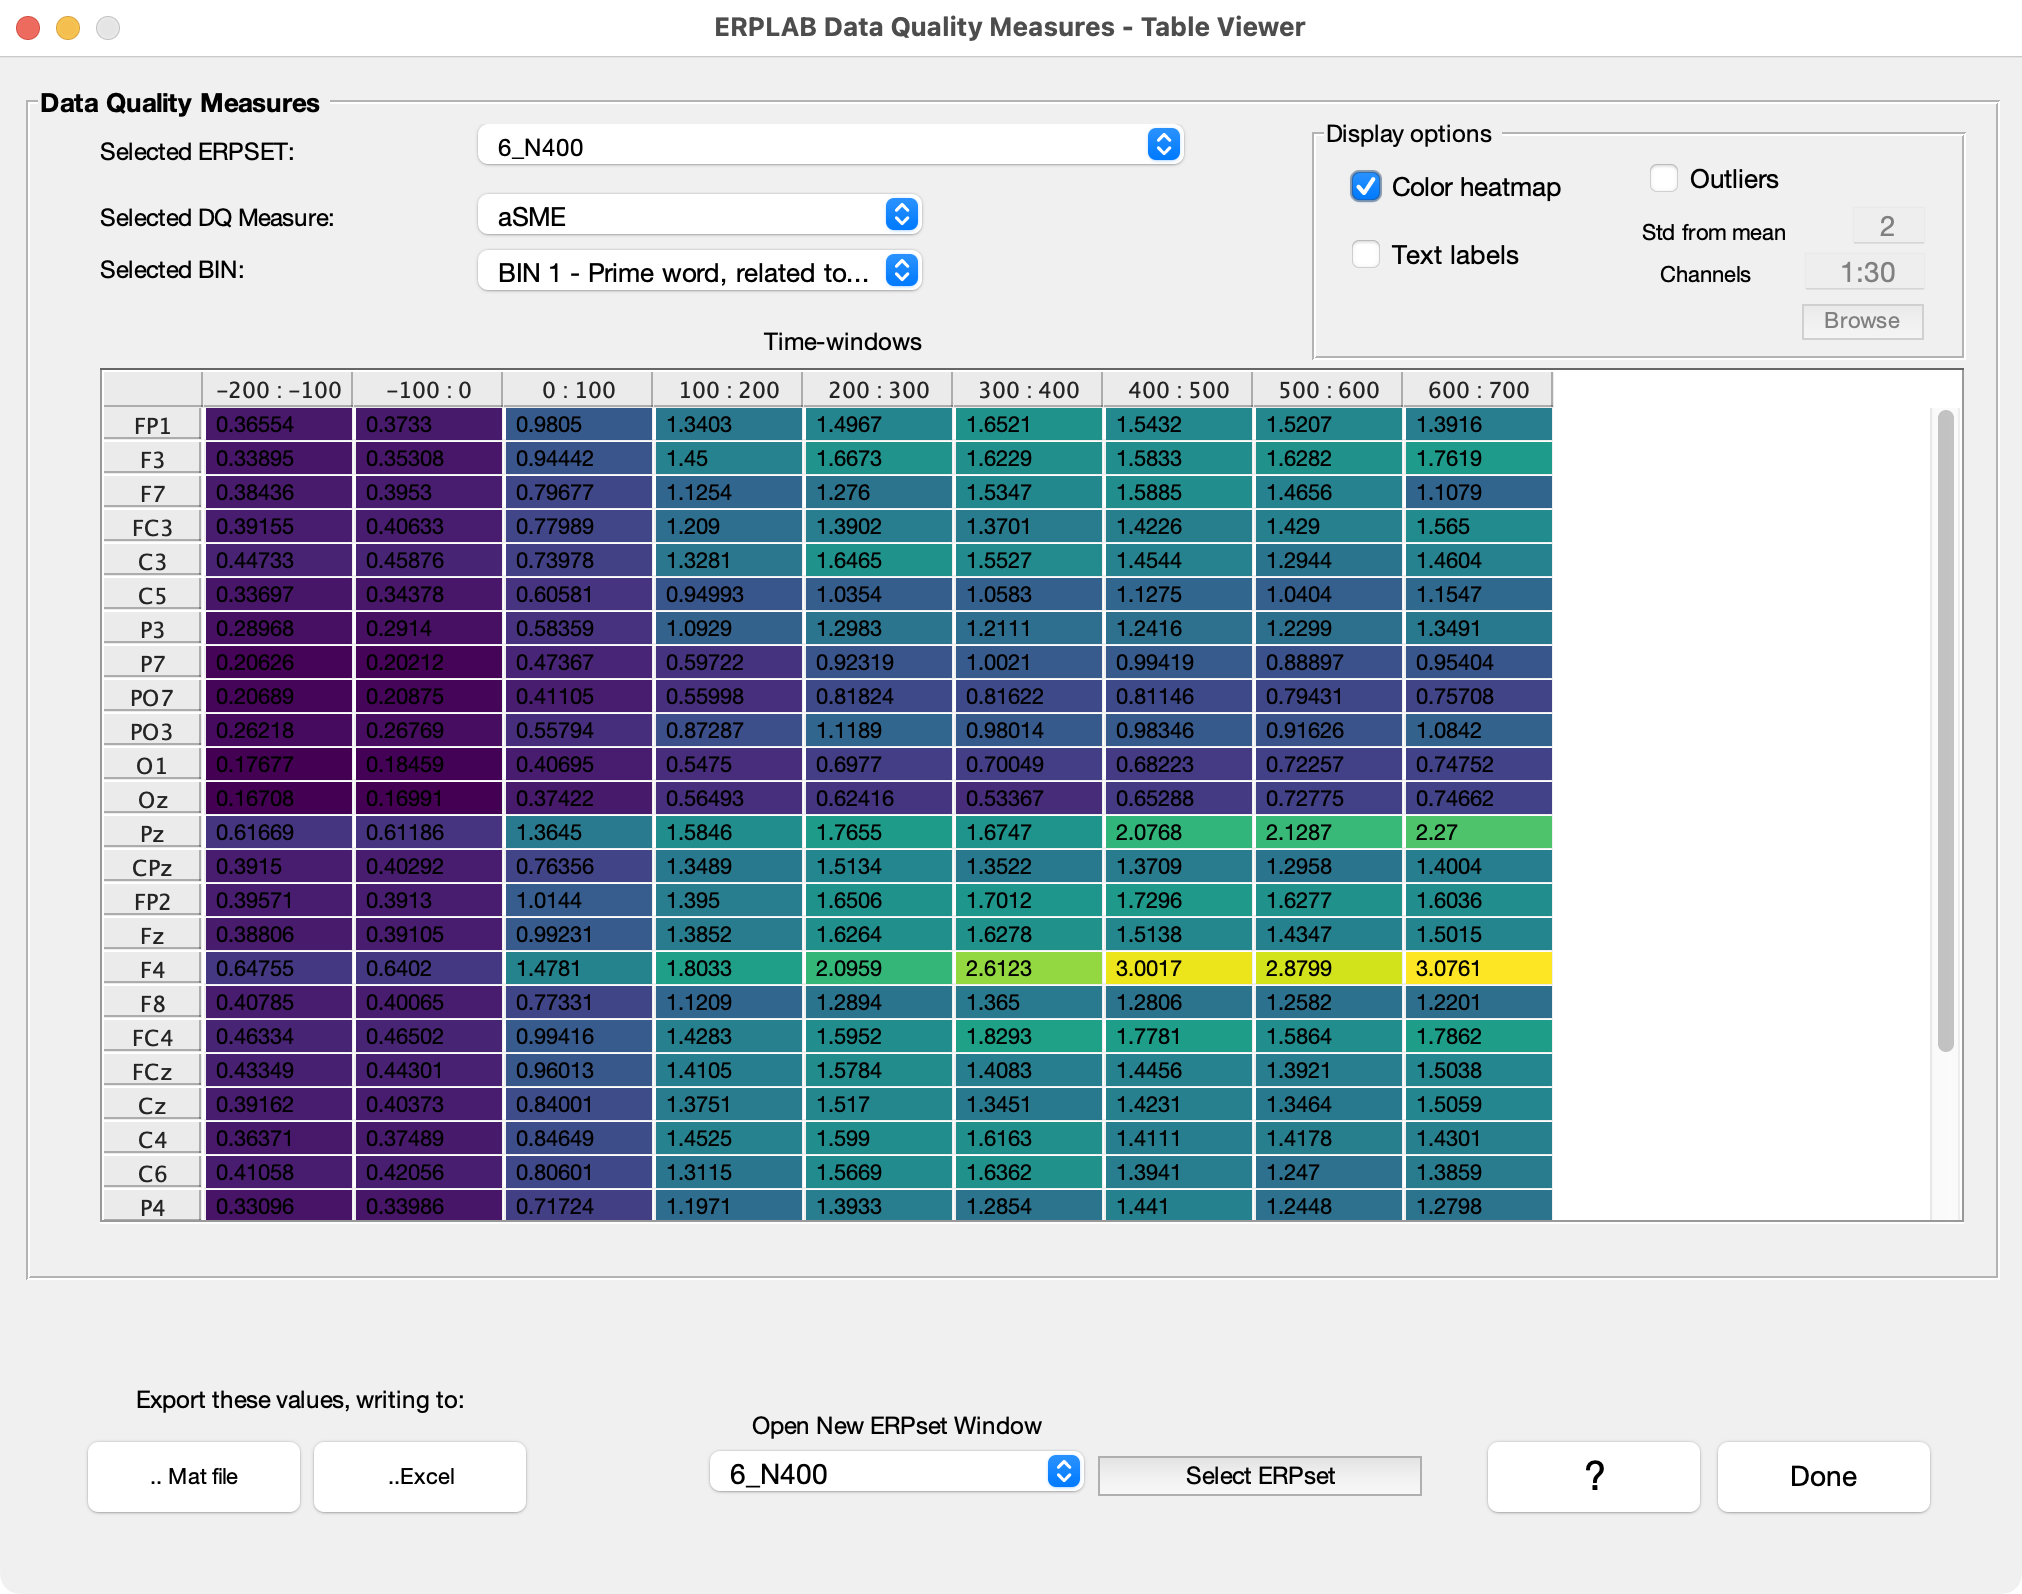
As you can see from the screenshot above, there is a separate aSME value for each time window at each electrode site for a given bin. That’s a lot of information, so you can have it highlight problematic values (large values) by selecting the Color heatmap option. As shown in the screenshot, the F4 electrode site has fairly large values in the later time windows. This suggests that something might be problematic with the data from that electrode site. You can also highlight potentially problematic values by selecting the Outliers option.
| Previous Page | Next Page | 🏠 |
|---|---|---|
|
Artifact Correction |
Home |