Studio Tutorial: Scoring Amplitudes and Latencies with the Measurement Tool - ucdavis/erplab GitHub Wiki
The last major processing step in most ERP studies is to measure or “score” the amplitudes and/or latencies of the ERP components. In this example, we will score the mean amplitude in the N400 time range (300-500 ms) for the semantically unrelated and related targets in the N400 data. We will do this for each of the six participants.
Let’s start by restoring ERPLAB Studio to its default configuration. First, quit and restart ERPLAB Studio. This will make sure that all the EEGsets and ERPsets have been cleared out, and it will also defragment the memory. It’s a good thing to do this from time to time, especially if the software is starting to run slowly or you see odd behavior.
Restarting ERPLAB Studio will clear out the EEGsets and ERPsets, but it doesn’t return the panels to their default settings. ERPLAB remembers your settings in a “working memory” file even when you restart it so you don’t need to keep changing the settings back to your preferred values. But to make sure everything in this tutorial works right, we’ll go back to the default settings by clicking the Reset button under the lower right corner of the plotting area. You will then see a window that allows you to specify what to reset. Tell it that you want to Restore default parameters for ERP panels.
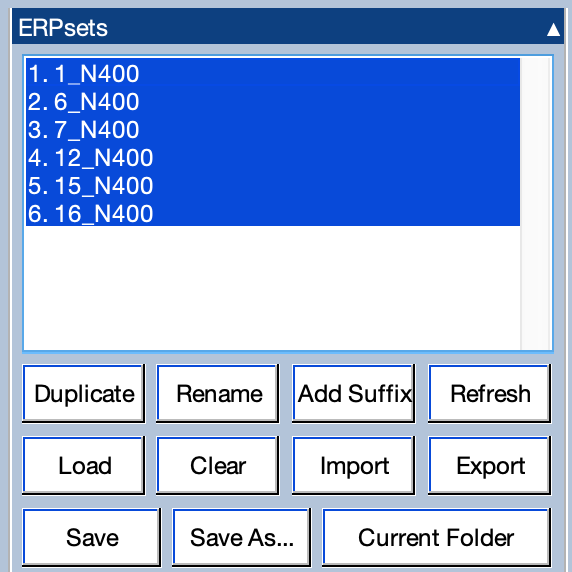
Now go to the ERPsets panel and load the ERPsets for the six participants in the tutorial dataset (1_N400, 6_N400, 7_N400, 12_N400, 15_N400, 16_N400). Once they have loaded, select all six ERPsets by shift-clicking, option-clicking, control-clicking, or whatever works in your operating system.
Now go to the Measurement Tool panel and set it up as shown in the screenshot below. The measurement Type will be Mean amplitude between two fixed latencies. We’re going to measure from all six ERPsets, so ERPset should be set to 1:6. We’re going to measure from the target stimuli that were related and unrelated to the preceding prime stimuli. If you click the Browse button on the Bin line, you will see that these are bins 3 and 4, so set the Bin box to 3 4.
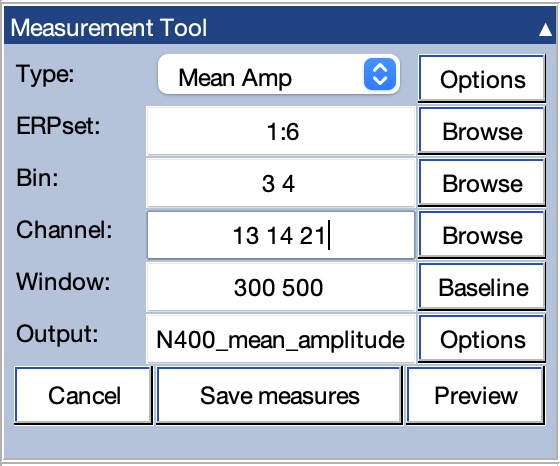
We are going to measure from the Cz, CPz, and Pz channels. You can select these channels by clicking Browse on the Channel line. That will give you channels 13, 14, and 21 (corresponding to Pz, CPz, and Cz, respectively).
We’re going to measure the mean voltage from 300–500 ms, so put 300 500 in the Window box. Finally, put N400_mean_amplitude in the Output box. This is the name of the text file where the amplitude values will be written (in the current folder).
It’s a very good idea to visualize the measurements on the actual ERP waveforms so you can make sure that the measurement parameters are actually appropriate for the data. To do this, click the Preview button. In the window that appears, set Show bins to All and set Show chans to All and Separate as shown in the screenshot below.
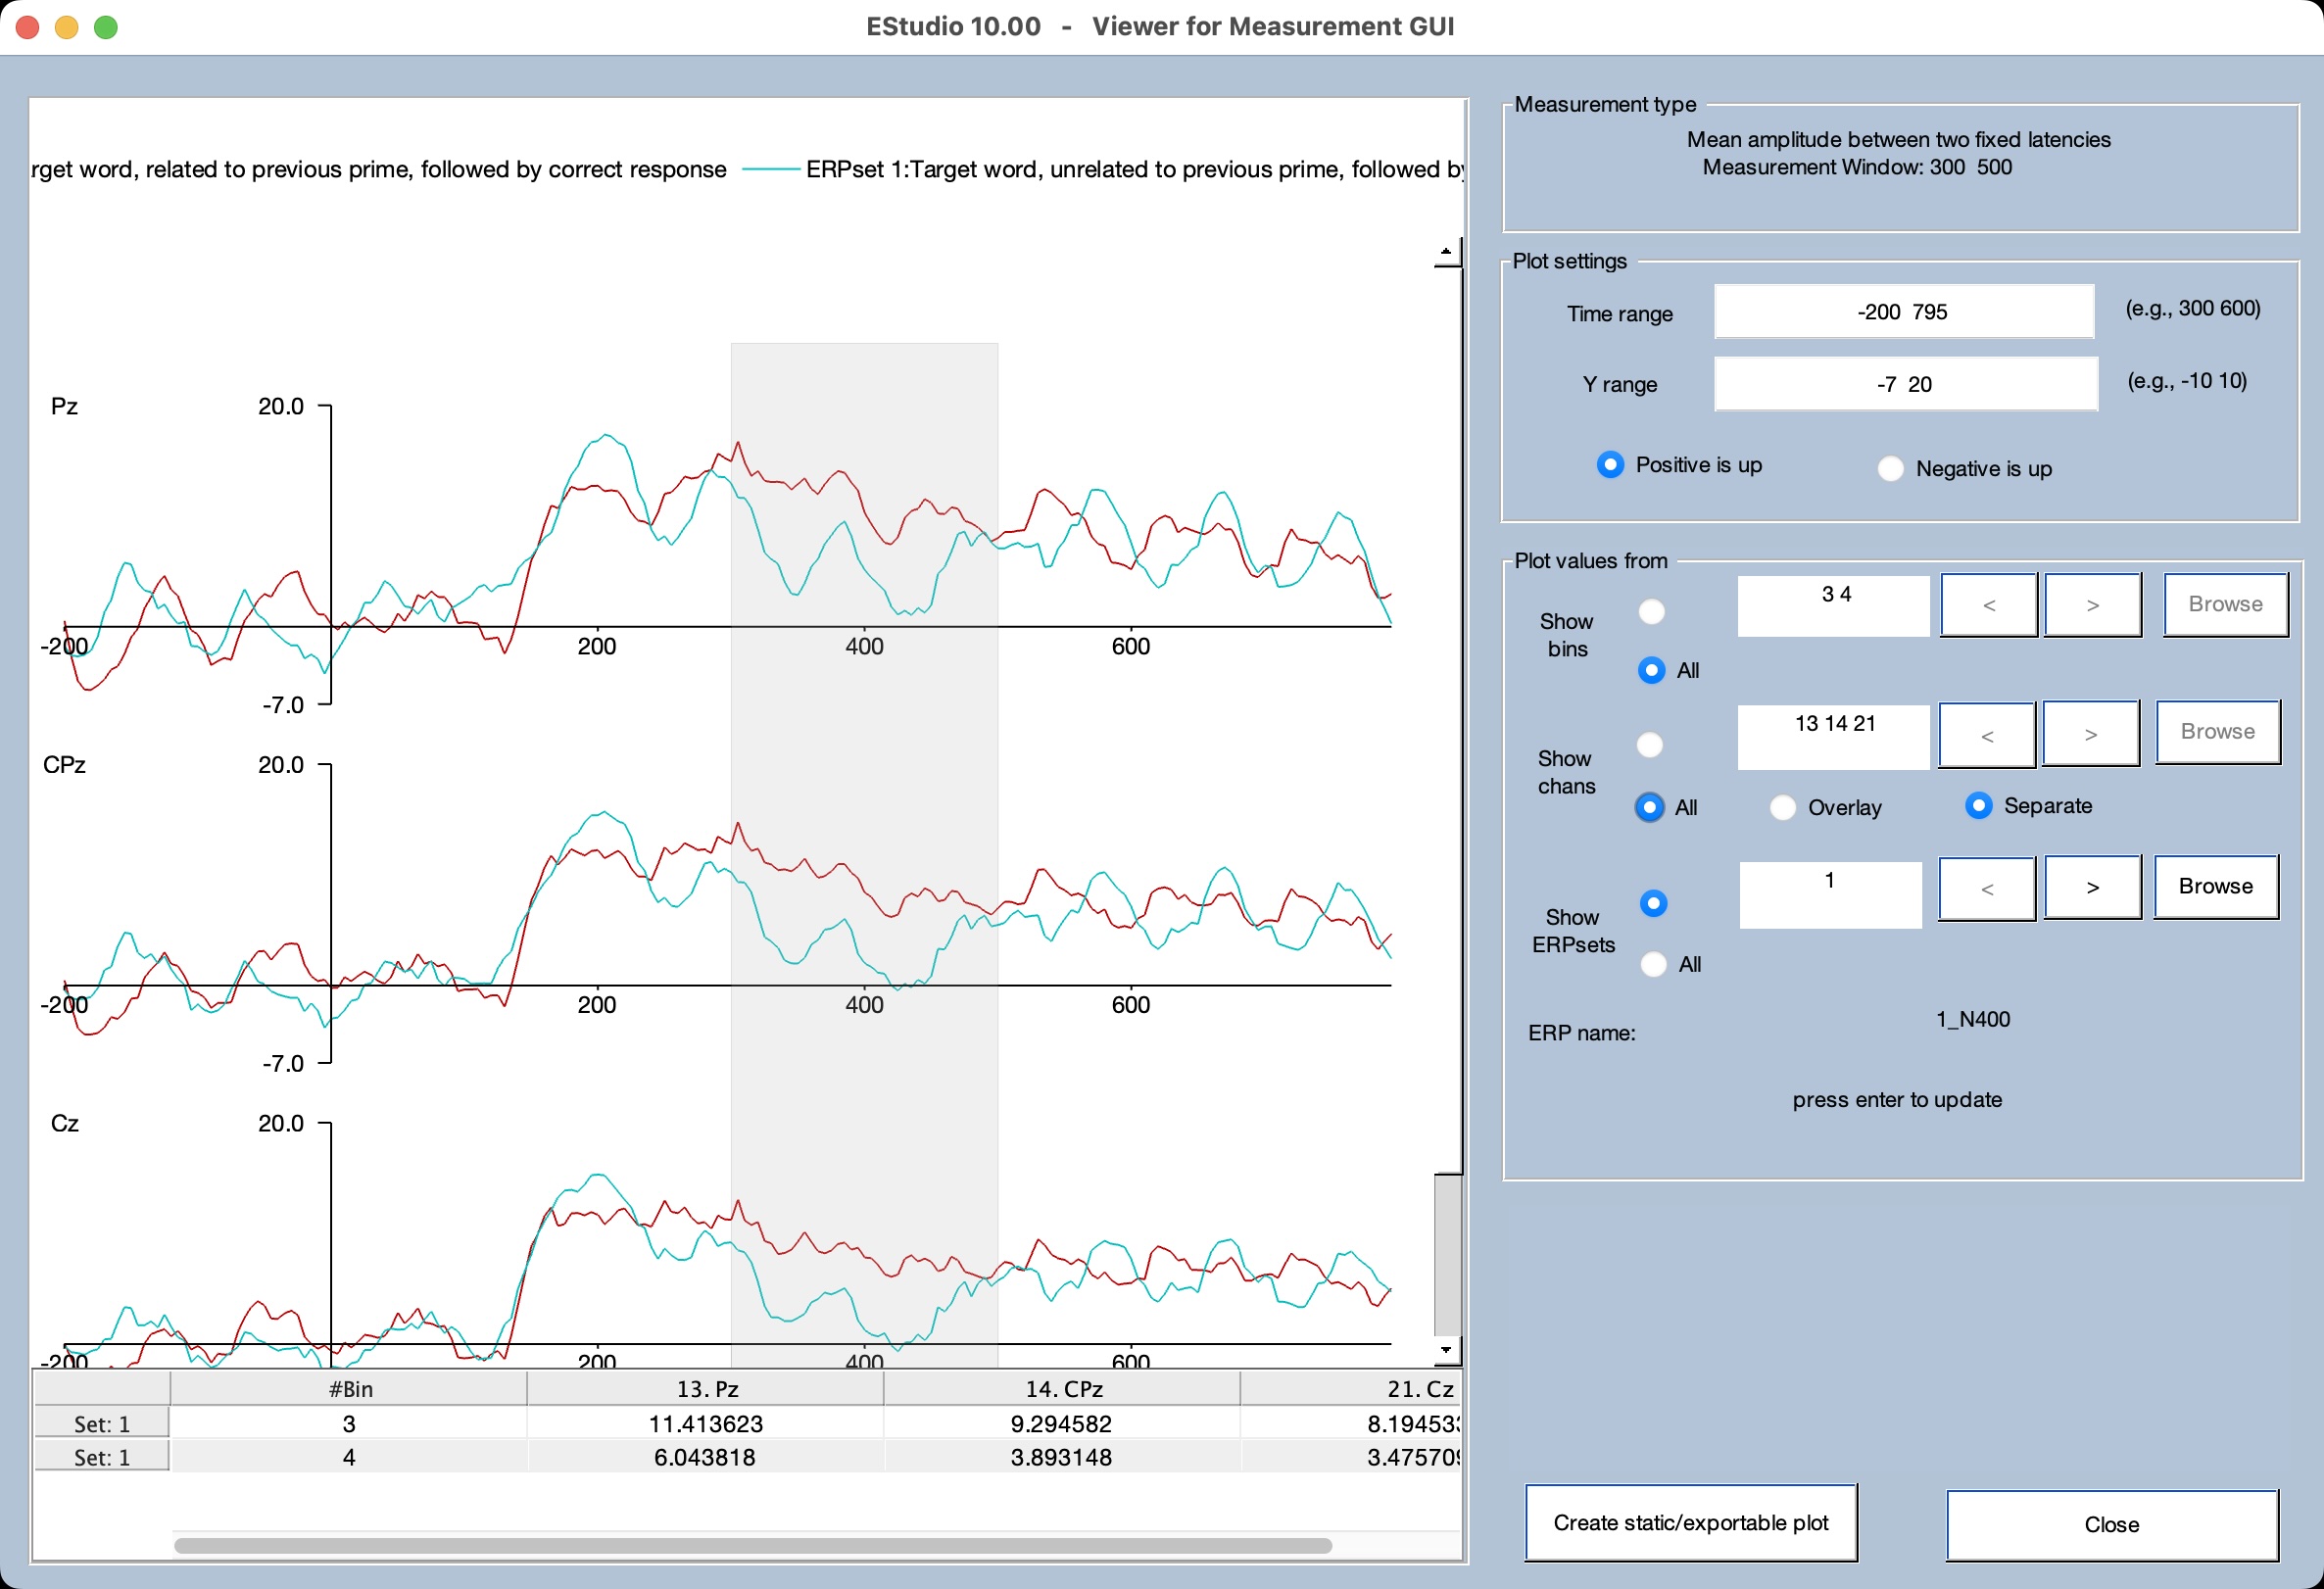
You can now see the waveforms overlaid on top of the measurement window (indicated with the gray shading). The measured values are shown in the table at the bottom of the window. The data from the first ERPset are currently being shown, but you can see the data for the other ERPsets by clicking the < or > buttons in the Show ERPsets line (or typing a number in the text box). You can also overlay the data for all the ERPsets by selecting All in the Show ERPsets line.
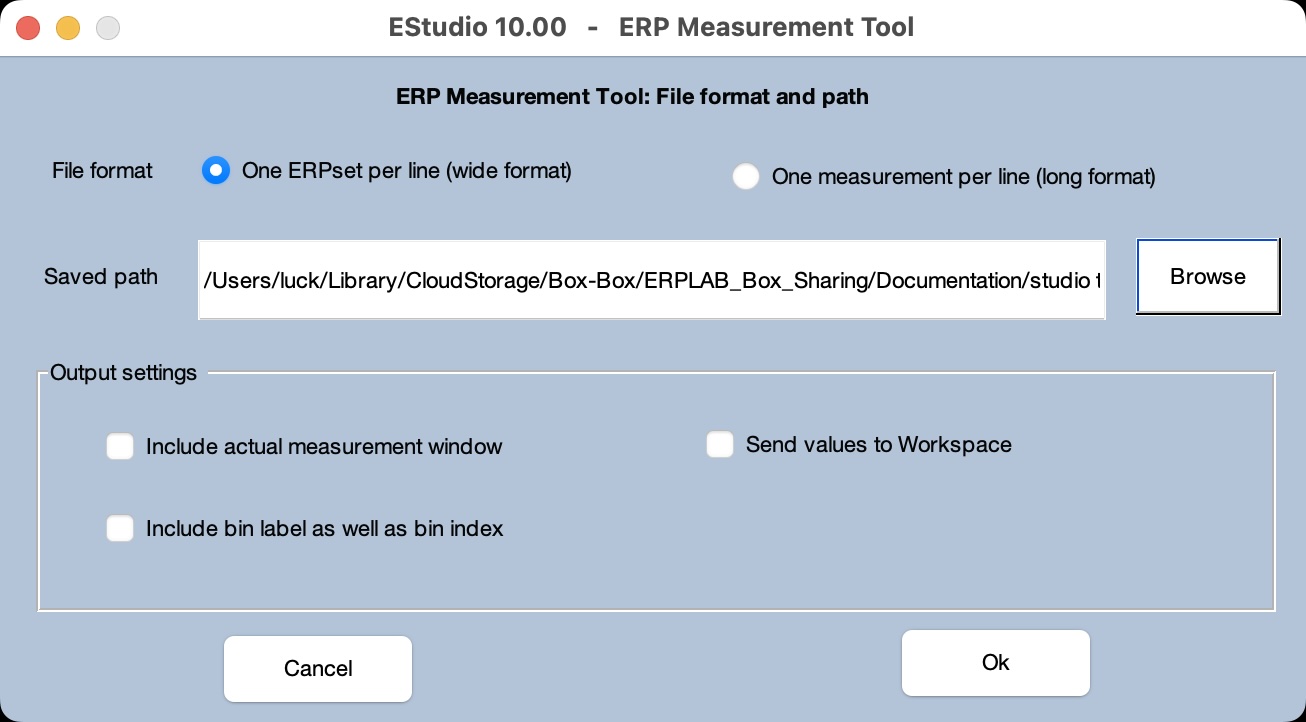
Once you are finished previewing the scores, click Close to close the preview window and go back to the Measurement Tool panel. We're almost ready to save the measured values to a text file, but first we need to specify the format of the information that will be saved in the file. To do this, click the Options button on the Output line, select One ERPset per line (wide format), and click OK.
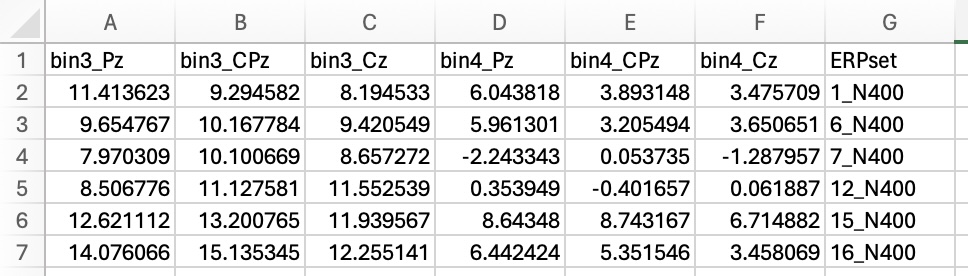
Now go back to the Measurement Tool panel and click Save measures. This will cause a file named N400_mean_amplitude.txt to be created in the Current Folder. If you open the file in a spreadsheet program such as Excel, you should see something like the screenshot below. With the wide format, each row corresponds to one ERPset (typically one participant) and each column corresponds to a combination of a bin and channel. This format is useful for creating spreadsheets and for ANOVA-oriented programs such as JASP.
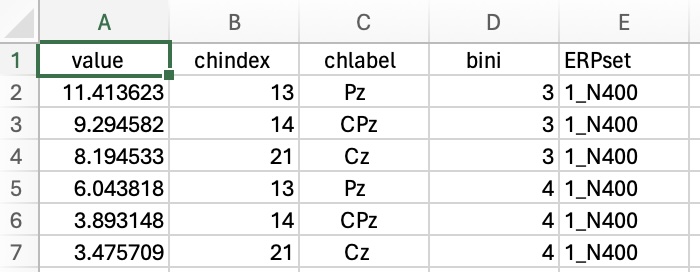
Now let's try it with the long format. Click the Options button on the Output line, select One measurement per line (long format), and click OK. Go back to the Measurement Tool panel and click Save measures again. This will overwrite the N400_mean_amplitude.txt file. If you open the file in a spreadsheet program, you should see something like the screenshot below. With the long format, each row contains the value from a single ERPset, channel, and bin. This format is useful for (typically one participant) and each column corresponds to a combination of a bin and channel. This format is useful for regression-oriented statistics packages such as R.
| Previous Page | Next Page | 🏠 |
|---|---|---|
|
Shifting Event Codes |
Home |