Studio Tutorial: Making a Grand Average - ucdavis/erplab GitHub Wiki
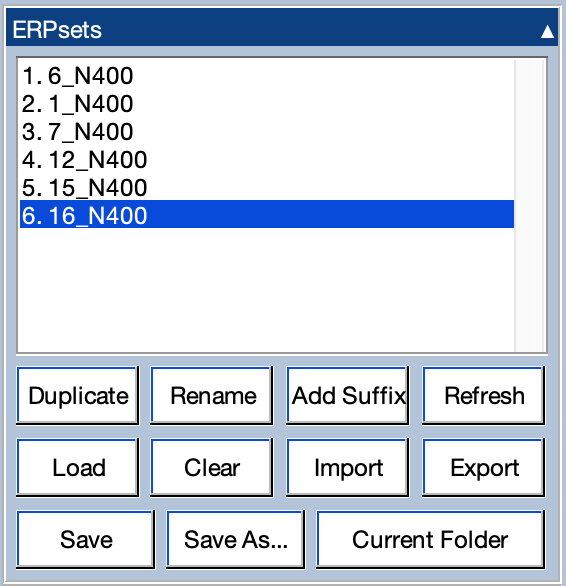
Our next step will be to make a grand average of the data from the six participants provided in the tutorial dataset. Go to the ERPsets panel in the ERP tab and click Load. Your operating system’s standard window for opening files will appear, and you should select the ERP files from the other five participants in the folder (1_N400, 7_N400, 12_N400, 15_N400, 16_N400). The result should look the screenshot, with 16_N400 being selected and shown in the plotting region.
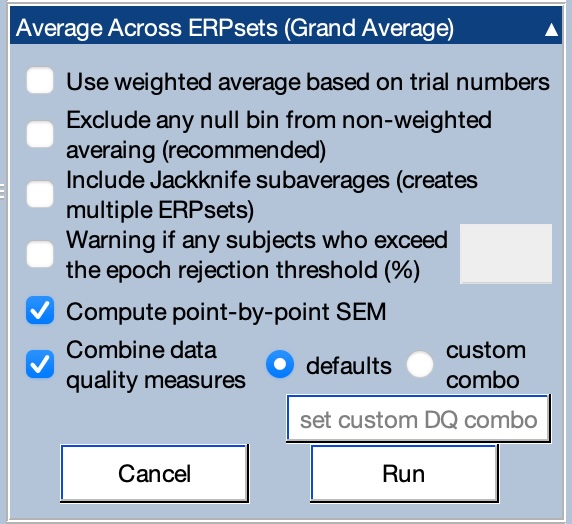
Now select all six ERPsets by shift-clicking, option-clicking, control-clicking, or whatever works in your operating system. Next, open the Average Across ERPsets panel and make sure it is set up as shown in the screenshot. Click Run to make the grand average of these six ERPsets. The standard window for naming and saving ERPsets will appear, and you should name the ERPset grand. Click OK.
You will now see grand as the selected ERPset in the ERPsets panel, and you will see the grand average ERPs shown in the plotting region. It should look like the screenshot below (assuming you still have the custom grid layout set from the page on plotting ERPs).
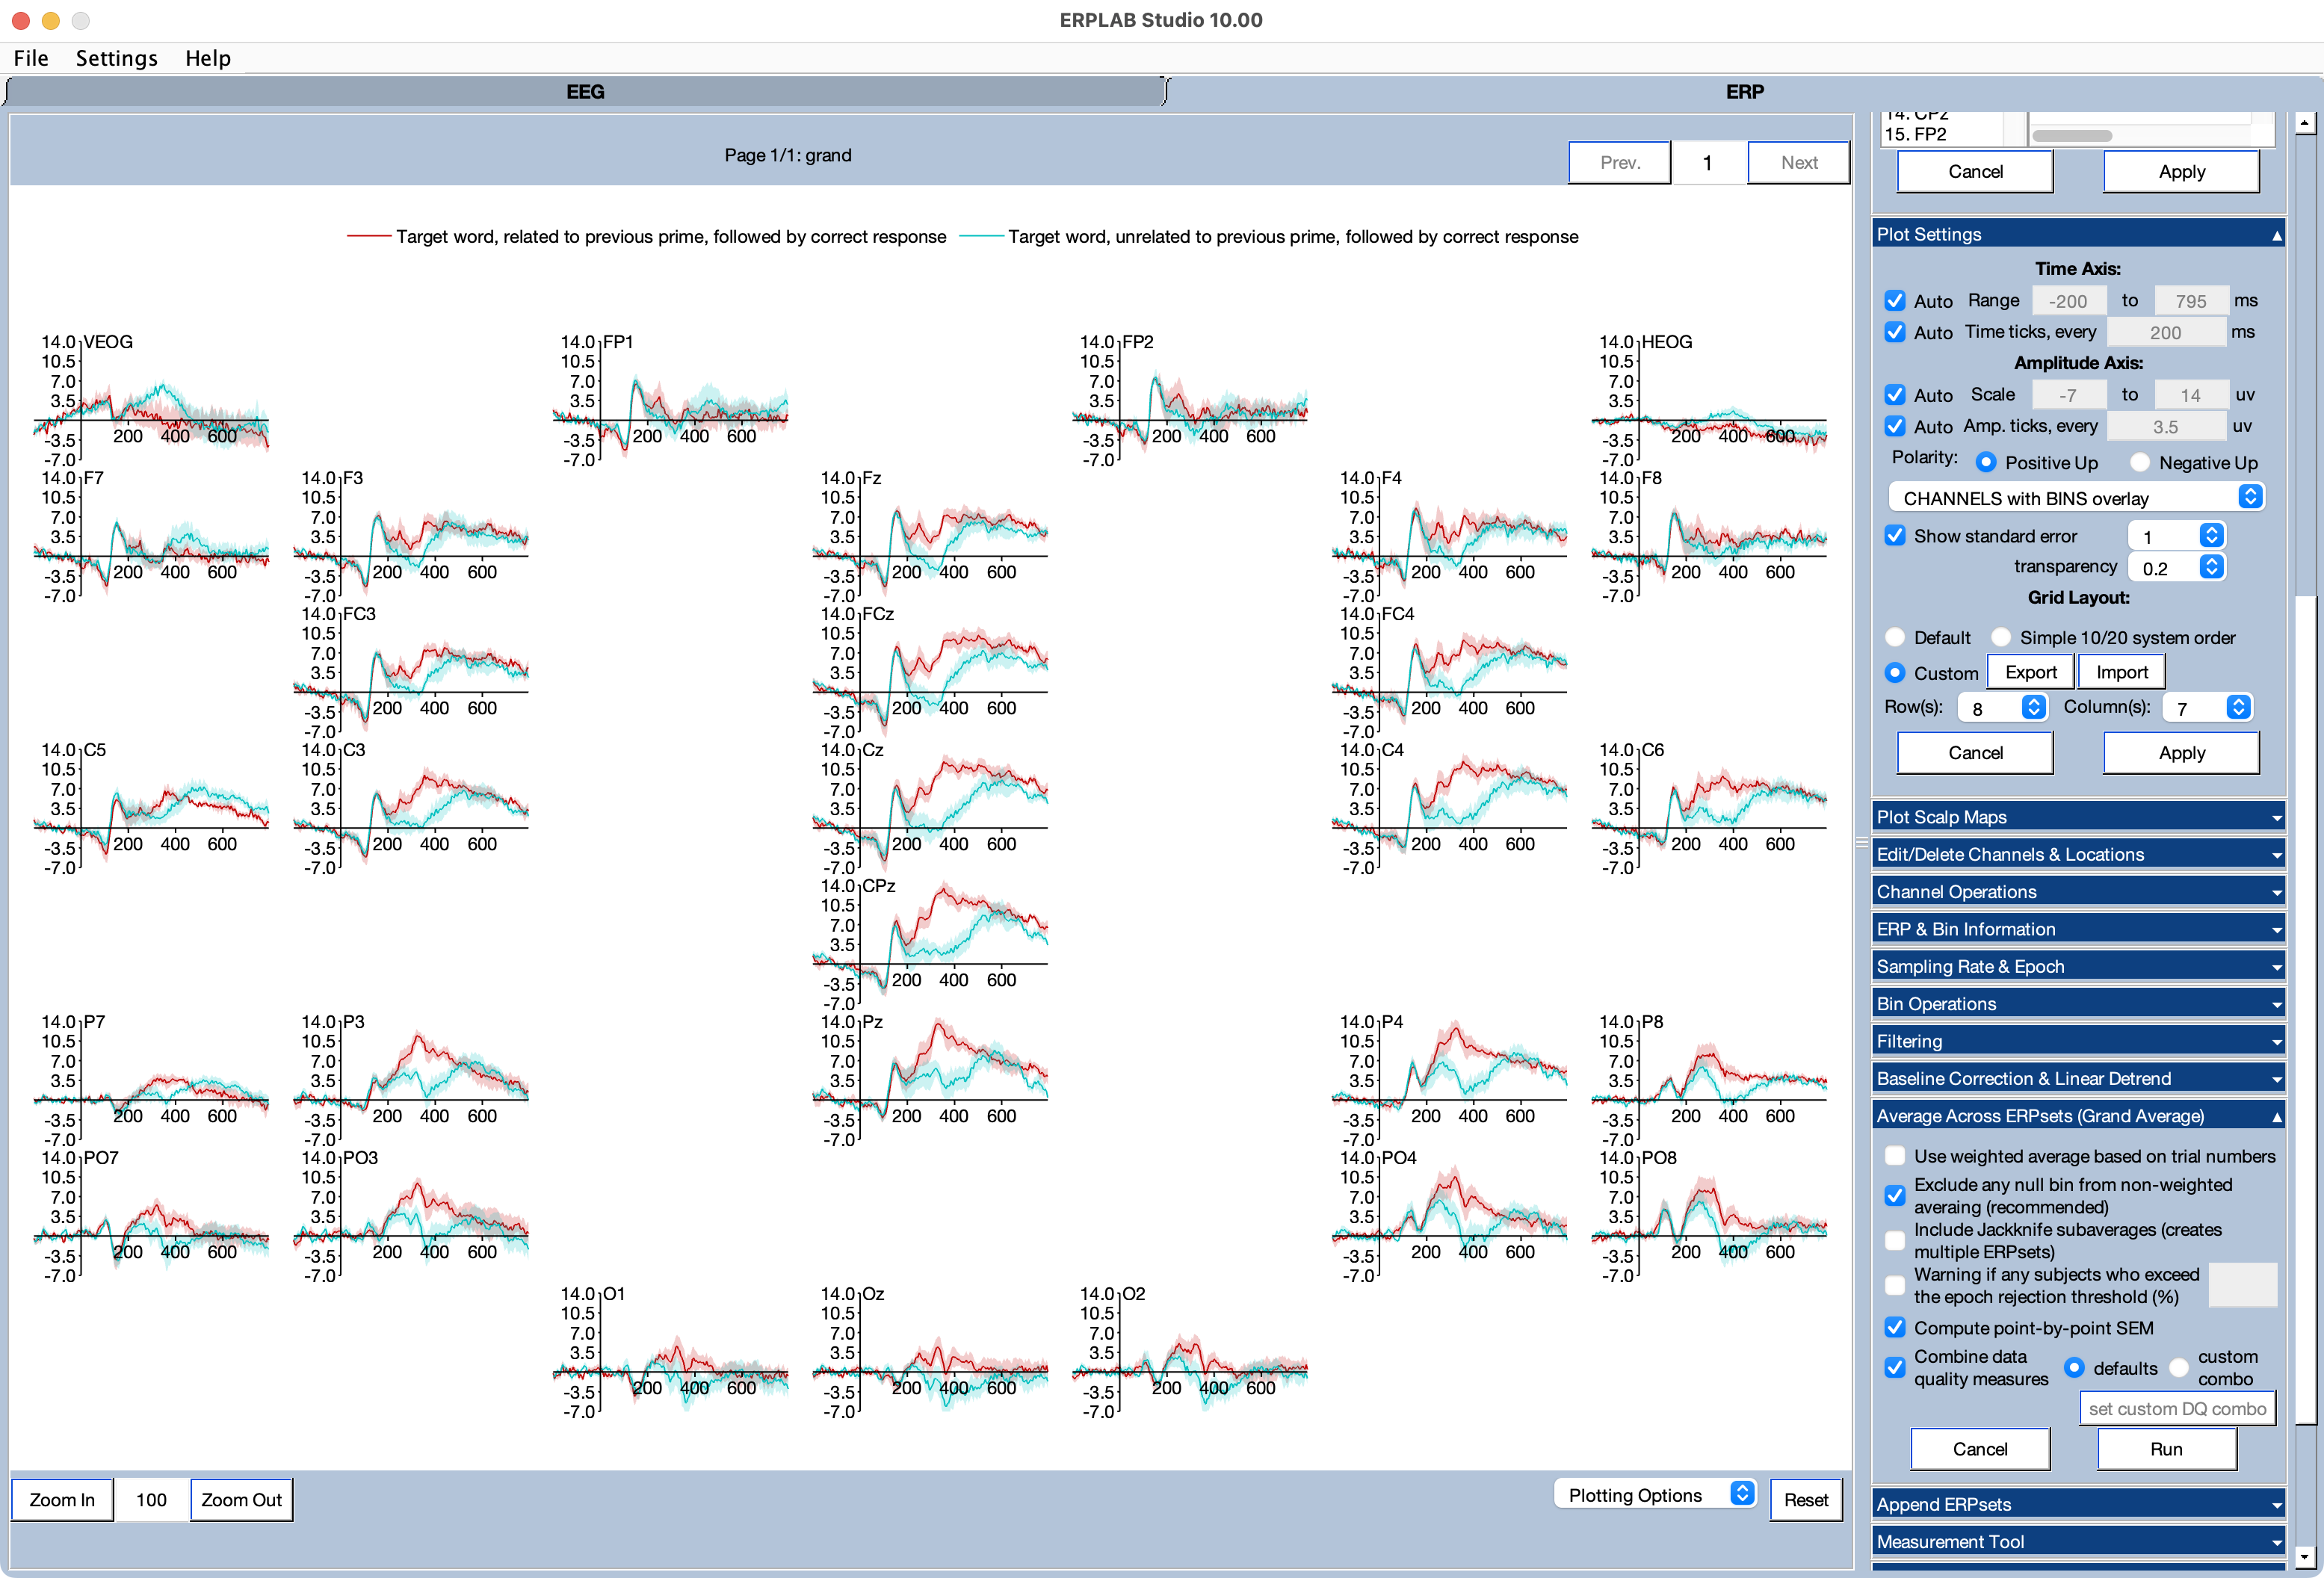
You can see that the unrelated targets produce a more negative voltage than the related targets, especially at midline central and parietal electrode sites (the classic N400 priming effect).
Notice that the standard error shading here represents the standard error of the average across participants. By contrast, when you plotted the data from a single participant, the standard error shading represented the standard error of the average across trials.
In ERPLAB, a grand average ERPset is just another ERPset. That is, ERPLAB doesn’t “know” that it’s an average across participants. It’s just a file with a mean voltage value at each time point for each channel, along with the standard error of that mean voltage.
| Previous Page | Next Page | 🏠 |
|---|---|---|
|
Bin Operations |
Home |