Studio Tutorial: Plotting Averaged ERPs - ucdavis/erplab GitHub Wiki
We’ve already seen how to create an ERPset containing averaged ERP waveforms. Now we’re going to go through the most common ERP processing stages. We’ll begin by taking a closer look at how ERPs are plotted.
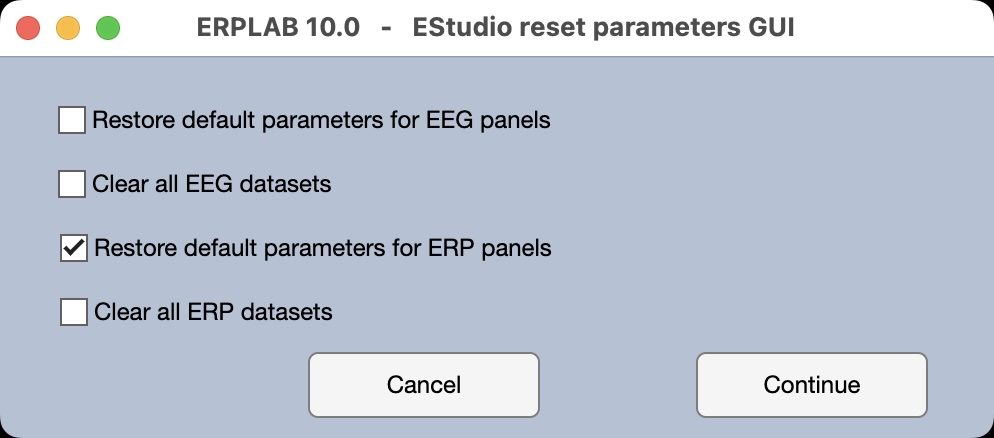
If you don’t already have the 6_N400 ERPset loaded, go to the ERPsets panel in the ERP tab, click Load, and select 6_N400.erp. To make sure you’re using the default settings, click on the Reset button just under the lower right corner of the plotting region. Select Restore default parameters for ERP panels in the window that appears and click Continue.
We’re going to focus on the ERPs elicited by the targets, so select Bins 3 and 4 in the Bin & Channel Selection panel and click Apply. You should now see the ERP waveforms for unrelated and related targets in the plotting region.
Now click Show standard error in the Plot Settings panel and then click Apply. You should see something like the screenshot below, with the standard error of the mean shown at each point in each waveform as a shaded region.
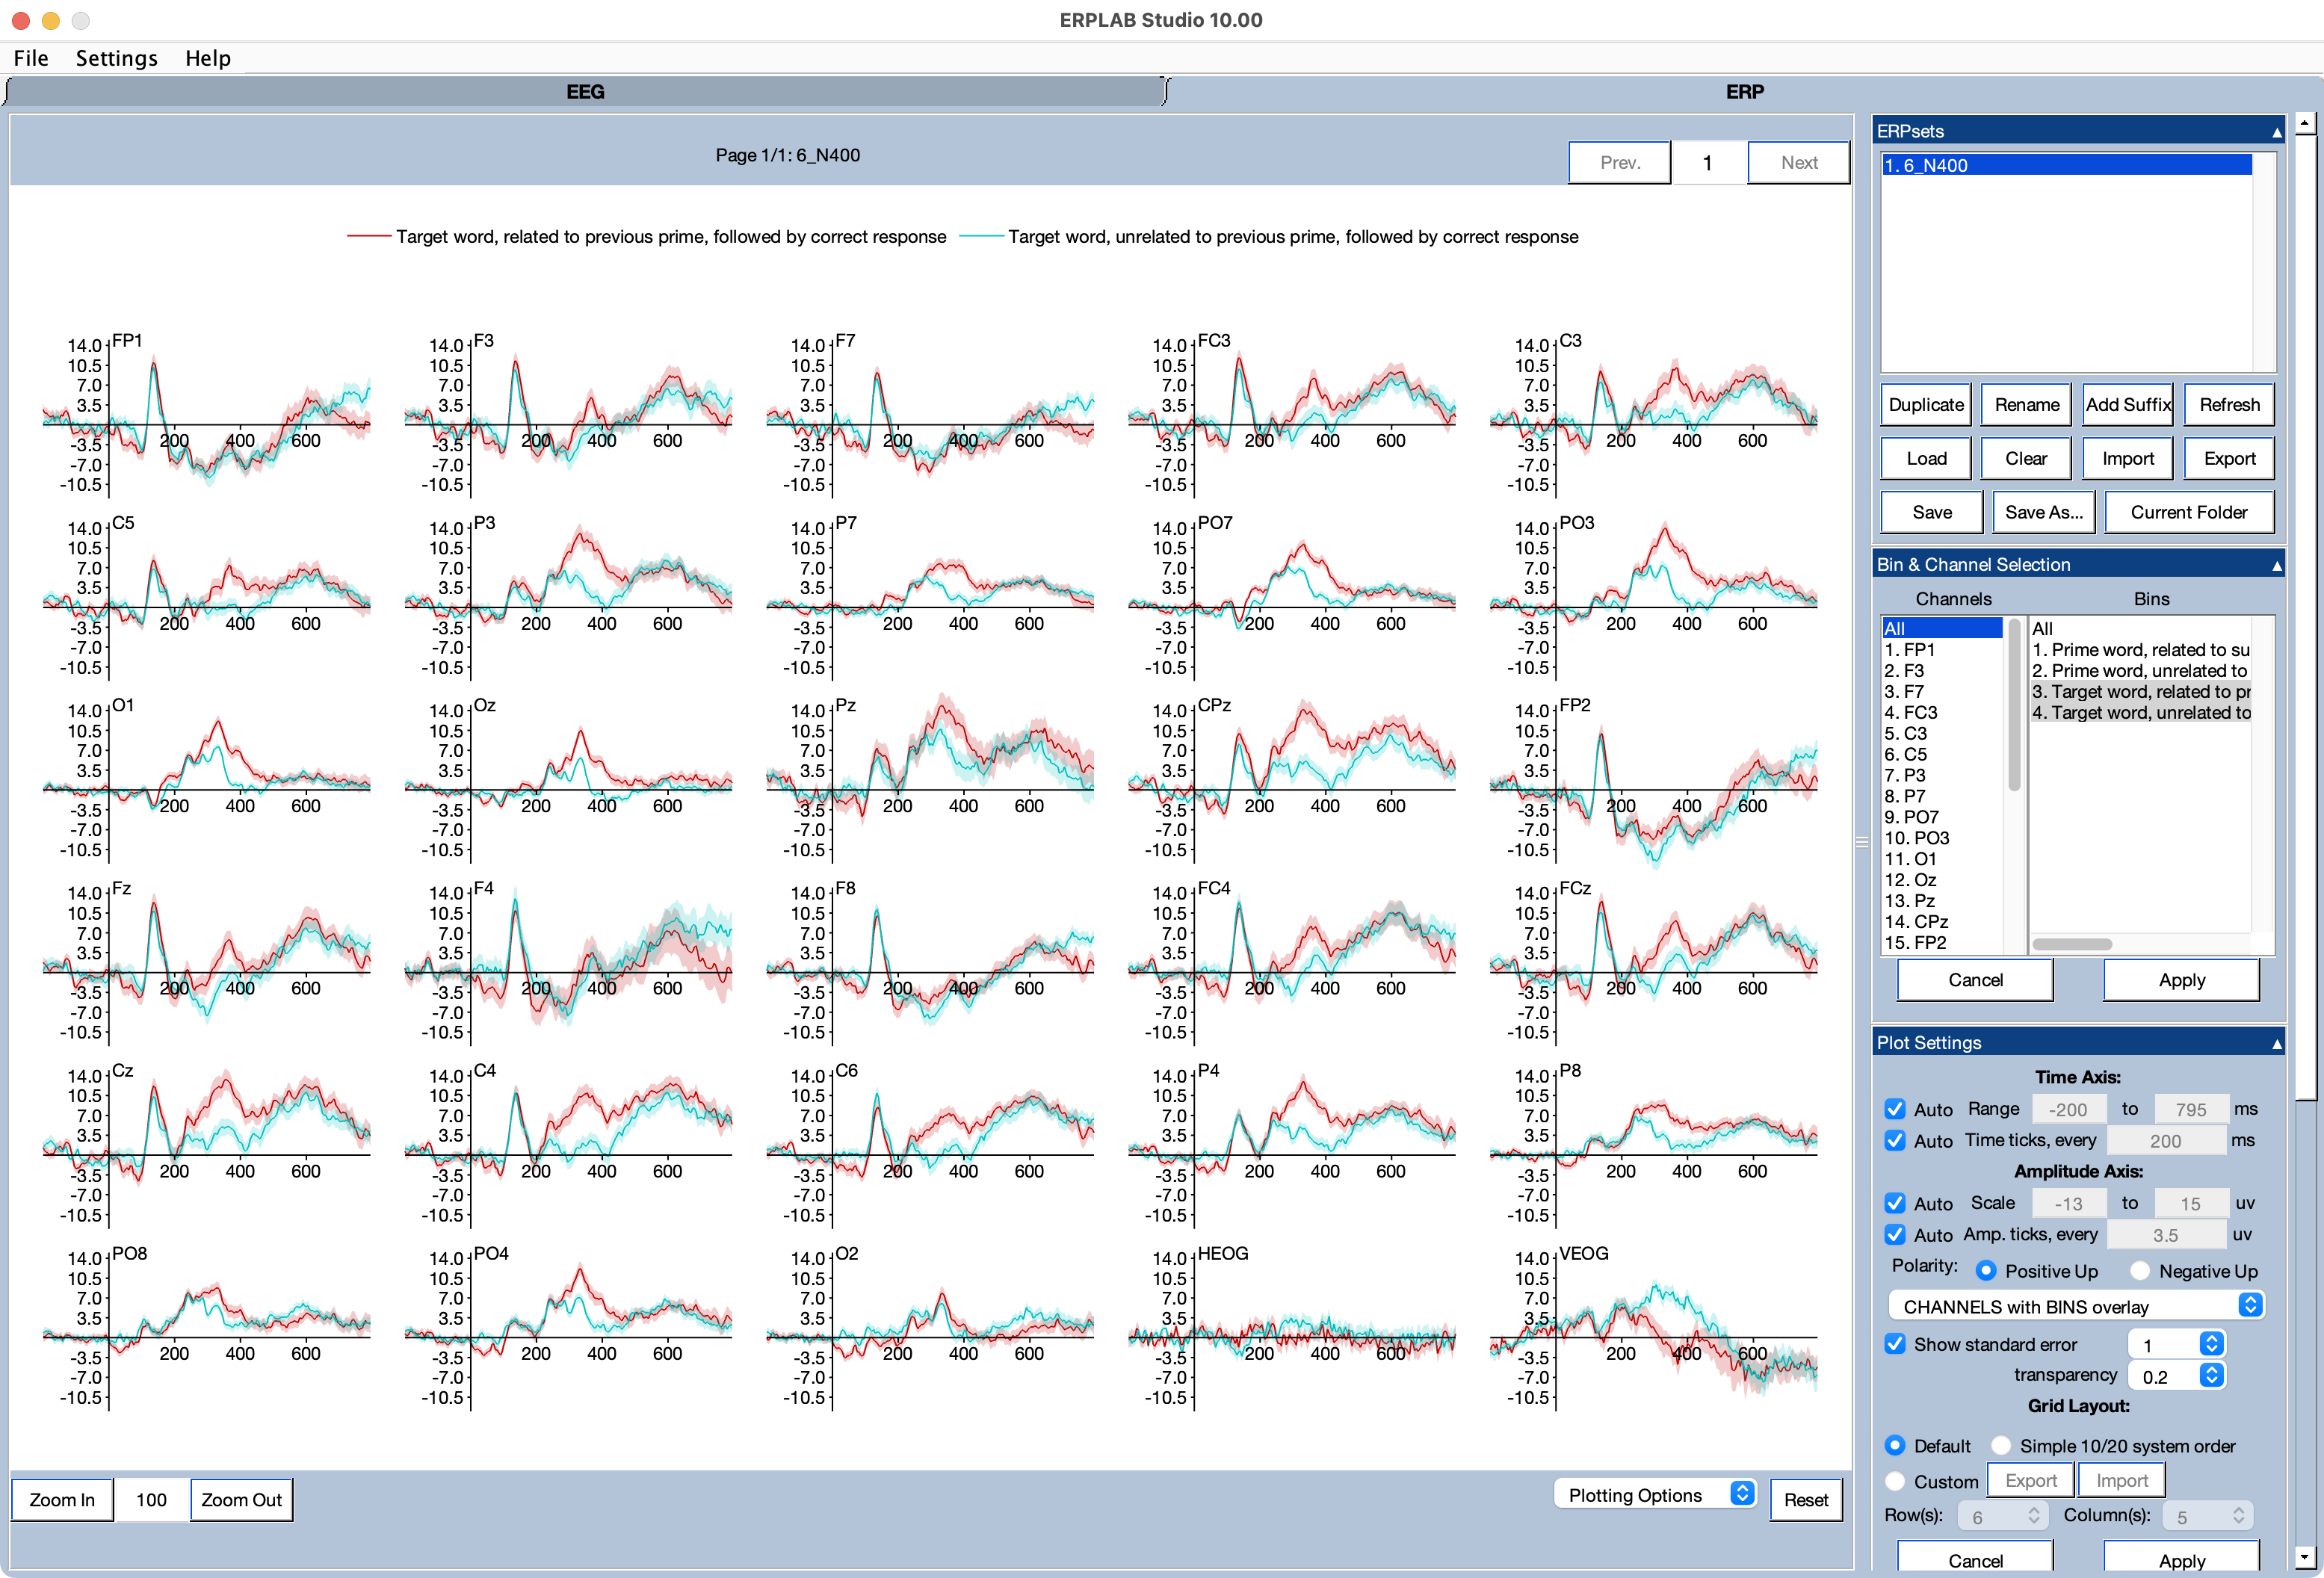
Note that the standard error is quite a bit larger for the F4 channel than for the other channels. You may recall from the averaging step that this channel had a higher value than other channels for the aSME measure of data quality. You can see the aSME values again by going to the View Data Quality Metrics panel (in the ERP tab) and clicking the Show in a table button. You will then get a window showing the aSME values for each combination of channel and time period. If you click the Color heatmap button in the window, it should like the screenshot below. You can see that the F4 channel is highlighted, especially at later time points in the window. You can now close this window by clicking Done.

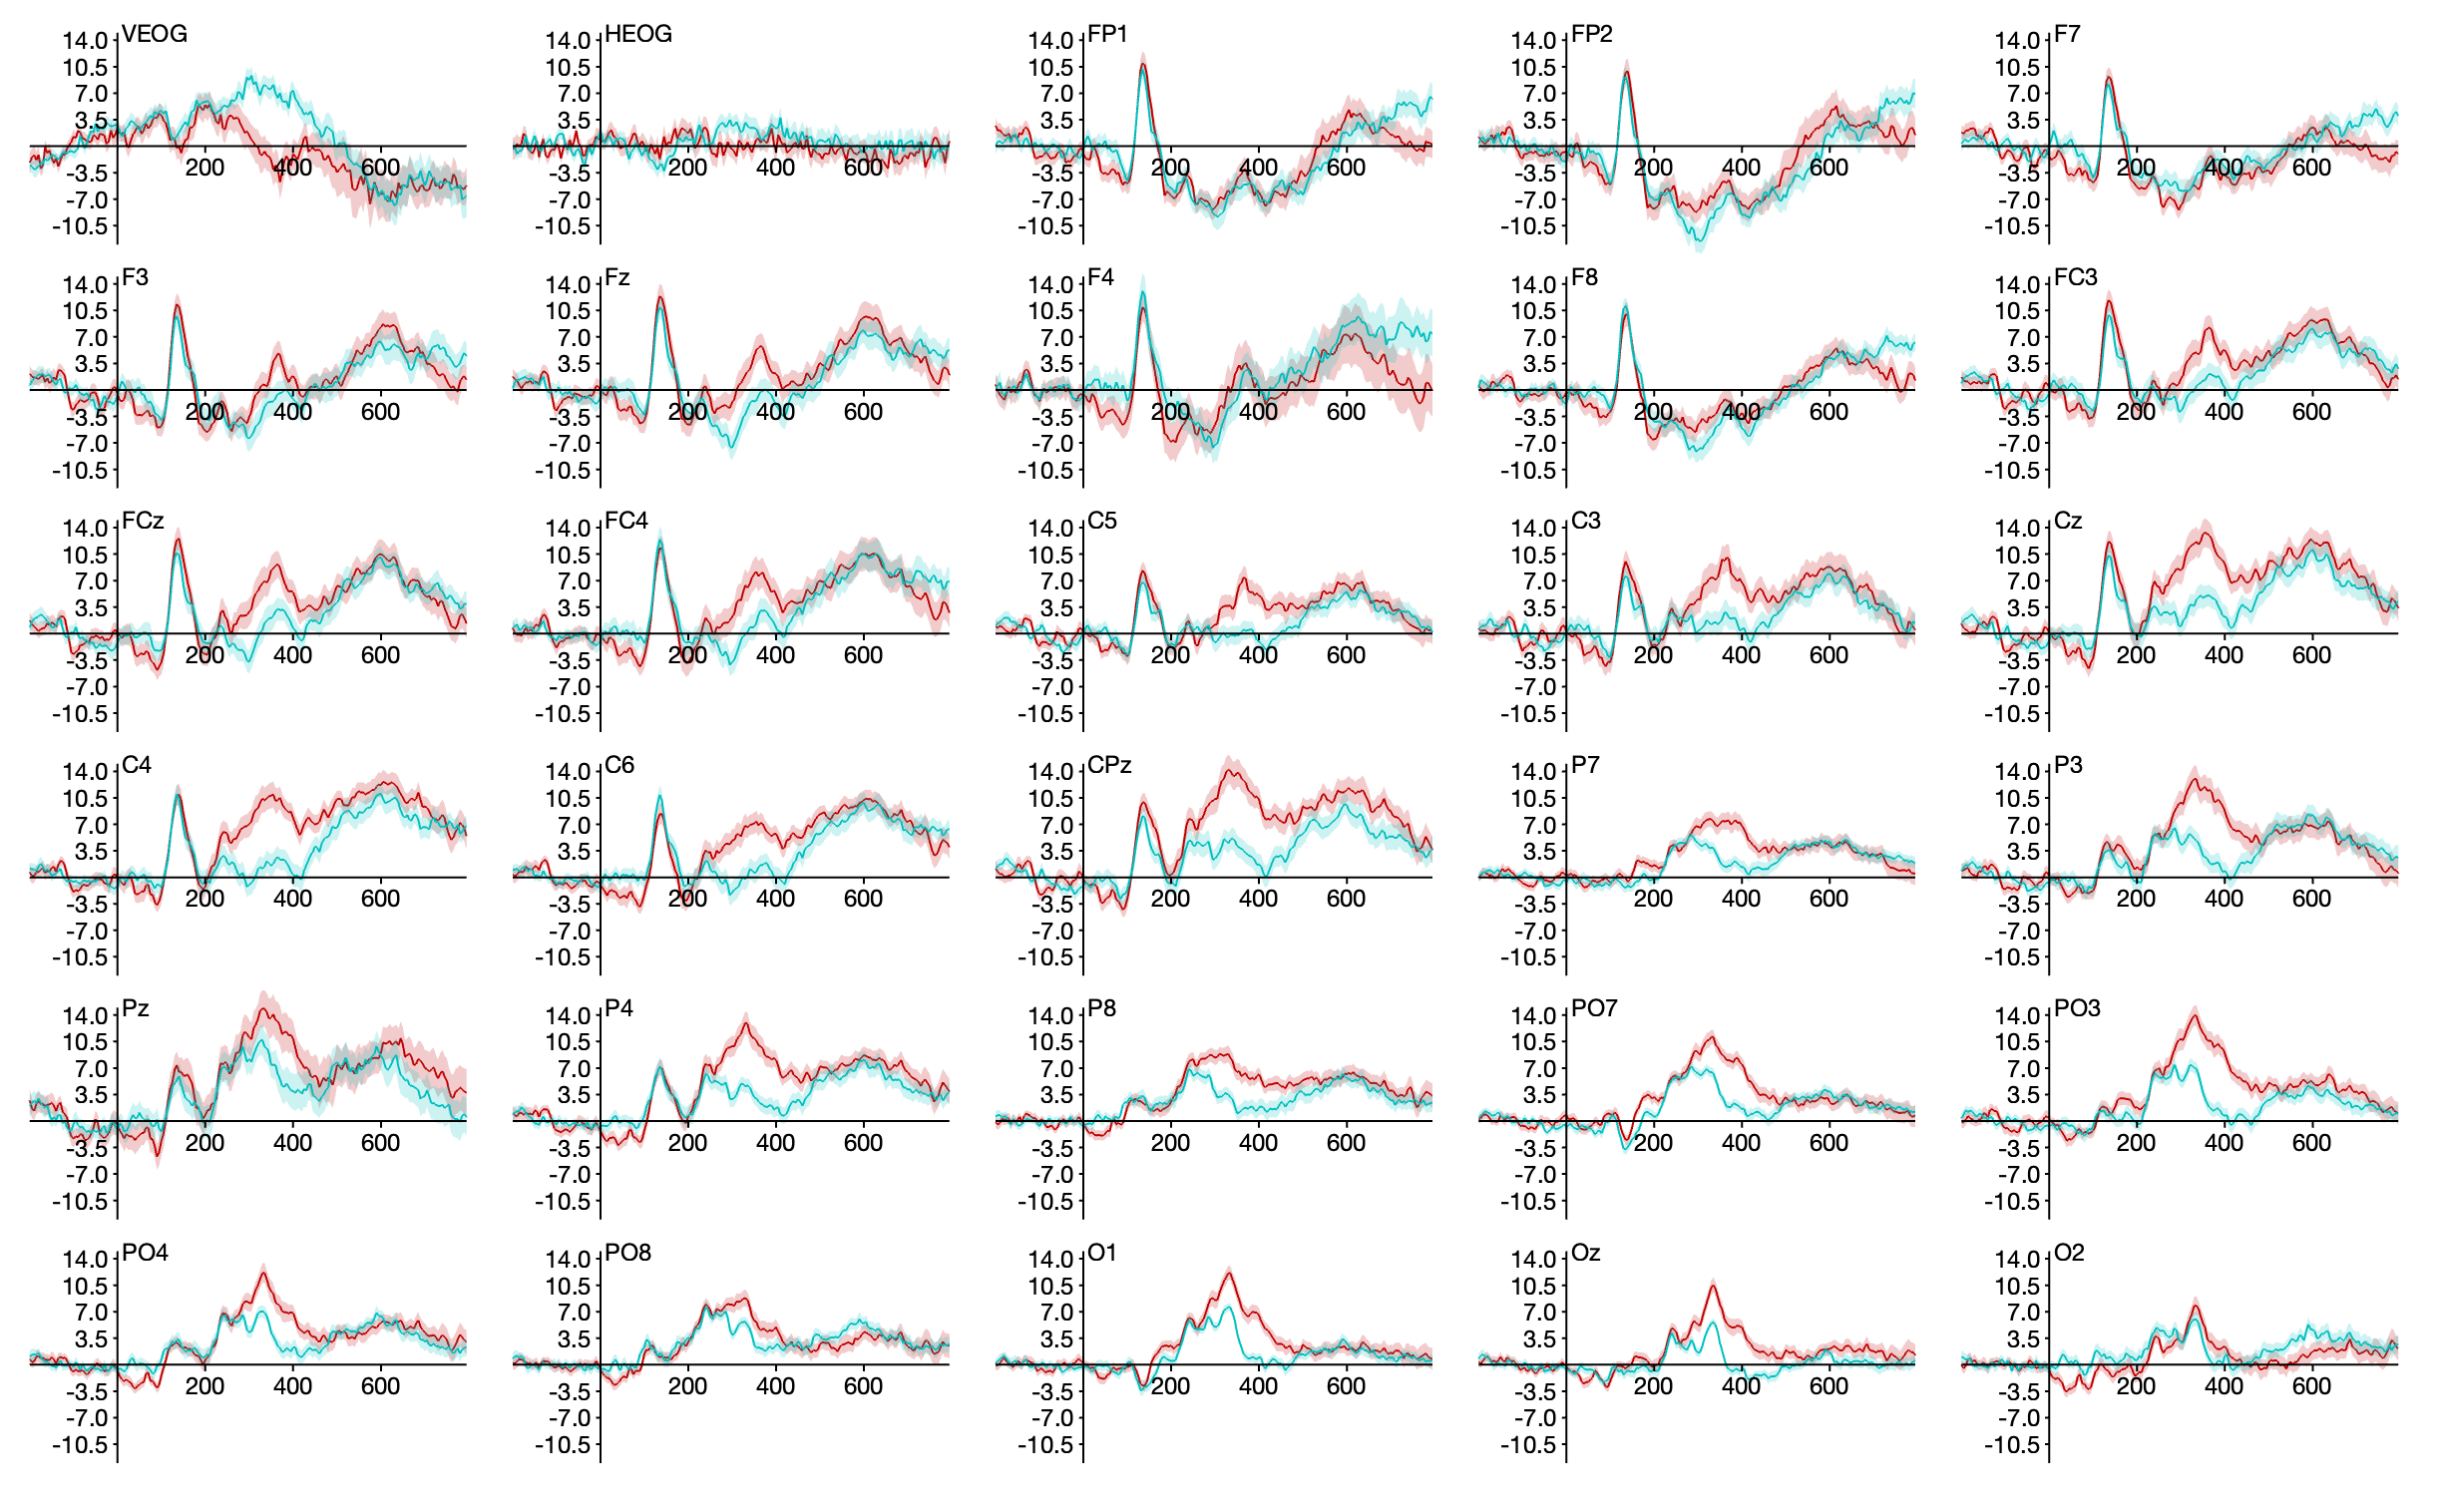
Now let’s take a closer look at some options for plotting the ERP waveforms. If you look at the plotting region in the ERP panel, you’ll see that the ordering of channels is not very intuitive. This is often the case, because the initial ordering was based on what was useful for applying the electrodes, with all of the left hemisphere sites first. Try clicking the Simplified 10/20 system order in the Plot Settings panel and then clicking Apply. This will change the ordering of channels in the plot (but not in the ERPset itself), as shown in the screenshot below. Now the channels go in a left-to-right and then front-to-back order.
That was an improvement, but sometimes you want the plot laid out in a way that better approximates the positions of the electrodes on the head. To achieve this, go to the Plot Settings panel, click Custom under Grid Layout, click the Import button, and load the file named GridLocations_Custom.tsv. Then click Apply and you will see a plot like the one shown in the screenshot below.
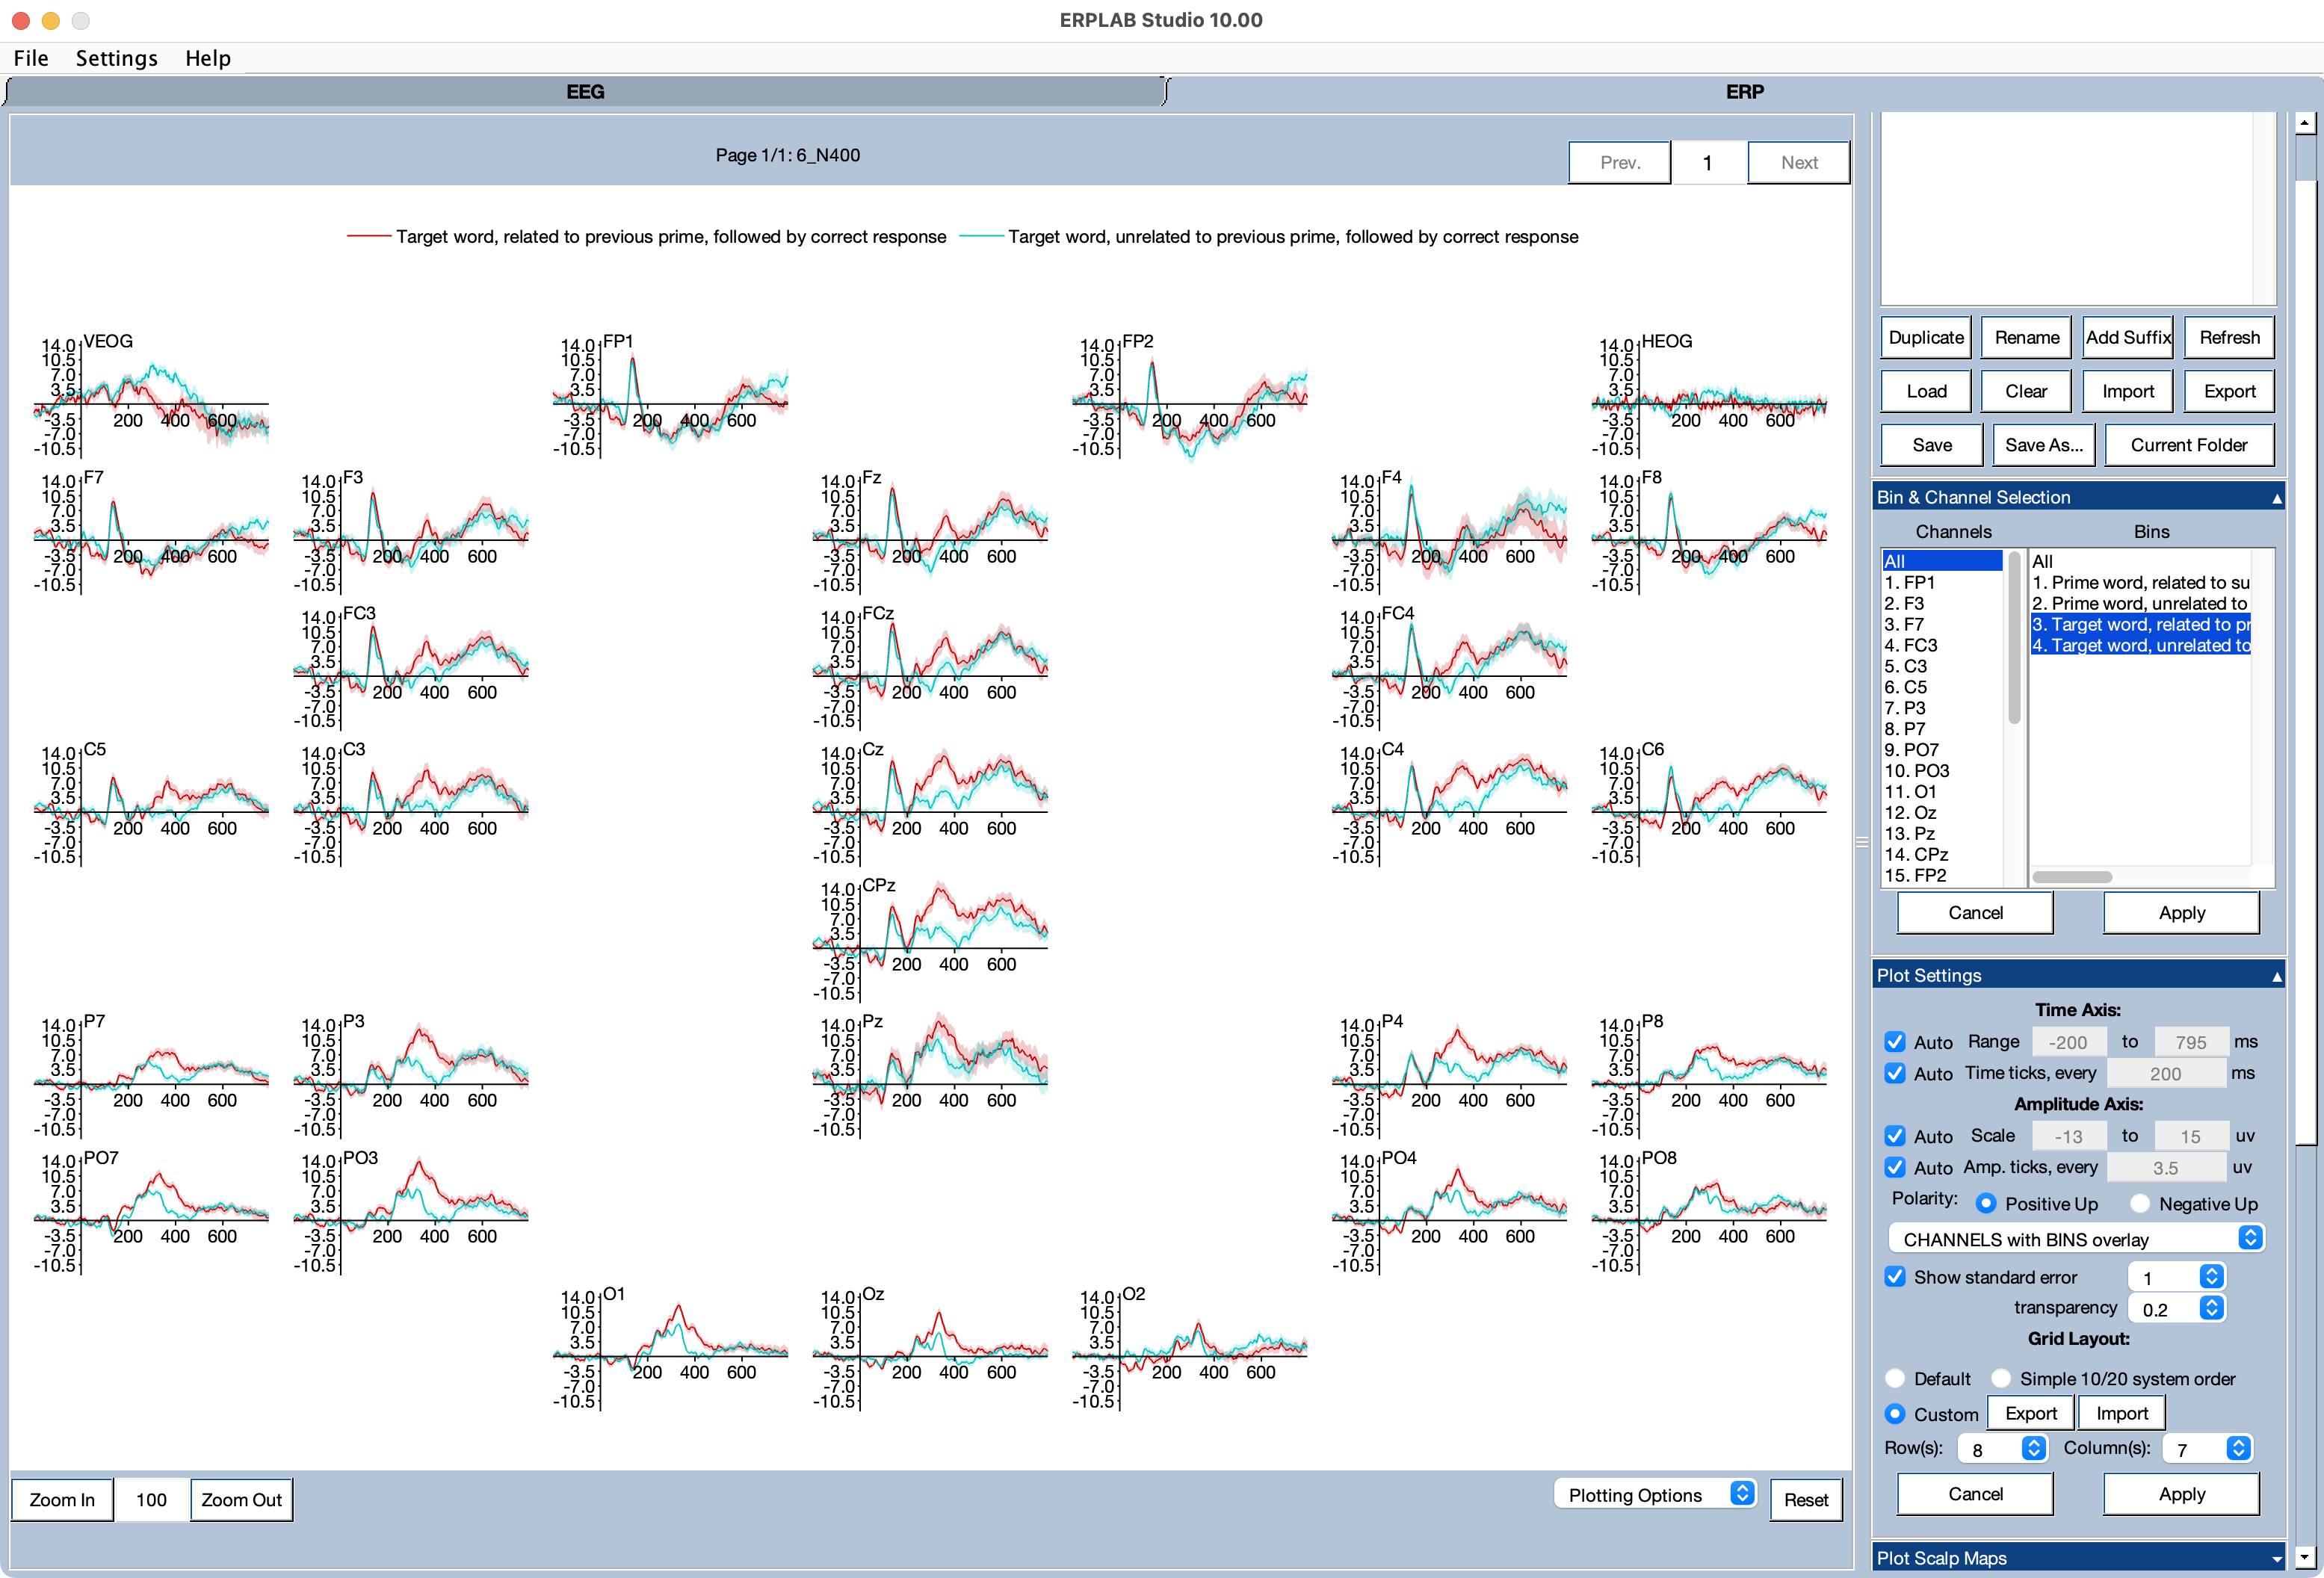
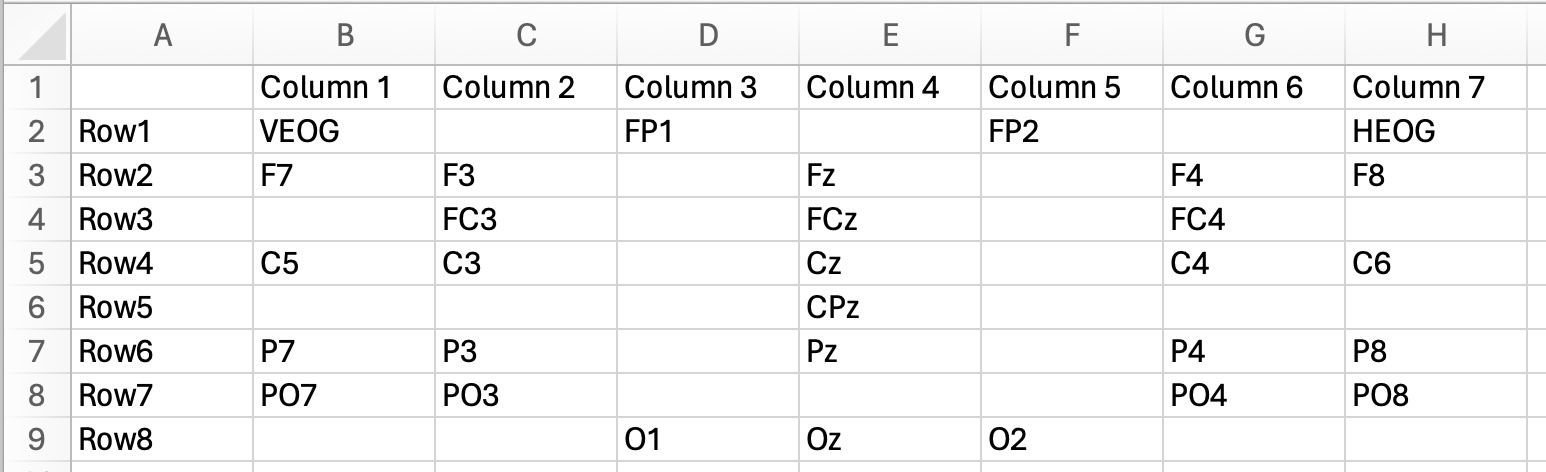
This is a much better approximation of the spatial layout of the electrodes. The layout is specified in the GridLocations_Custom.tsv file. This is just a tab-delimited text file that you can edit in any spreadsheet program. If you open the GridLocations_Custom.tsv file in a spreadsheet program like Excel, you will see that it specifies the layout in a very simple grid. As shown in the screenshot below, you just label the rows and columns and put the electrode names in the grid locations where you want them to appear.
The easiest way to create a custom set of grid locations with your own data is to use the Export button to create a locations file, edit that file in a spreadsheet program, and then use the Import button to import it.
Note that this file must be in “tab-separated values” format. We like to use a .tsv filename extension for this file, but Excel does not like to save files with that extension, so you can just use a .txt filename extension. However, make sure that the channel labels are separated by tabs.
| Previous Page | Next Page | 🏠 |
|---|---|---|
|
ERP Information |
Home |