3D VISUALIZATION MODEL - LeFreq/Singularity GitHub Wiki
Welcome to the cloud. These are the dew drops of your new OS*.
Finally, cyberspace`s dream come true: navigate the complexity and breadth of humanity's knowledge from the web with 3 dimensions (*3 spatial dimensions, 3 appearance dimensions), so that higher orders of data and knowledge can emerge and be managible. Data stewards will then arrange it with better and higher ontologies. If the universe keeps ordered in three dimensions, then you should be able to do it with your data. Why? Because that's all anyone can manage until Man evolves some superpower. And like how the universe uses time, there is 1 other dimension that is kept separate: color.
The above screen might be a view into your data that you otherwise organize into directory trees. Your data and file-objects exist in a non-dimensional space, but once you set a few keywords, they act as a lens and put a dimension of order onto your data, so it can be visualized. Also, activity happens through a feature called NetNews.
Of course, there is more than one view through and into data. So depending on the [GUI:frame context](frame context), the data can arrange itself for different views, using probably 16 parameters mapped into four dimensions, using something like meta-functions and tags to do this. For example, you might want to view author relationships vs. subject and high-level vs. low-level relationships.
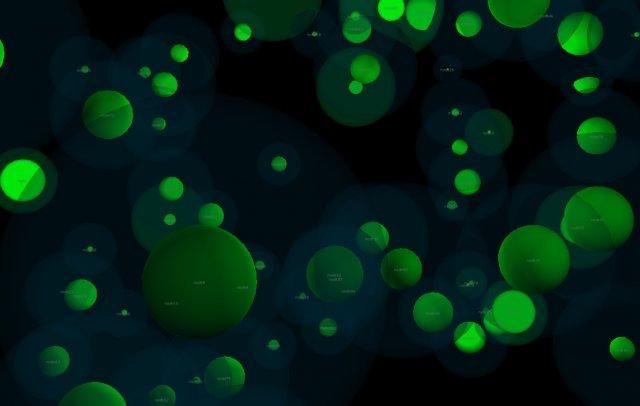
The visualization for a data ecosystem will be something like this: there are four [main views](coordinate space). In each view, each object is a sphere in the space, colored by some tagging scheme (in the object view: gui objects to write things to the screen might be a shade of green, database objects a shade of red, etc.). Objects are composed of other objects and this can be visualized with semi-transparent spheres.
One looks at the data ecosystem above like many interconnected and multi-contained objects, and can then enter an object. Traversing the boundary between the outside and the inside view, the viewer transforms their relationship to the object.
See the GlassBeadGame, also.
The above is true whether your data is the Internet or your OperatingSystem desktop. A 3-d data visualization model will obliterate the desktop metaphor of interacting with your data and make a KillerUserInterface. A UnifiedDataModel will reinvent the OperatingSystem and unite the Internet. Forget RDF and XML, a 3-d visualization layer will let your visual cortex do the work of making relationships between data.
Notes on the visualization:
-
Each '''sphere''' is a '''user''' so they can be easy demarcated from [objects].
-
A '''rectilinear''' shape represents data without an object framework holding it.
-
A '''cubic''' shape represents an all objects in the data ecosystem. These may connect to user
-
The '''atmosphere''' (in development) shows other objects that are affiliated with the object (its "provenance" hovering around it). Just as objects contain other objects, one can click on the atmosphere and all associated objects light up, connected with a link-line. XXX. The atmosphere is shown for nodes which are protected and do not allow ingress. You must request entrance by MSG. These will show up and be visible in the atmosphere until read by node owner. The origin in the coordinate space is shown as a point on the atmosphere, so that one can see how many people are communicating with the node. (From the node perspective, this shows up in their Object view with little star lights (or big if there are many messages queued up) shown where users are trying to communicate to it. They can click on the point and be transported to the node in the user view of coordinate space.)
-
Each sphere may contain other '''sub-objects''' or spheres (its "organs" gained via inheritance) (in development also -- it may or may not be part of the final model). Entering a sphere runs the object.
-
'''Color''' would represent the highest level categorizations in the ontology: law, physics, philosophy on the app side to networking, graphics, math, UI on the systemadmin side. Four axiis for color tags, plus an ambient color:
-
- Red - Green; serve/cultivate <-spirit and community -> appreciate (NOTE: reversed for Jupiter system such that negative side is appreciation); cultural-spirtual axis
-
- Yellow - Purple; learn <- knowledge and theory -> teach; education axis
-
- Blue - Orange; buy/trade, acquire <-business and application -> make; business sector
-
- ambient color: Black - White; remember <- reason and order > new growth/reazch; civic sector
-
Every tag/color (unique tags have a unique color)
-
When user-nodes send a MSG, the node flashes. When an object-node ''receives'' a MSG, it flashes also.
-
the background of the nodes is called the Soup. It's color (ambient) is painted in relation to how many unclaimed messages are in the system, which others can clean up and flush if they wish.
-
The more pastel the color is, the more generalistic and uncategorized the composition of the node. All knowledge in perfect order would create a pure white node, for example. But this should not be the purpose of most books or objects. So a good node should be well-defined color, not a mash of colors, staying in the neutral for most every dimension except one or two, where at least one of those shoudl maximize separation.
*Placement is determined by edge relationships between spheres, acting as vertices in the graph. *sphere shouldn't be labeled, per se -- let the user remember how to find things in the search space by it's visual signature relative to other objects. Users can "mark" objects they like with their own color -- that's better than any label getting in the way.
If a programmer combines (composits) two objects together, creating a new, higher-level object, s/he has conjoined two different parts of the ecosystem and the data visualization holding the two, formerly disparate objects, move together. Such a use represents new epistemological order. This rule creates galaxies of linked schools of thought.
- Spheres which touch are connected by name-semantics. Spheres which have an inner join share some common object?
- The 3 + 1 dimensions can be named, allowing a possibility of non-arbitrary placement upon the axis, with 0 representing "don't care": knowledge (tag?), business, people, scope of focus.
(*) Visualization taken from Pangaia project by this User and can be run by the demo.py program.