Testing & Calibration - tangentaudio/opencv_tank_gauge GitHub Wiki
Focus the Camera
The Raspberry Pi Camera v2 is a fixed-focus camera, and it comes from the factory focused at infinity, which is no good for close-up objects like our gauge. The Pi camera can, however, be refocused with a little care and a pair of tweezers or other small tool.
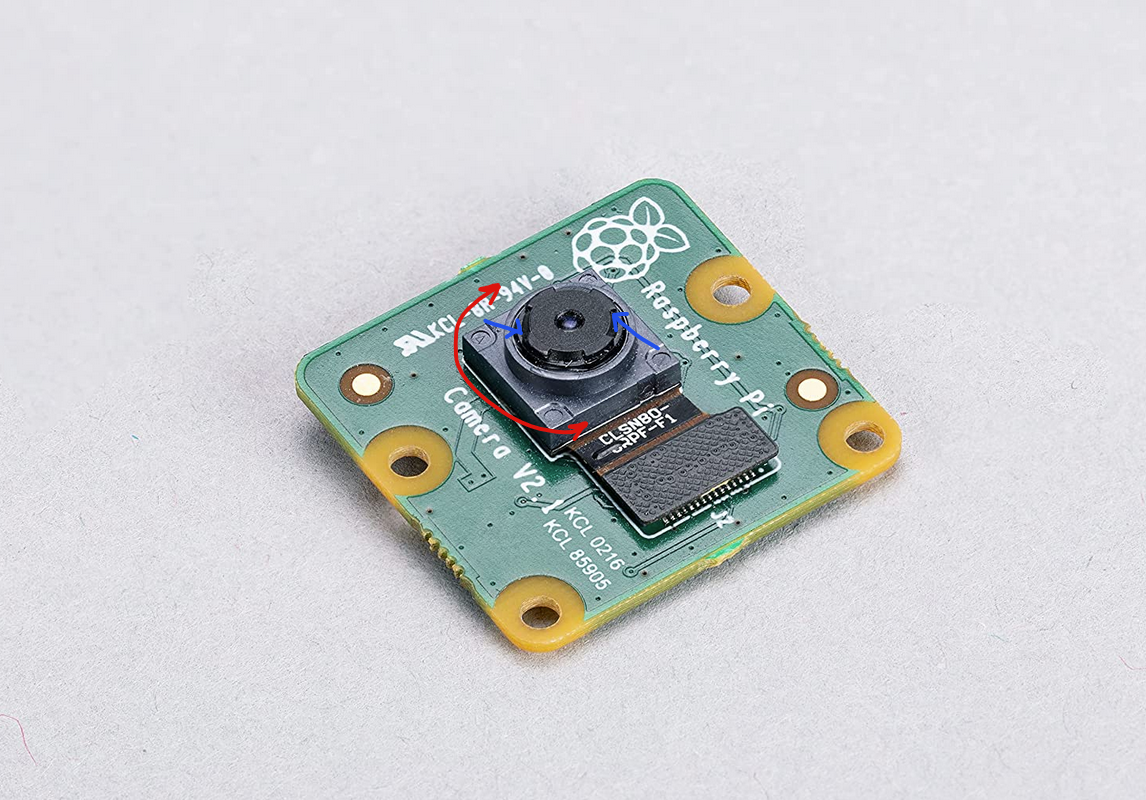
The inner element of the lens can be turned, which in turn moves the lens closer or further away from the sensor, changing the focus of the optical system. Most of the Pi cameras come set and lightly glued, so turning the lens initially will take a bit of force to break the glue bond.
It's easiest to work with the camera assembly slid to the top of the adjustment slot on the rear of the enclosure body. This way, the focus ring is easily accessible with tweezers.
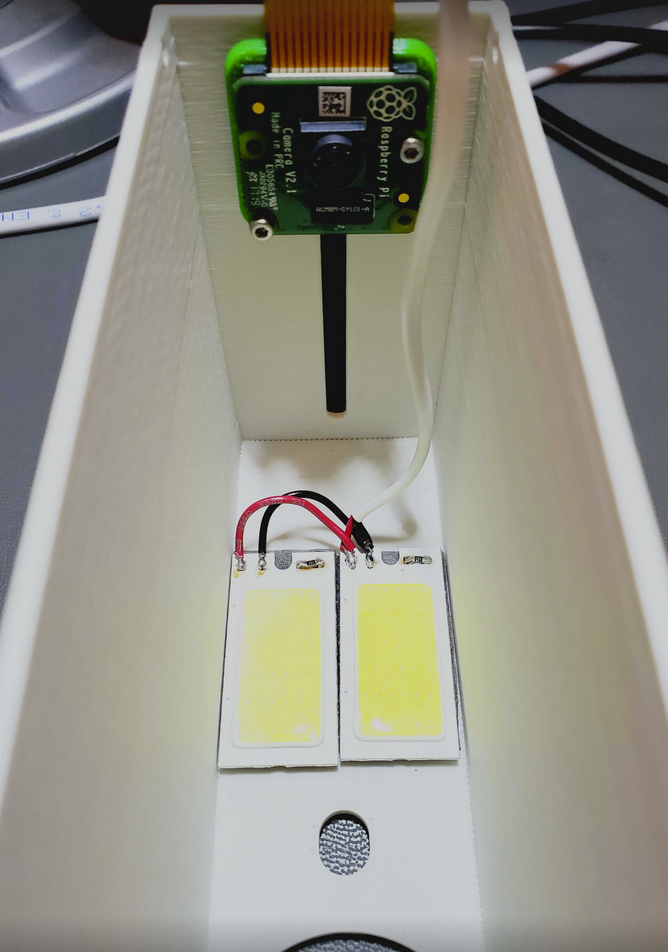
If you want to focus the camera on your bench instead of near your oil tank, you'll need an item to focus on that's similar size and shape to the gauge vial. I used a tube of lip balm. With the camera and electronics connected, you can run the system with the lid off so that the camera can be focused.
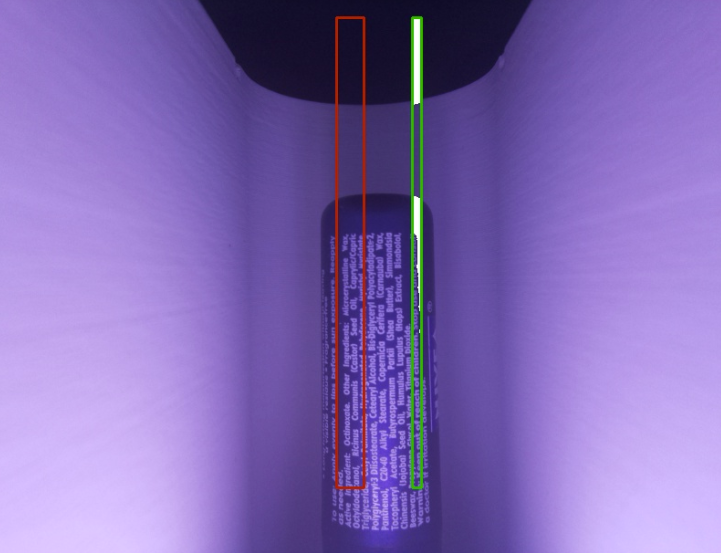
Assuming you have successfully completed the software installation process, you can pull up a preview image from the camera by opening http://gauge-reader.local:8080/ in your browser. You may need to use the IP instead of the local name. If everything is working right, you should get a camera image in your browser that updates about once per second. You will also see red and green boxes on the image, which you can ignore for now. Use the image to adjust the focus ring. Take your time and work slowly! The lens is delicate, and it takes fine movements to get the focus dialed just right.
Once you are satisfied that you have achieved clear focus on the bench, slide the camera down to approximately the 1/3 height position. You will set the final height once the unit is installed on your gauge.
Shut down the Pi by navigating to the URL http://gauge-reader.local:8080/api/shutdown, wait a moment, and then you are free move it to your oil tank location.
Set the Camera Height
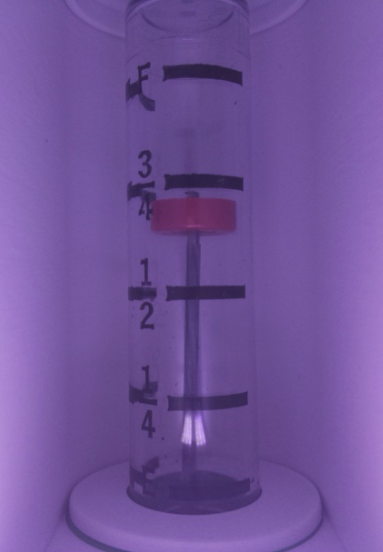
Boot the system back up and open the preview page again. Observe the vertical positioning of the image in the preview. Adjust the camera height so it looks similar to the photo below. Ideally, you want to see the entire gauge, and not much of the "floor" of the enclosure. Once it's set to the proper position, tighten the two camera slider screws to lock it in place.
Tuning
The final step is calibrating the image processing parameters so the algorithm can properly detect the legend lines and the indicator position. To get started, open a browser window to the tuning page at http://gauge-reader.local:8080/tune and you should be greeted with a page that looks similar to this:
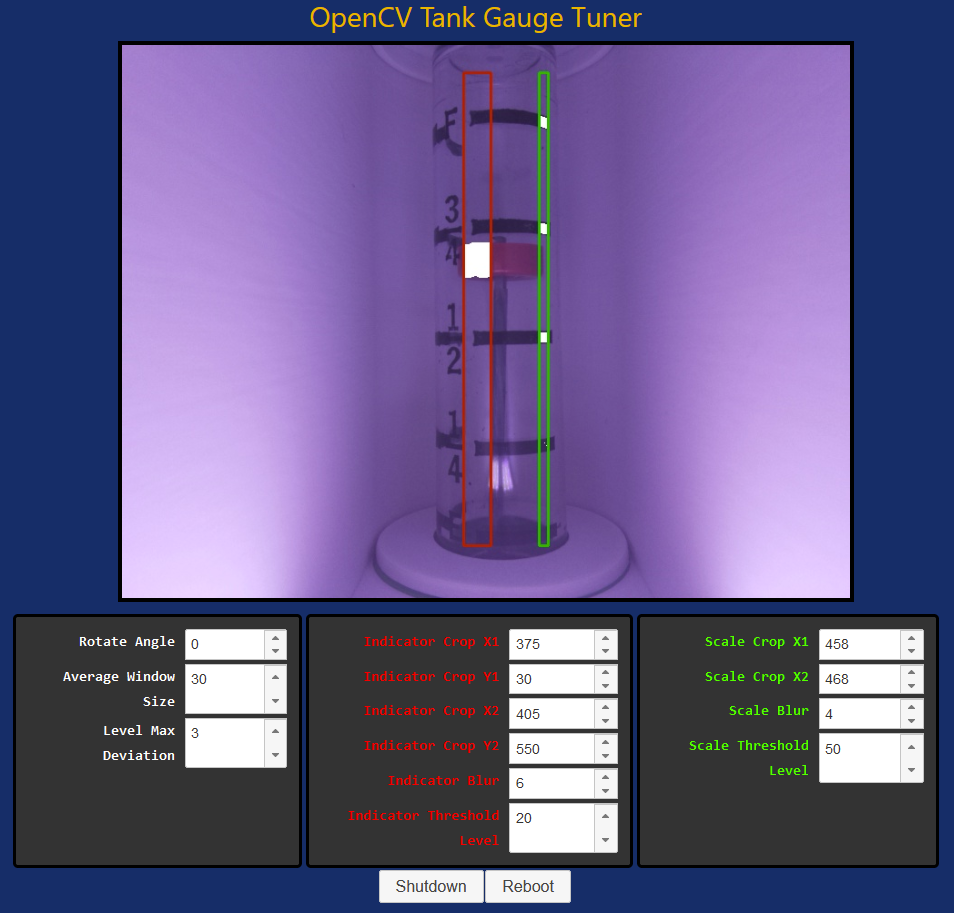
Tuning Parameters
There are about a dozen parameters that you can adjust to configure the computer vision processing. They are arranged in three groups under the preview image. From left to right, the groups are:
- Global Settings - White items
- Rotate Angle: allows minor corrections to the tilt of the gauge in the overall image by rotating the entire image before processing.
- Average Window Size: controls how many level readings are averaged together to make a new value report.
- Level Max Deviation: controls how far a single reading may deviate from the others in an averaging window before it is discarded.
- Indicator Processing - Red items and boxes
- Indicator Crop X1, Y1: together these control the upper left corner of the red box, which bounds where the algorithm will try to find the red indicator.
- Indicator Crop X2, Y2: together these control the lower right corner of the red box.
- Indicator Blur: controls how much blur factor to apply to the masked image, which can aid contour detection for the indicator.
- Indicator Threshold Level: sets a threshold that is used to detect the presence of the indicator, shown in white inside the red box.
- Scale Processing - Green items and boxes
- Scale Crop X1, X2: together these control the left and right sides of the green box, which bounds where the algorithm will try to find the scale (tick marks). The Y values for these bounds are taken from the Indicator Crop Y values above.
- Scale Blur: controls the blur factor for the masked image during scale detection.
- Scale Threshold Level: sets a threshold used to detect the presence of the indicator, shown in white inside the green box.
Tuning Process
- Start by setting the crop locations for the indicator. It's best if your indicator box includes some of the clear part of the window next to the gauge marking text, so the gauge will never be entirely hidden by the scale markings.
- Set the crop location for the scale. It's preferable for it to be a narrow sliver of the overall gauge width. I use the far right side of the gauge window.
- Tweak the rotation angle if necessary. With the bounding boxes over the gauge, it should be more obvious if the camera view is slightly tilted. If you make drastic angle adjustments, you might need to go back to steps 1 and 2.
- Set the threshold for the indicator. Low numbers make it more sensitive. If a relatively stable white overlay is shown directly over the physical indicator within the red bounding box, the calibration is correct.
- Set the threshold for the scale. Low numbers make it less sensitive (opposite to above). You want the five indicator lines to be cleanly detected and shown in white within the green bounding box.
- Tweak the blur factors for both the indicator and the scale. Experiment with these values to see if they help produce more solid-looking white detection areas within the red and green bounding boxes.
- Generally you can leave the average window size and the max deviation values alone.
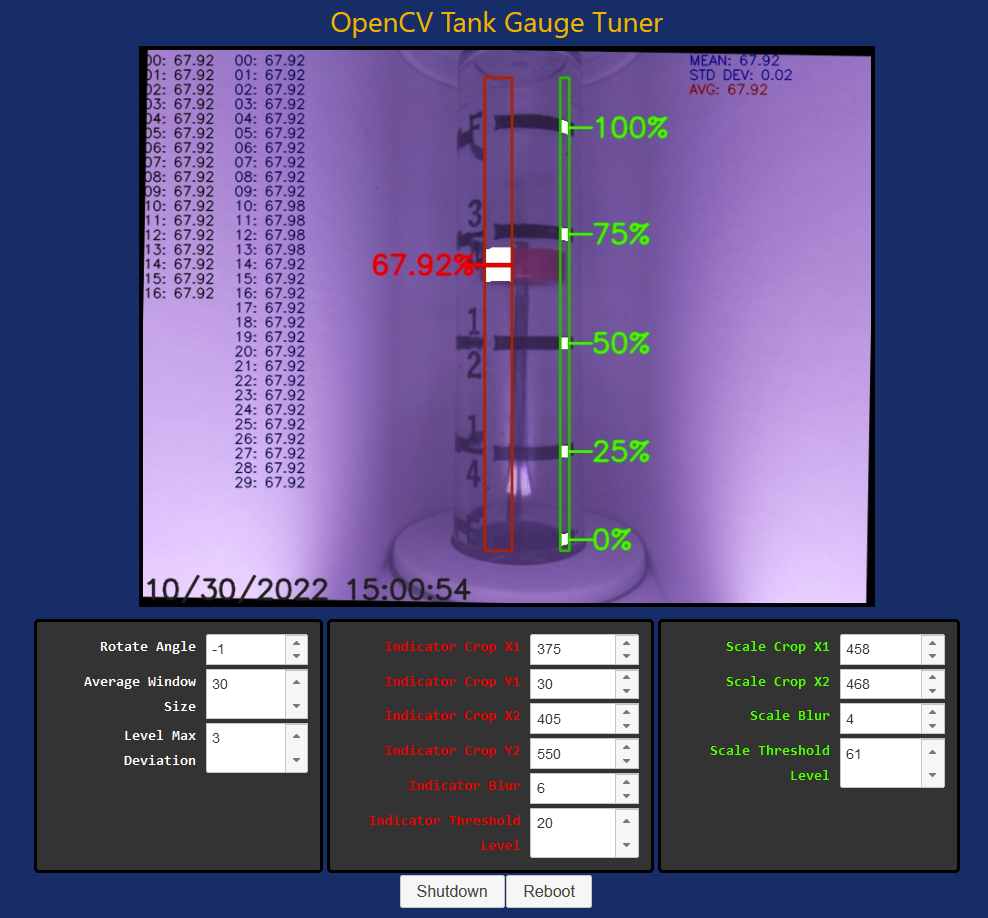
If the algorithm is detecting the required contours properly, the preview display should show five green indicators for 0% through 100%, as well as a red indicator with a calculated percentage for the indicator position. These items will not display if the necessary contours are not detected by the algorithm.
The preview also shows some other helpful information, as long as all contours are detected. The column of numbers of the left fills in a new reading every frame, and represents the raw values in the averaging window. The column directly to the right represents the last averaging window with the outliers removed, so it may be shorter than the configured averaging window. The numbers on the right of the image represent the last mean, standard deviation, and averaged value (with outliers removed).
This informational display can be used to see how stable your readings are, and give you some indication of whether you need to do more tuning or make lighting adjustments. Below shows my system, tuned to produce stable level readings.
Next Steps
Now you might want to move on to setting up Home Assistant for cool dashboards and tank level notifications. You might also want to read about the RGB LED Display, so you understand what the various displays mean.