Worked Examples - overturetool/vdm-vscode GitHub Wiki
This page walks through a series of steps which are typical of the stages that you might go through when creating, debugging and testing a VDM project. The examples are based around the "AlarmSL" project, which is written in VDM-SL, though most of the material applies equally well to VDM++ and VDM-RT.
Open Visual Studio Code, and if you have previously loaded any projects or workspaces, close these via the File menu (Close Folder or Close Workspace) so that there are no projects shown in the Explorer view.
Then choose File > Save Workspace As... to create a new empty workspace in a file called alarms.code-workspace in a new folder (of any name).
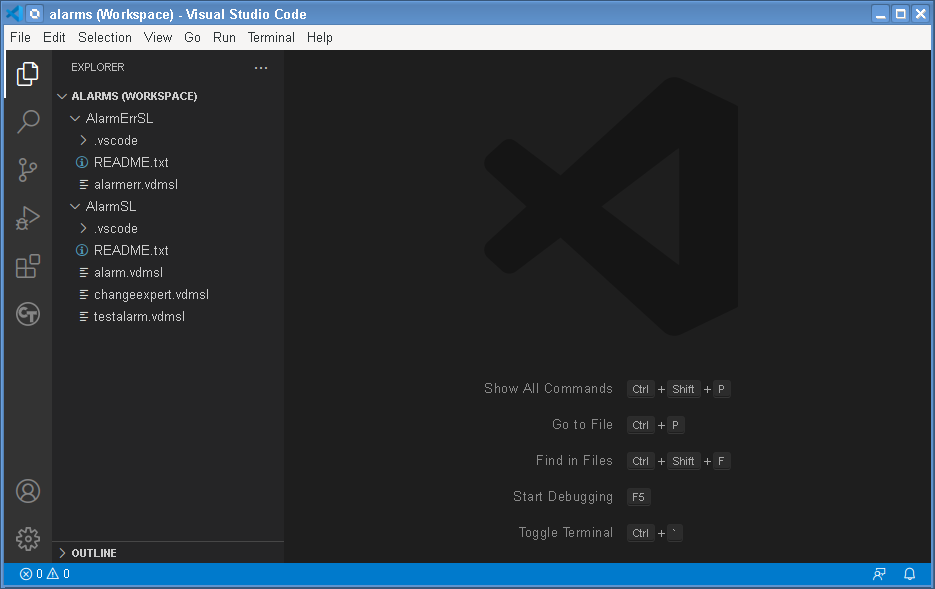
Follow the instructions to Import Examples. Select the VDM-SL dialect, and import "AlarmSL" and "AlarmErrSL". When asked where to import them, select the same folder as the alarms.code-workspace file. You should end up with a screen like this:
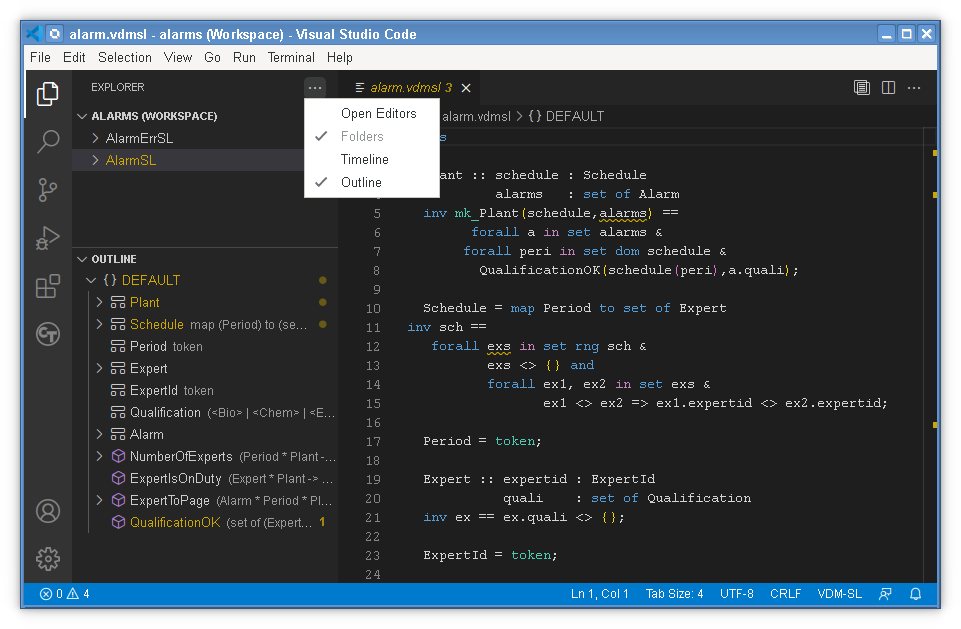
Open the AlarmSL project and click on the alarm.vdmsl file, to open it in an Editor window. You should notice an Outline view in the Explorer panel (which is called the Primary Sidebar). If not, you can right-click the ... on the Explorer title and tick the Outline menu entry. The outline should look like this:
In general, the Outline view lists the modules or classes in the open file (here DEFAULT because this is a flat VDM-SL file), and then within those it lists the definitions, each of which can have further detail (for example, fields of records or invariants, pre/postconditions etc). Clicking on an Outline entry navigate to that position in the Editor; double-clicking also focusses the editor window.
You can change the ordering of the Outline view using its ... menu, though the most intuitive is probably Position (which orders entries by their position in the file). You may also want to enable Follow Cursor, which causes the highlight/expansion of the Outline to follow your current position in the Editor.
You will notice that some of the definition entries in the AlarmSL example are yellow. This is because those definitions contain type checker warnings. Similarly, definitions that contain type checking errors are highlighted in red, and you can see this if you open a file within the AlarmErrSL project (which contains three deliberate errors). A number on the right of the Outline indicates the number of errors.
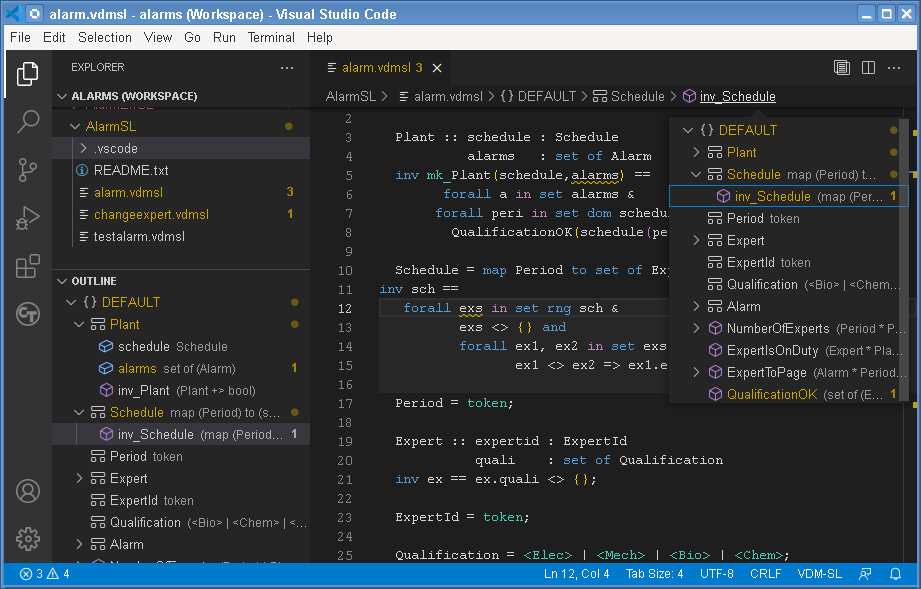
You should also notice a line along the top of the Editor window that shows something like AlarmSL > alarm.vdmsl > DEFAULT > ExpertToPage. This is called the "Breadcrumbs" line and indicates the current position of the cursor in terms of the project, file, module and definition. If you don't see the Breadcrumbs line, you can enable it via the View menu. Like the Outline, the Breadcrumbs changes as you navigate around files. You can also click on elements of the Breadcrumbs to jump to other places, including other projects and files.
The two projects that we have imported contain (between them) four warnings and three errors. These are displayed inline in the Editor view, in yellow and red respectively, and if you hover the cursor over them you can see the detail of the error message(s). But it is also convenient to have all errors listed in a separate view, so that you can go through them systematically and fix or review them.
This is what the Problems view is for. If you cannot see the Problems view, type CTRL+SHIFT+M or use the View menu.
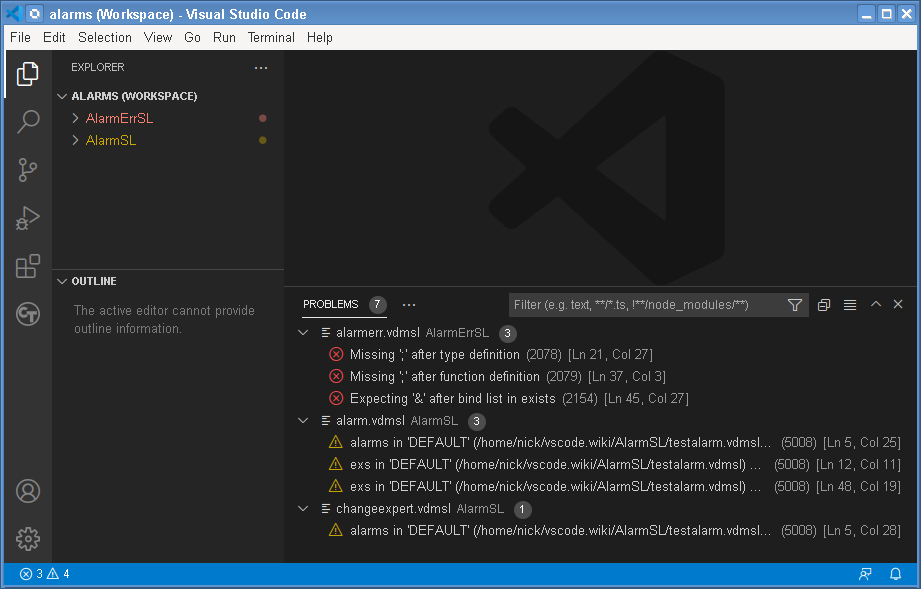
Notice that there are no files open, but problems are still shown from both AlarmSL and AlarmErrSL. Clicking on each problem navigates the Editor to the file and line concerned, and the Explorer view, Outline view and Breadcrumbs will follow.
The Problems view can be filtered, by filename pattern or by text. You can also filter such that the Problems view only contains problems that are within the current Editor file, or just the errors or just warnings (click on the "funnel" icon of the filter to get a menu). You can also display Problems as a simple table rather than a structured tree (an icon on the Problems view title bar).
Projects are simply folders in Visual Studio Code, so to create a new project, you have to create a new folder and then add this folder to the current workspace - these two steps can be done in one, by selecting File > Add Folder to Workspace... and then creating a new folder in the operating system dialog where you select a folder to add.
Once an empty folder is added to the workspace, new files can be created within it using the New File icon on the project title within the Explorer view. The name of the first file that you create effectively defines the VDM dialect of the project. So for example, we can create a file called test.vdmsl with the following source:
operations
  Try: nat ==> nat
  Try(n) ==
    ( IO`println(n);
      return n + 1 );
This also requires the IO library to be added to the project, which can be done via the VDM > Add VDM Library right-click context menu. Select the "IO" library, which adds a lib/IO.vdmsl file, and then the project will type check cleanly.
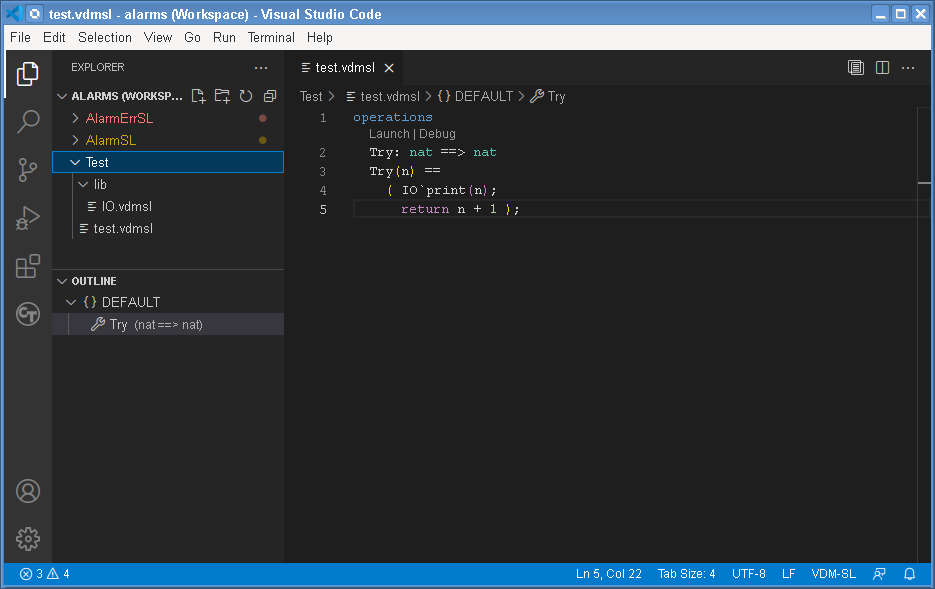
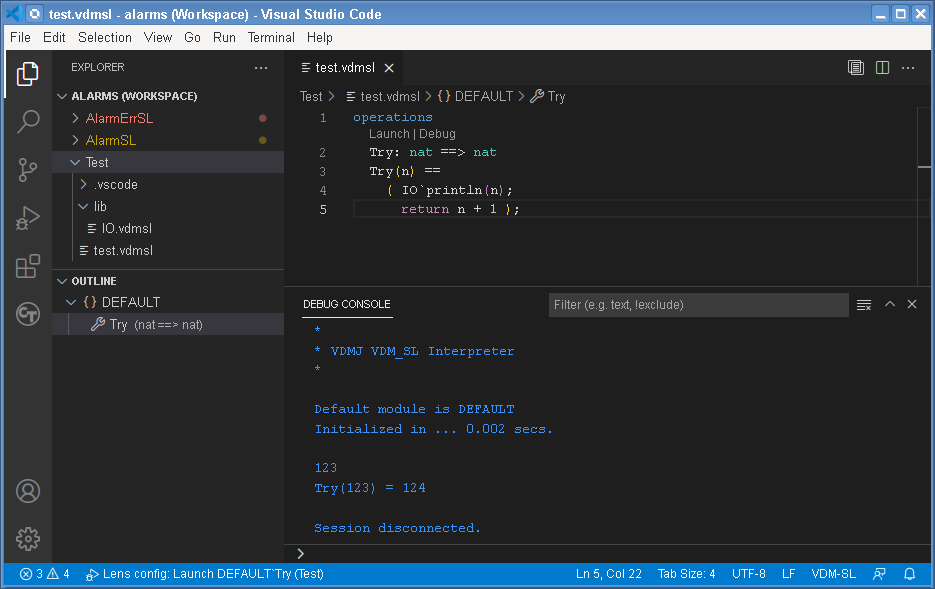
Clicking the Launch code lens, above the definition, will create and execute a launch configuration to test the operation:
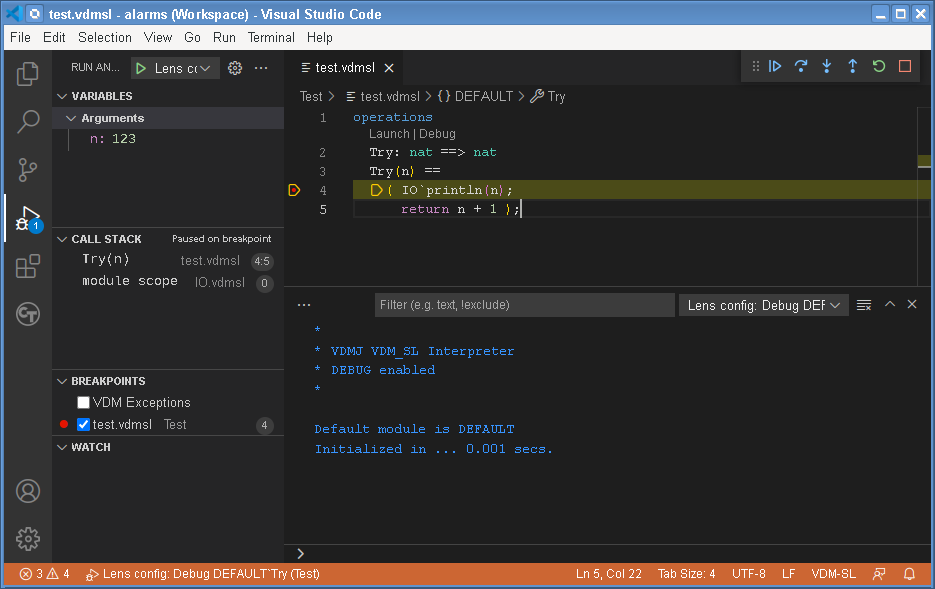
Or a breakpoint can be added, say on line 4, which will stop the execution if launched via the Debug code lens:
The full power of debugging is discussed in more detail in the next section.
To evaluate an expression within a VDM model, we have to create a "launch configuration" that tells the Language Server what we want to evaluate. The same configuration can also indicate whether we want to debug the evaluation - that is, we may want to stop a breakpoints and step through the evaluation to see what is happening.
Launch configurations are stored in a file called .vscode/launch.json within each project folder. They can be created by hand, or via the Open 'launch.json' icon at the top of the Run and Debug panel. But the most convenient way to create them is via the code lenses (discussed below).
It is also possible to create a launch configuration without an particular command to evaluate. This will open an interactive session, where you can ask for a series of evaluations to be made. This is discussed in more detail here.
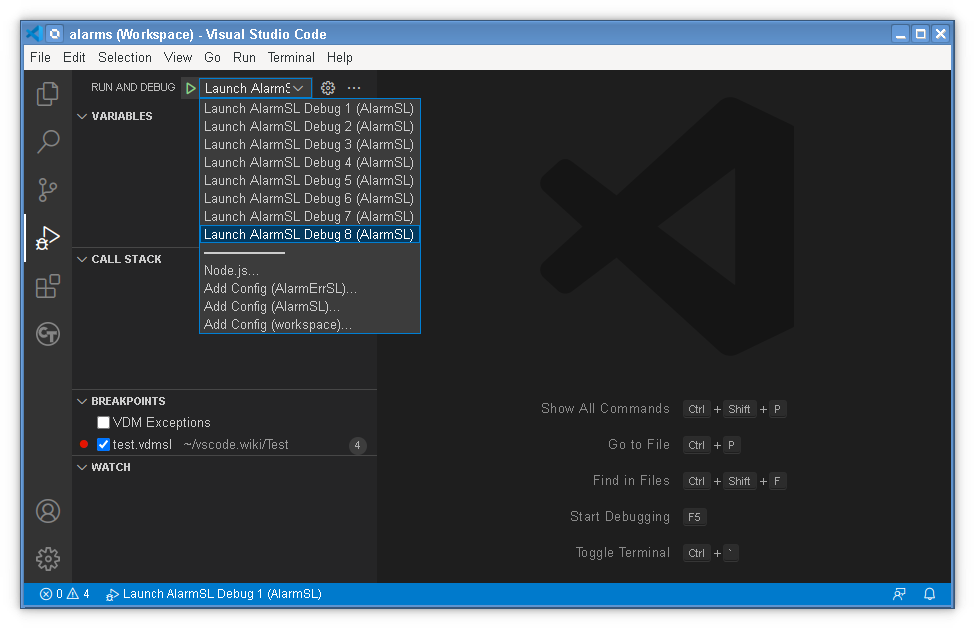
The imported AlarmSL project includes a launch.json file that already contains eight launch configurations. These can be seen in the drop-down menu at the top of the Run and Debug panel:
Once a launch configuration is selected on the menu, it can be executed by clicking the green Start Debugging (F5) arrow icon on the menu, or you can just press F5. This will open a "Debug Console" and perform the evaluation with debugging enabled. If you press CTRL+F5, it will start the same evaluation, but with debugging disabled (so it will not stop at breakpoints). The last launch configuration is remembered, so pressing F5 will start an execution at any point in the future (assuming an execution is not already in progress). The commands to run a launch configuration are also available on the Run menu.
Note that an execution will always drop into the debugger if there is a runtime error, even if you are not debugging.
Note also that very long running executions will drop into the debugger if you press the pause icon (usually in a panel of six icons at the top of the Editor space, though it can be moved). A paused execution can be resumed in the same way as a stop at a regular breakpoint.
Although you can edit the launch.json file by hand, it is usually much easier to use code lenses that appear in the Editor view above executable functions and operations (the Launch| Debug widgets that appear). If there are no lenses above a definition, it is probably private (which is the default in VDM++ and VDM-RT) or it is a constructor, which are not usually executed directly.
In order to create a launch, VDM-SL lenses must ask for argument values for each of the definition's parameters. VDM++ and VDM-RT additionally require you to identify a constructor and its parameter values, if any. For example:
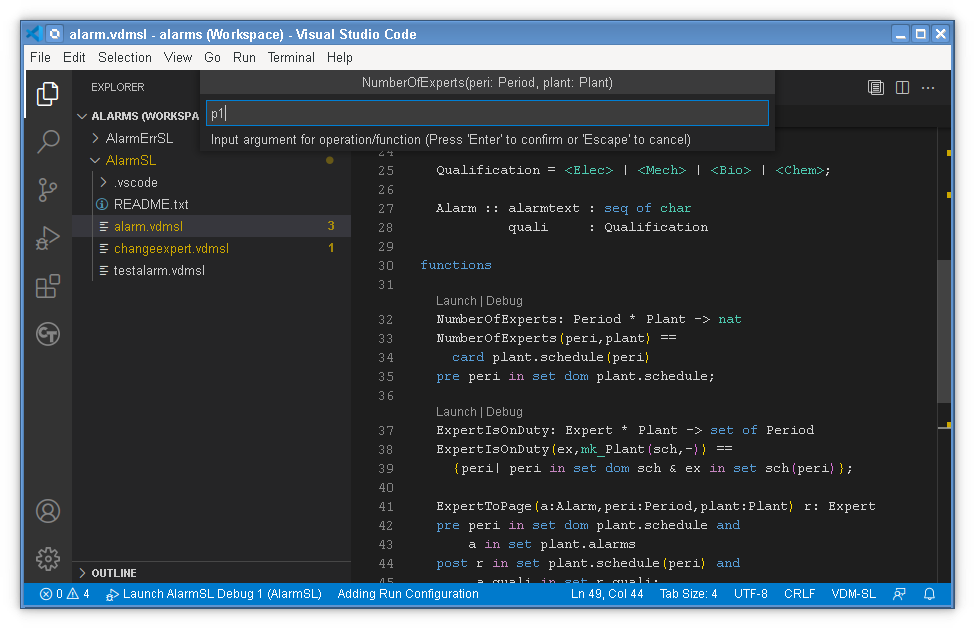
The arguments specified can be literals, or they can be named values that are visible globally. Note that the name:type of the parameters are shown to you in the text box that accepts the values, and the overall signature is shown above that.
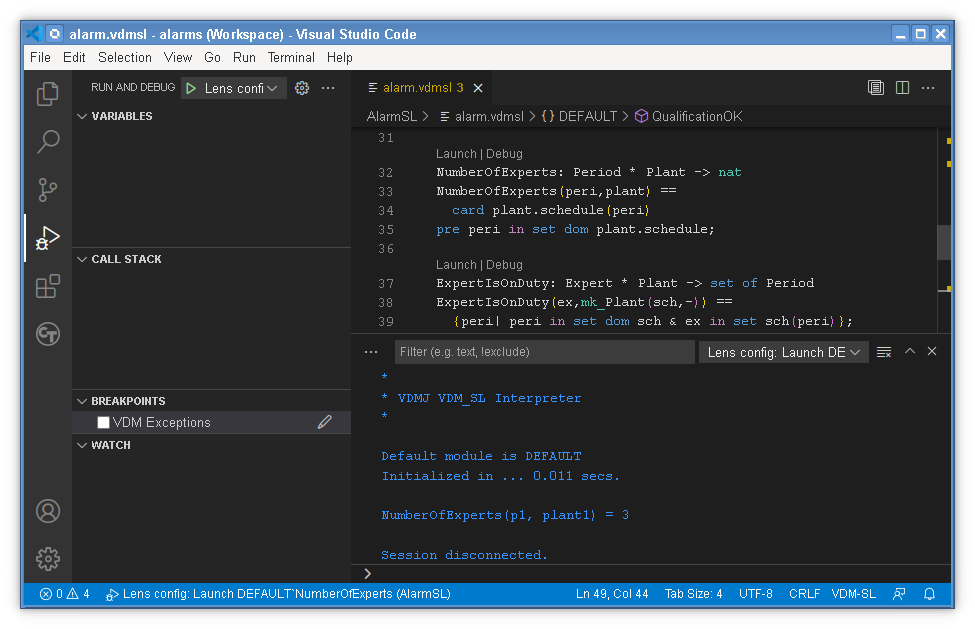
When all of the arguments have been supplied, a launch configuration is created and the evaluation proceeds by opening a Debug Console, which is the same for any launch configuration.
A lens-created launch configuration remembers the last arguments entered, and re-clicking the lens will allow them to be edited; clicking the Debug lens will overwrite a Launch lens and vice versa.
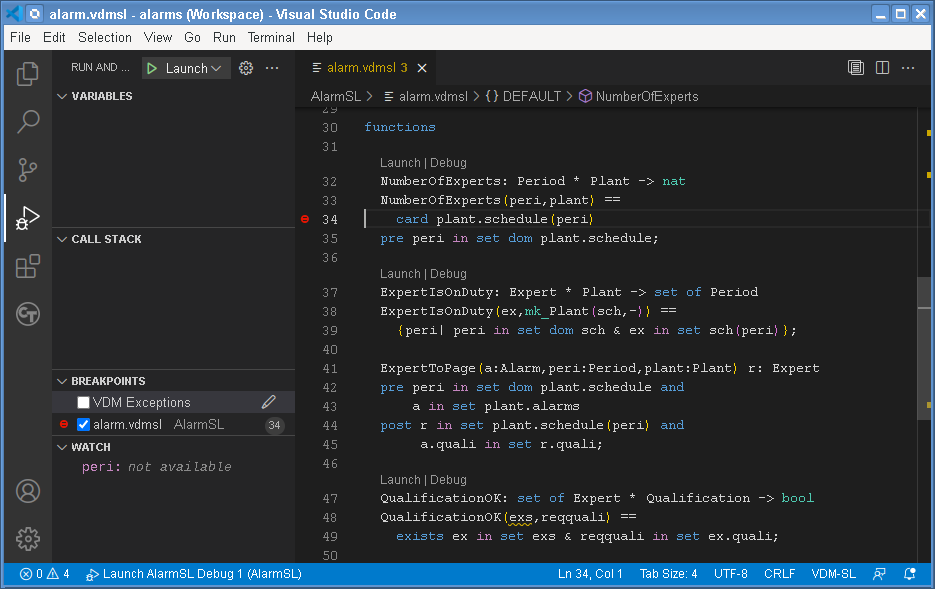
Breakpoints can either be set before an evaluation, or set when an evaluation has started and is waiting at the Debug Console or at another breakpoint. They are set by clicking in the left hand gutter of the Editor view of the file concerned, beside the line numbers. A pale red dot appears as you hover over the gutter, becoming a solid dot when you click. The breakpoints set also appear in the Breakpoints view within the Run and Debug panel.
Breakpoints have to be set on lines that contain executable expressions or statements. You will find that you can apparently set breakpoints on other lines, but when an executable session is opened the red dots will turn into open circles, indicating that they are not valid. Beginners often try to set breakpoints on the definition line of a function, for example. Rather, you must set them on the first line of the function's expression.
Watches are expressions that will be evaluated when execution reaches a breakpoint. They can be added and removed via the Watches view in the Run and Debug panel. Although you can make calls in a watch expression, you are strongly advised not to, since operation calls can change the state of the model.
The debugging features available are fairly standard. You can step over, into or out of functions using the icons in the panel of six at the top of the Editor view, as well as continuing the evaluation or stopping it. The Variables panel allows you to see what is in the current stack frame, and the Call Stack panel shows the current frames (and in object-oriented dialects, the current threads).
Breakpoints can be conditional, either using an Expression (that must evaluate to true to stop) or using a Hit Count (which must be of the form =N, >N, >=N, mod N, where N is a positive integer). You can alternatively set a breakpoint to Log Messages to stdout, but not stop. Logged messages can contain {<exp>} strings, which will substitute the value of the expression.
To make any breakpoint conditional, right-click the breakpoint on the Editor view, or use the Edit icon in the Breakpoints view. The condition is edited in the Editor view, for example:
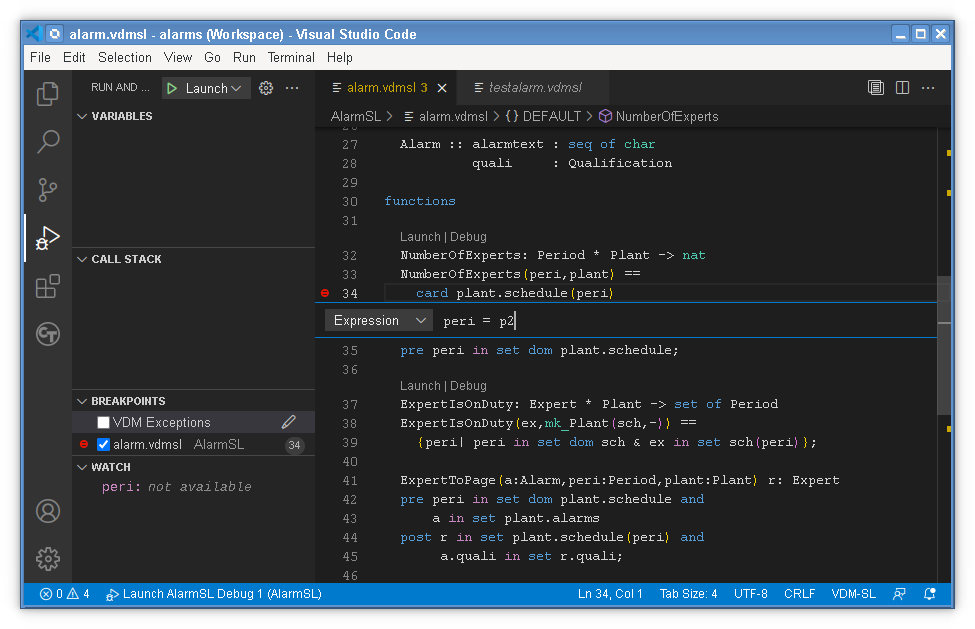
Note that you can only use one type of condition on a breakpoint, even though the UI will allow you to set (say) an expression, and a hit count and a log message.
Making test executions is a useful way to gain confidence in your specification, but it is helpful to be able to see how much of the specification has been exercised by tests. To allow this, VDM VSCode can display coverage information after an execution.
If you use one-shot launches, coverage data is reset at the start of each run. You may then optionally save that coverage information after the run, and display it as an "overlay" on the Editor view. To enable the overlay, click the Enable Coverage Overlay icon at the top of the Editor window. If you have not generated any coverage data, you will be prompted to do so, which will save the data from the most recent execution in a folder called .generated/coverage/coverage <date>,<time>. The files within have the extension .covtbl.
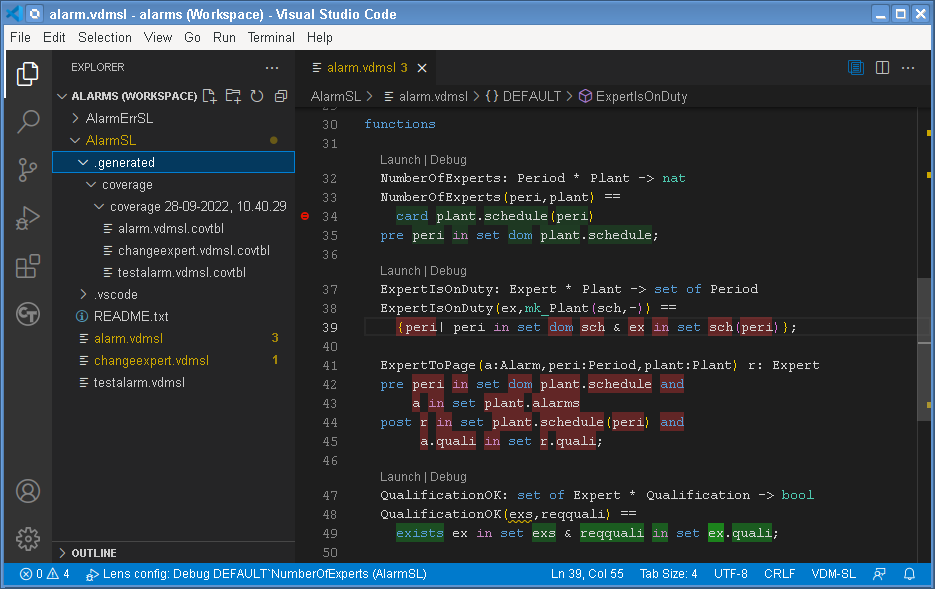
Here we see the coverage after an execution of NumberOfExperts. The parts of the specification that were executed are shown in green; the parts that were not in red. Note that an execution may involve the coverage of parts that you may not think of, like the QualificationOK function, which is part of the invariant of the types concerned in the execution.
Note that coverage only colours the parts of the specification that could be executed in principle, so for example, the parameter/type definitions at the start of a function are not coloured.
Old coverage data can be safely deleted from the .generated folder without affecting the rest of the project.
More information about generating and displaying coverage can be found here;
One-shot tests are an easy way to start testing a model, but for most models, to achieve complete testing would require too many individual test cases to be specified. To improve this situation, combinatorial tests can be specified as test patterns, which are then expanded into very many individual test cases automatically. Such test patterns are defined in a section called traces.
The AlarmSL example defines two traces in the testalarm.vdmsl file, at the bottom.
If a specification contains any traces, VDM VSCode automatically detects them and adds a Combinatorial Testing button on the Activity Bar on the left of the UI - a circle with "CT" inside. Selecting this activity opens the main Combinatorial Testing panel:
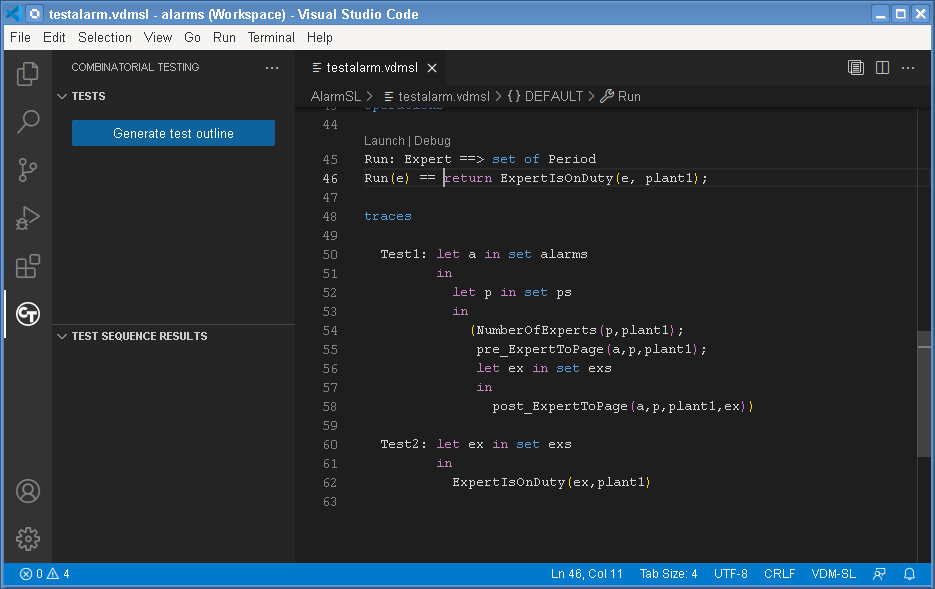
The first option, represented by the Generate test outline button, selects a project (there may be several projects in the workspace with traces). Note that VDM VSCode can only work with one project at a time.
Having selected a project, the outline of the traces is created. This means that the tool searches for individual trace definitions in the project, and lists one heading for each. But the process of expanding those traces into test cases does not yet occur. This is important, because the expansion process can be expensive for traces that generate (say) millions of tests.
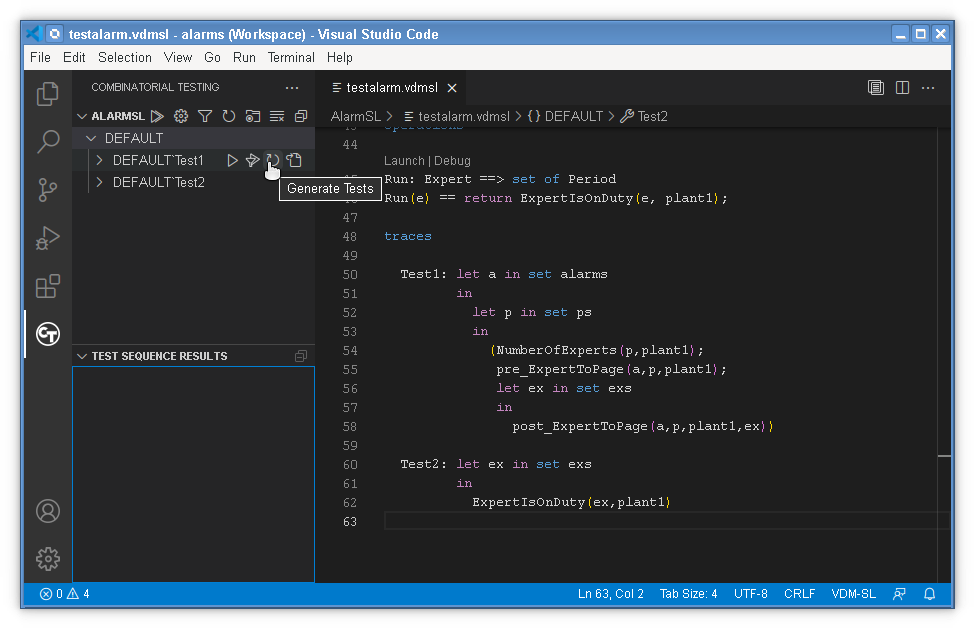
Hovering the cursor over each of the two traces, DEFAULT'Test1 or DEFAULT'Test2, reveals icons that offer to do a Full Evaluation, a Filtered Evaluation, to Generate Tests or to Go to trace in the source. The simplest option is to do a full evaluation, which generates the tests if they have not already been generated and then executes them one at a time.
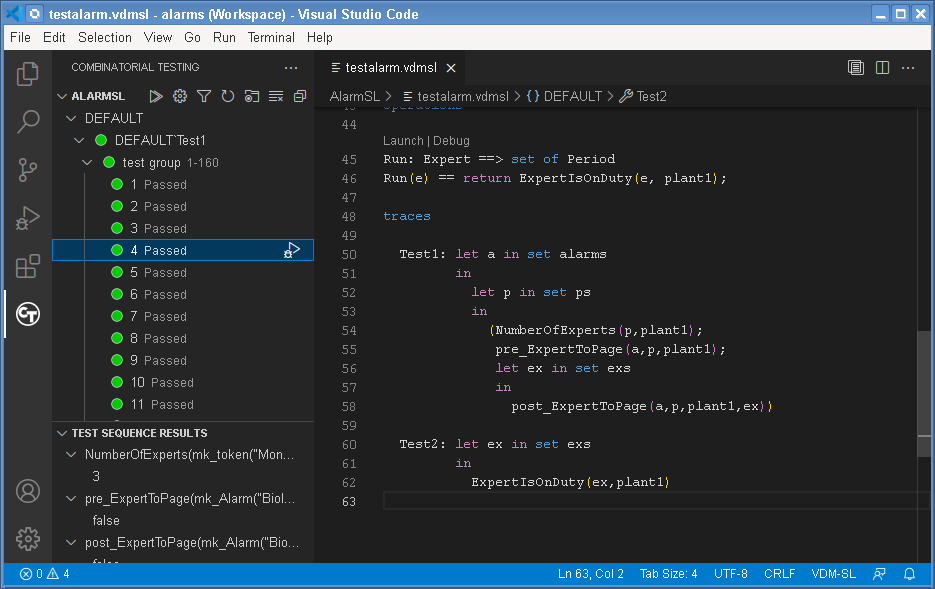
Note that the trace has been expanded into 160 tests. Tests are displayed in "test groups" of up to 200 tests, to make the navigation of very large numbers of tests easier. In this example, all of the tests have succeeded, as indicated by the green dots. Test failures would be indicated by red dots.
If you select an individual test (e.g. test 4 is selected in the screenshot), the sequence of function or operation calls it performed, along with their results, are shown in the Test Sequence Results panel. In the example, you can see that calls were made to NumberOfExperts which returns 3, and pre_ExpertToPage and post_ExpertToPage, which both return false.
The highlighted test 4 in the main panel also shows a Send test to interpreter icon at the end of the line. This enables one individual test to be launched in debug mode. It would normally be used to investigate tests that failed, but it will run any test. The output of the test will be the same as that shown in the Test Sequence Results:
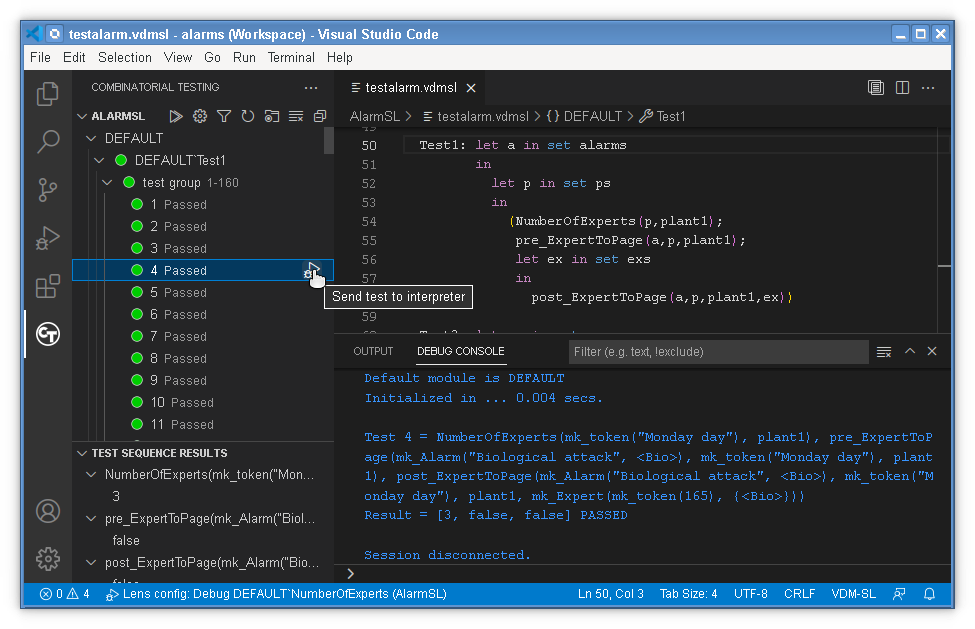
Here you can see "Test 4 = ..." and "Result = [3, false, false] PASSED".
If a trace generates extremely large numbers of tests (perhaps millions), it is convenient to only run a subset of them while designing traces. This is what a Filtered Evaluation is for.
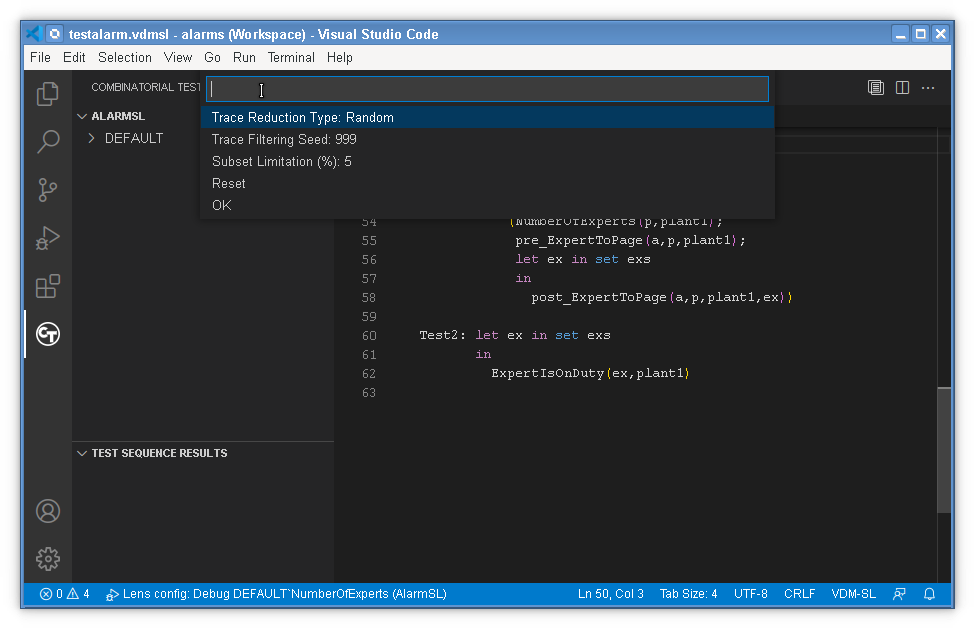
To perform a filtered execution, first a filter must be defined to decide how to reduce the tests. This is done by clicking the Set Execute Filter Options icon on the project line. This allows a reduction type, a random seed, and a reduction amount to be defined, as well as resetting the options and finishing. The simplest reduction is a Random type to select only (say) 5% of the tests.
If the tests are now executed with using the Filtered Evaluation option, rather than Full Evaluation option, many of the results will show as Filtered rather than Passed or Inconclusive. These can be removed from view, using the Filter Test Results icon, leaving close to the 5% subset of tests that were executed.
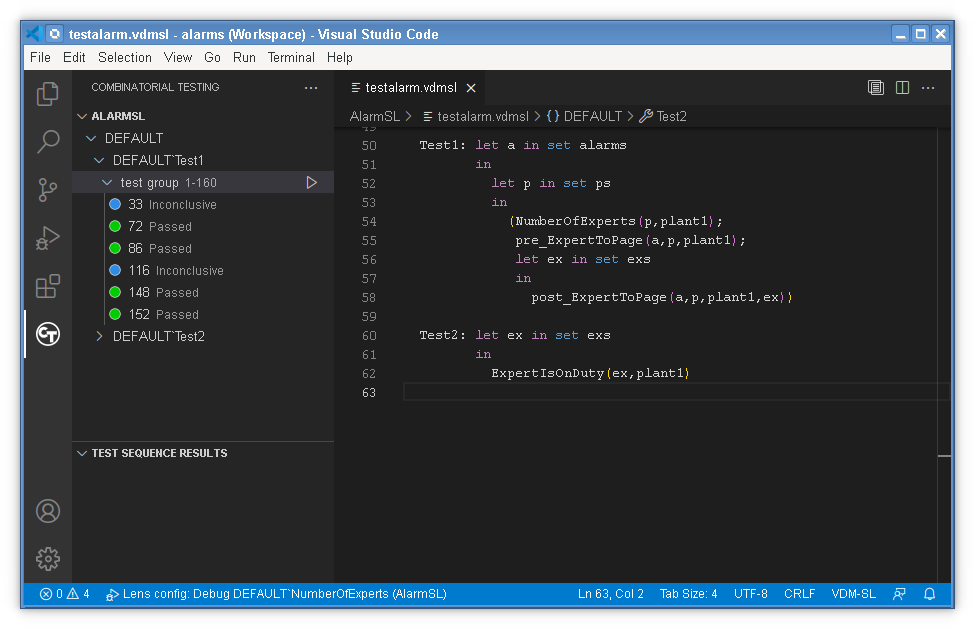
You can now see that some of the results are "Inconclusive", which was not clearly visible before. You can investigate why a test is inconclusive by using the Send test to interpreter option for one of them. The reason is usually a runtime error, but one which occurs so early in the execution that it may be an error in the design of the trace rather than in the specification itself. For example:
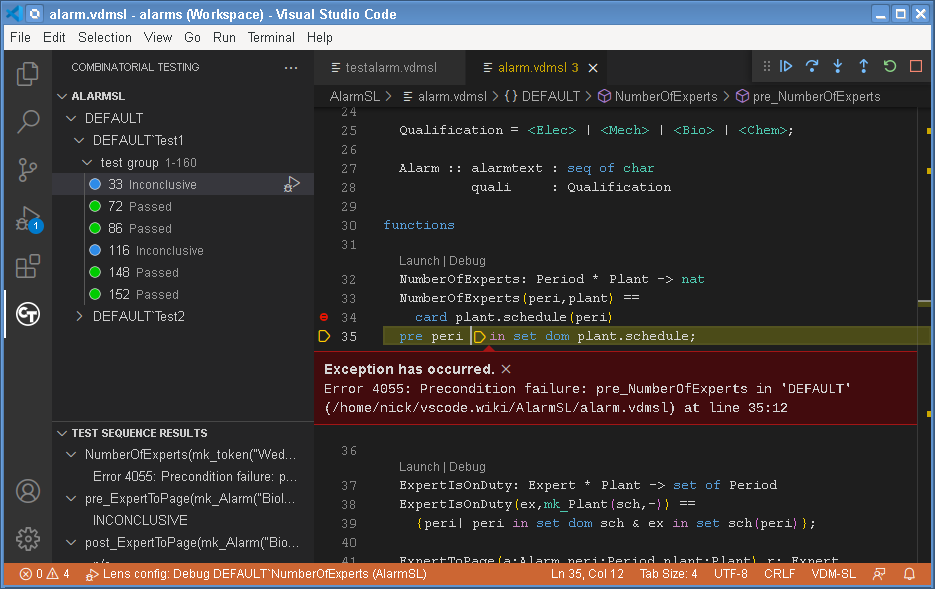
The problem is a precondition failure, because the Period p5 is not a member of the schedule for plant1, but it is included in the Periods that are used in the trace. That may or may not be deliberate!
VDM VSCode can generate Proof Obligations for a VDM-SL model. These are boolean expressions which highlight areas of the VDM-SL model where some constraint must be met in order to guarantee internal consistency (i.e. no run-time errors will occur while debugging if these are all satisfied). This includes type and class invariants or function or operation pre/post conditions. Each proof obligation should evaluate to true.
This feature is invoked by right clicking on the project in the Explorer view and then selecting VDM > Run Proof Obligation Generation entry. This will open a view showing the list of POs generated. For the AlarmSL example this view is shown below.
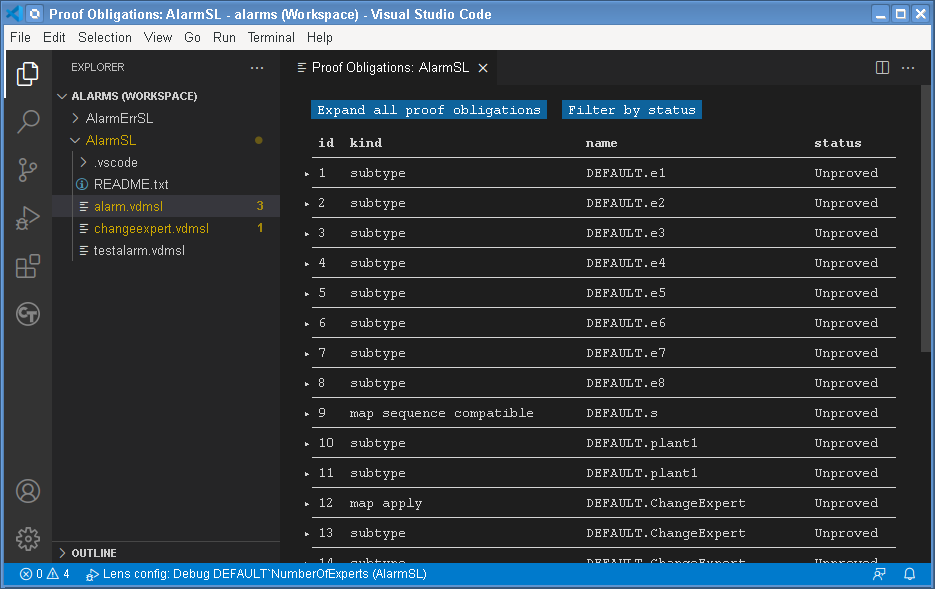
The POs can be expanded by clicking on them. For example proof obligation #26 records the constraint that, for all possible arguments satisfying the pre-condition of ExpertToPage, the post-condition allows at least one possible valid result of the function. This is described as a proof obligation as follows:
(forall a:Alarm, peri:Period, plant:Plant & pre_ExpertToPage(a, peri, plant) =>
    exists r:Expert & post_ExpertToPage(a, peri, plant, r))
In general, users check proof obligations by inspecting the VDM-SL model, though new Isabelle based tools are being developed to check the majority of proof obligations automatically using formal proof and related techniques. You can also note that in the Proof Obligation Explorer view there is a status field and a few of the proof obligations have a status of "Trivial". This is used to indicate that these proof obligations are trivially satisfied. It is also possible to get rid of such proof obligations in the list by pressing the Filter by status button at the top of the view.