Interpretation and Debugging - overturetool/vdm-vscode GitHub Wiki
The Quick Interpreter allows you to evaluate VDM-SL expressions without loading a specification. This is useful for quick calculations and experimentation.
To open it, use the command palette and run VDM: Open Quick Interpreter or click Open Quick Interpreter from the VDM submenu.
A terminal will open showing the working directory and a > prompt, where you can type VDM-SL expressions:

One of the most useful commands is print (abbreviated p), which evaluates a VDM-SL expression and prints the result. For example:

Note that the > prompt has command recall using the up and down arrow keys, which allows you to easily re-run or edit previous commands. Left and right arrow keys allow you to move within the current line.
Since no specification is loaded, the interpreter is only useful for pure expression evaluation. Commands that operate on a specification (such as modules, files, coverage, pog, etc.) will typically return no result. Type help to see all available commands.
Note that some commands (e.g. assert and script) read from files relative to the working directory shown at startup.
The Quick Interpreter uses the standard precision VDMJ jar by default, or the high precision jar if the active project has vdm-vscode.server.highPrecision set to true. Any JVM arguments configured in vdm-vscode.server.JVMArguments are also respected.
As long as you use the executable subset of VDM, you can test your specifications by running them in an interpreter, which will also allow you to debug them. To start the VDM interpreter, click on the Run & Debug icon on the activity bar (on the left of the UI, or type CTRL-SHIFT-D). If you have not run any projects in your workspace before, you will see a page like this:
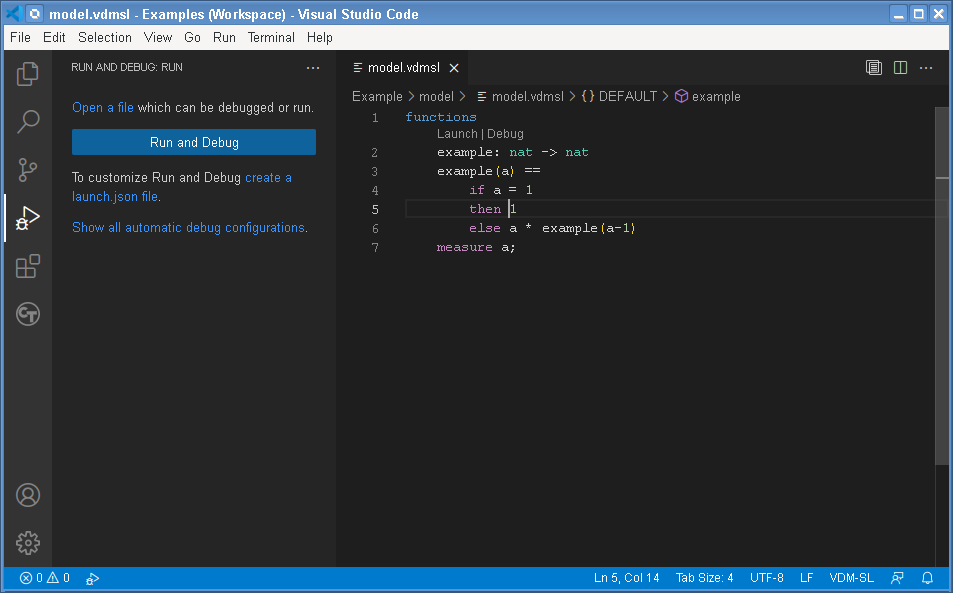
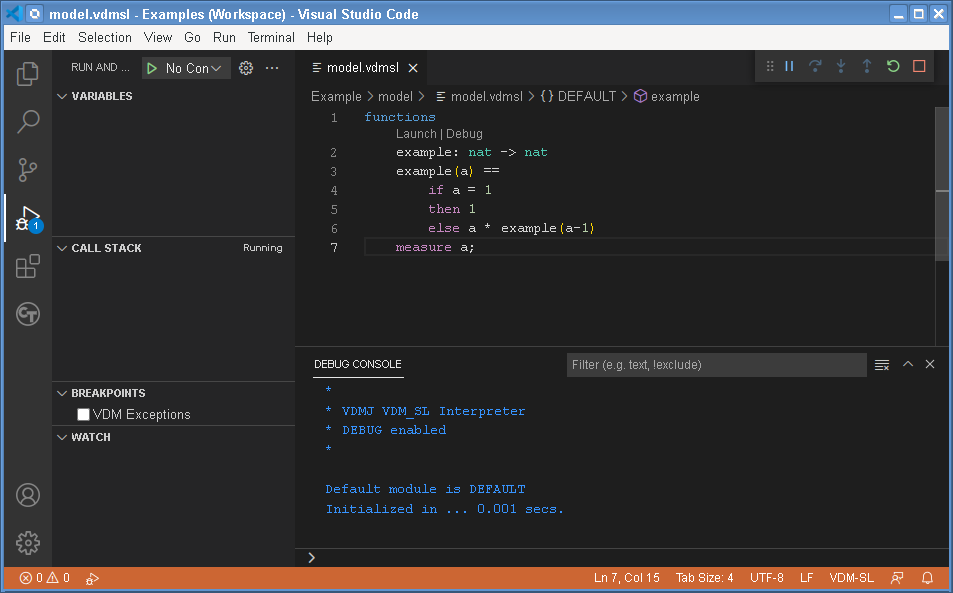
The first part of the dialog does not apply to VDM (you cannot open and run an individual VDM source file). But if you click the Run and Debug button, a new debug console session will be opened with the language server. The interactive console should appear automatically, but if it does not you can open it with CTRL+SHIFT+Y or via the View menu. Commands are entered at the > prompt on the bottom of the screen.
Note that if the interpreter is started without first opening a VDM file, a full typecheck of the project will be triggered automatically before the session begins. For large projects, this may take a few seconds, but the interpreter will start as normal once the typecheck completes.
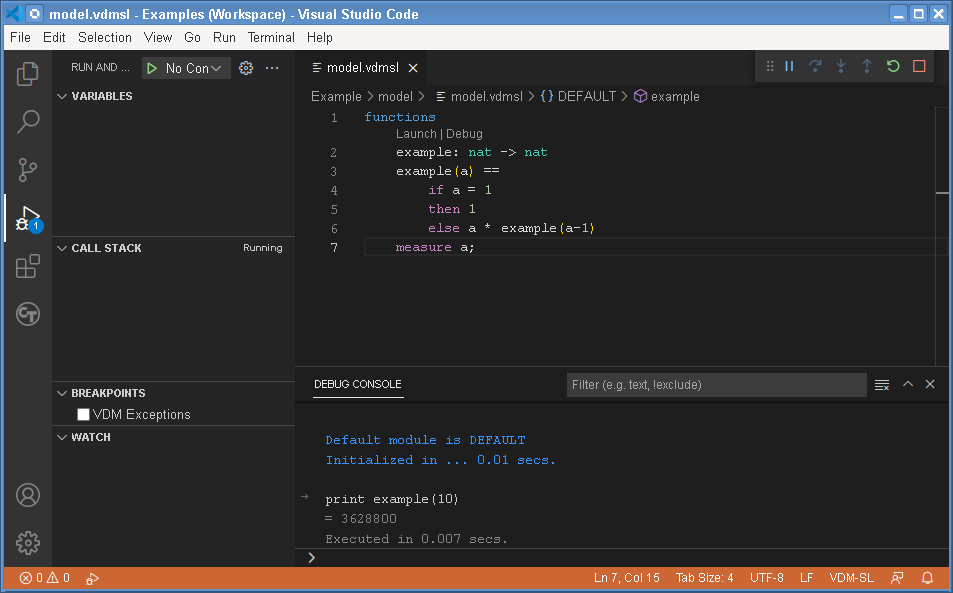
In this state, you may enter commands (the help command is a good start) which are submitted to the interpreter. The most important of these is the print command (which can be abbreviated to p). The syntax is print <expression> and this is the usual way in which evaluations are started. The result of an expression evaluation is returned to the console, along with an indication of how long it took.
Note that the > prompt has command line recall, using the up-arrow key, which allows you to easily re-run commands or edit previous commands.
Note that you can also see Variables, a Call Stack, Breakpoints and Watches on the left hand panel. These are for the VDM debugger, which can be entered when a breakpoint is hit or an exception is raised. The easiest way to set a breakpoint is to click on the Editor in the left hand "gutter" - you will see a faint red dot appear, which becomes solid when you click, and the breakpoint is then listed in the Breakpoints list on the left. If you repeat a print command, the evaluation will now stop when it reaches the breakpoint or raises a runtime exception, allowing you to look at variables, stack frames and so on. You can also interrupt a very long-running evaluation by use the "pause" icon, which will also drop into the debugger.
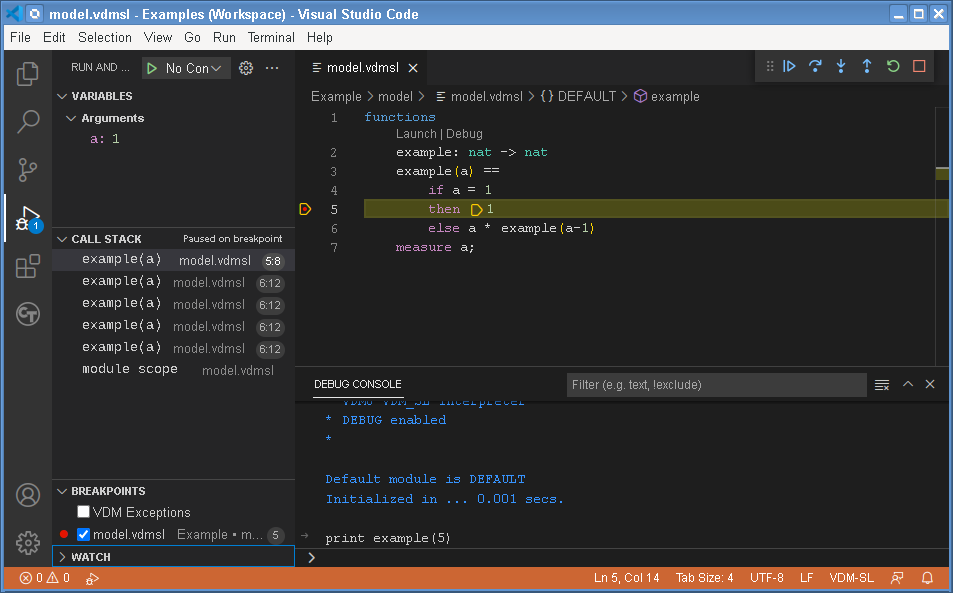
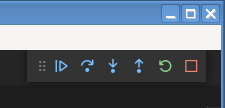
You can see that the top frame has an Argument of a: 1. There is a call stack that shows the execution is stopped at a breakpoint, and there are five recursive example frames with a module scope at the bottom. At the top right of the screen, there are four icons that allow you to continue, step over, step into or step out of a function/operation; there are also two icons that allow you to restart or stop the whole debugging session.
NOTE: It is best to use the continue button, if possible, to terminate execution at a breakpoint or exception. You can use the stop button, but Visual Studio Code gets confused, because this does not stop the whole debugging session if you are at a breakpoint or exception.
Normally, you would close an interpreter/debug session with the quit command (or just q), or you can click the red stop button.
To edit a breakpoint's options, either right-click the breakpoint in the editor gutter and select Edit Breakpoint, or click the pencil icon next to it in the Breakpoints panel. Four options are available:
-
Expression/Hit Count: Both of these fields accept either a boolean VDM expression (e.g.
a > 5) or a hit count condition. Hit count conditions use the following syntax:-
= 123- stop exactly on the 123rd hit -
> 123- stop after more than 123 hits -
>= 123- stop on the 123rd hit and every one after -
mod 123- stop on every 123rd hit (i.e. every multiple of 123)
-
-
Log Message: Logs a message to the Debug Console instead of stopping. You can embed VDM expressions in
{curly braces}, e.g.Current value is {a}, and they will be evaluated and substituted in the output. -
Wait for Breakpoint: Pauses execution at this breakpoint until another specified breakpoint is hit first.

In addition to line breakpoints, you can set function breakpoints by clicking the + button in the Breakpoints panel header and typing a function name. The debugger will then stop whenever that function or operation is entered, without needing to know which line it is on. If you have a multi-module or multi-class project, you can specify the full name of the function, like Utils`nat2str, and if you are using VDM++ or VDM-RT then you must give a parameter list, like get() or getType(nat, seq of T), to allow for overloading.
Note that function breakpoint markers (red triangles) will only appear when you are in an active debug session.

The example above requires you to type print commands for each new execution that you want. This is sometimes useful if you know that you want to make a series of different executions in one session. But it is also very common to repeatedly execute a single function or operation, passing fixed argument values. To enable this, you can add a configuration in a file called launch.json.
There are code lenses described below that enable you to do this very simply. But the following discussion shows you what the lenses do and how to achieve the same effect manually, to enable the full power of launch configurations.
To create a launch configuration, you can choose the "create a launch.json file" option in the Run and Debug panel, which will ask which project you want the file to apply to (or whether it applies to the whole workspace - ie. any project). It is usual to have one launch.json file per project, and this is written into the .vscode subfolder in the project. You will also be invited to "Select a debugger", with "VDM (SL, PP or RT)" suggested - select this one. This will then create a template launch.json file for you.
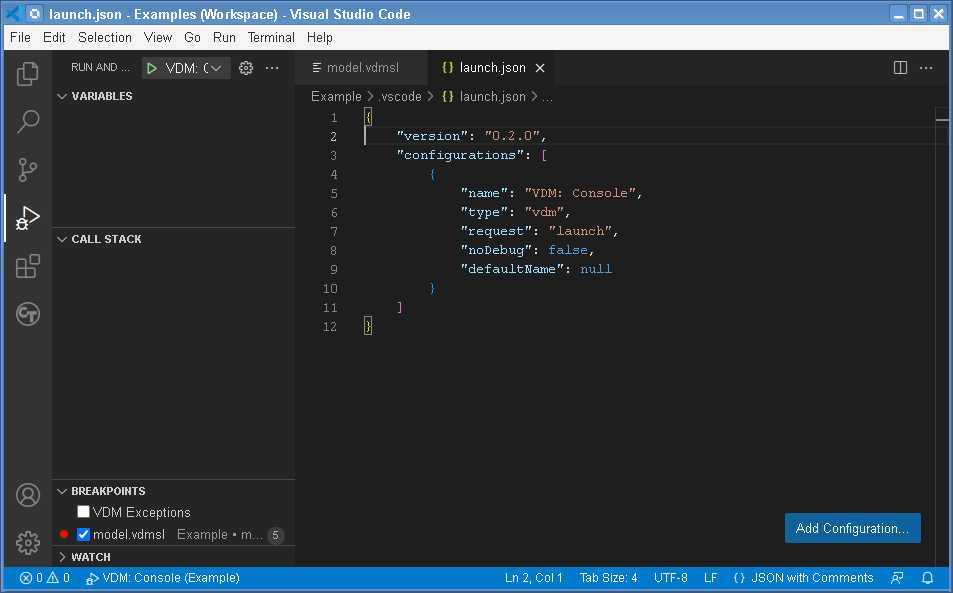
The default settings are those used to launch the console as before, but it is possible to add a "command" option, which is the same as the print <expression> command that you could use in the console. This will then automatically run that command and then quit the session. The name of the launch can also be changed to be sensible. For example:

This will write the launch.json file into the Example/.vscode folder, and that in turn will make the option appear in the drop-down menu at the top of the Run and Debug panel. You will also notice that the default Run and Debug panel no longer offers to create a launch.json file or run a default console. Rather, it shows the debugger views (Variables, Call Stack and so on).
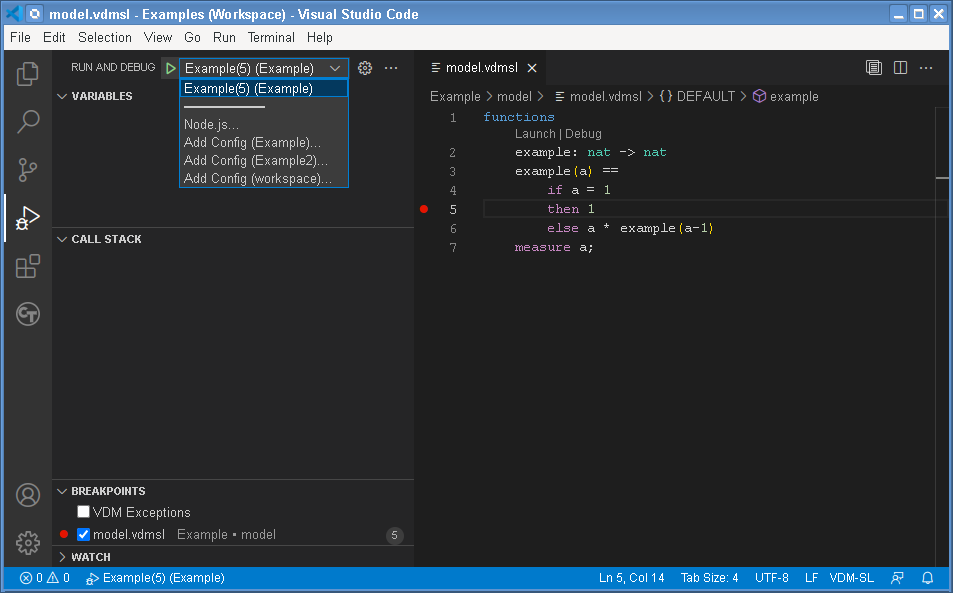
In general, multiple launch configurations can be created in launch.json and selected from this menu. The F5 key automatically (re-)runs the last selected launch configuration (or you can use the Run menu). So with our "Example(5)" example above, pressing F5 will produce the following:
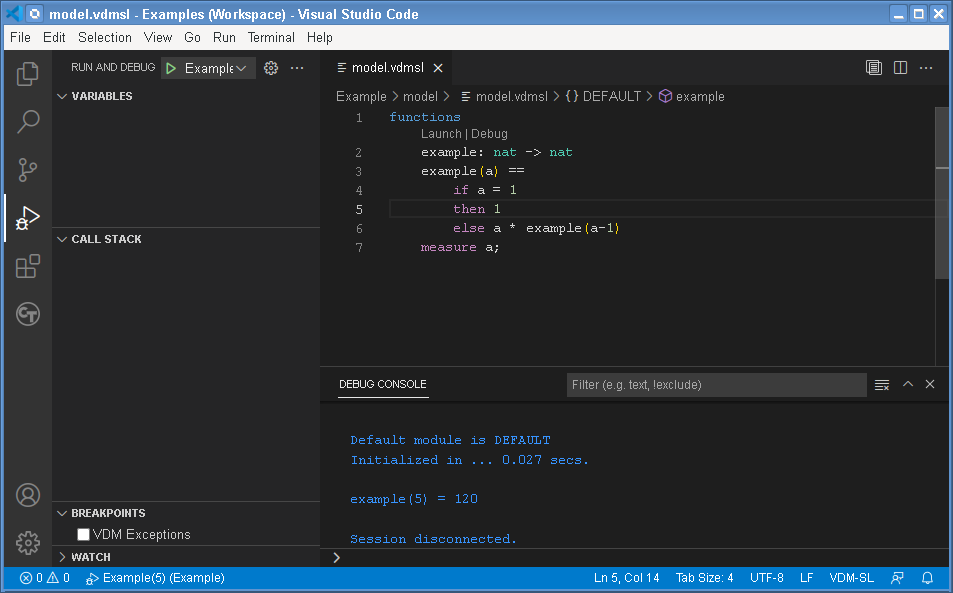
Note that the result of the evaluation is shown immediately ("Example(5) = 123") and the session is automatically disconnected. If there were breakpoints set, F5 would respect them and stop. Alternatively, you can run with CTRL+F5 (or use the Run menu) to ignore breakpoints.
Launch configurations also support curried functions and polymorphic functions. Launch and Debug lenses appear above both just like normal functions. When activated, you will be prompted to enter each argument group separately for curried functions, and to enter type parameters for polymorphic functions. Both can also be supplied in the command field (e.g. p f(x)(y) for curried and p f[nat](x) for polymorphic).
To make execution and debugging easy using the extension we have added code lenses for all public operations and functions.
These appear above their respective definitions.
When pressing Launch or Debug a launch configuration is generated and launched immediately.
If the operation/function has parameters you will be prompted to input these, the same applies if the class that the operation belongs to has a constructor that takes parameters.
Example of a lens-generated launch configuration
{
  "name": "Lens config: Debug Test1`Run",
  "type": "vdm",
  "request": "launch",
  "noDebug": false,
  "defaultName": "Test1",
  "command": "p new Test1().Run()"
}
Notice that the name starts with Lens config: if you remove this the launch configuration will not be overwritten the next time you activate a lens.
In addition to the default entries, you can add advanced entries for various settings and properties.
- Name: Name of the launch configuration which is displayed in the debug tab.
-
Type: Type of launch configuration. Should always be
"vdm". -
Request: Request type. Should always be
"launch". - No Debug: An optional flag to disable debugging. If enabled (true), breakpoints etc. are disabled.
- Default Name: The default module/class name to use, if not specified in the command.
- Command: The command to execute in the VDMJ interpreter. If empty the interpreter console is launched.
A number of additional entries can be added to the launch configuration as needed. These are:
- Trace: Enables logging of the Debug Adapter Protocol.
- Remote control: Delegates the control of the interpreter, thus the remote controller is in charge of the execution or debug session.
- Settings: Grouping of entries described below.
This entry is a grouping of a number of settings entries.
Run-time checks that can be enabled/disabled when executing or debugging the specification (enabled by default):
- Dynamic type checks: Continuously type check values. If disabled you may get internal Java errors (null pointer or class cast exceptions typically) rather than nice clean VDM type errors about mismatched types.
- Invariant checks: Continuously check both state and type invariants. Note that this option can only be disabled if dynamic type checking is also disabled.
- Precondition checks: Continuously check pre-conditions for all functions and operations.
- Postcondition checks: Continuously check post-conditions for all functions and operations.
- Measure checks: Continuously check recursive functions, for which a measure function has been defined.
- Precision: Sets the precision level if using high precision (ignored for regular precision).
- Enable logging: Enables or disables logging of real-time events when execution VDM-RT specification (ignored for VDM-SL and VDM++).
Following is an example of the settings entry with all sub-entries:
"settings": {
  "dynamicTypeChecks": true,
  "invariantsChecks": true,
  "preConditionChecks": true,
  "postConditionChecks": true,
  "measureChecks": true,
  "enableLogging": false,
  "precision": 100
}
You can also set select vdmj.properties entries using a "properties" field in a launch configuration. These just apply to the launch, so only a few VDMJ properties make any difference (e.g. changing parser settings has no effect). For example, the following setting will allow power sets to be calculated for sets with up to 40 elements (instead of the default of 30).
"properties": {
  "vdmj.in.powerset_limit": 40
}
The complete set of VDMJ properties that can sensibly be set via a launch is as follows (others are ignored):
vdmj.scheduler.fcfs_timeslice
vdmj.scheduler.virtual_timeslice
vdmj.scheduler.jitter
vdmj.rt.duration_default
vdmj.rt.duration_transactions
vdmj.rt.log_instvarchanges
vdmj.rt.max_periodic_overlaps
vdmj.rt.diags_guards
vdmj.rt.diags_timestep
vdmj.in.powerset_limit
vdmj.in.typebind_limit
You can find out more about VDMJ properties here.