Request Logging - hugalafutro/model-hotel GitHub Wiki
📜 Request Logging
Every request that passes through the proxy is logged with detailed telemetry. This helps you understand performance, identify bottlenecks, and debug issues.
What Gets Logged
[!IMPORTANT] The proxy records metadata only - never the prompt content or response text.
All fields are written to the request_logs PostgreSQL table.
Request Log Schema
| Column | Type | Description |
|---|---|---|
id |
UUID | Primary key, generated by the proxy before the row is written |
request_hash |
TEXT | Random 16-character hex request identifier (8 random bytes from crypto/rand). Not content-derived. |
model_id |
TEXT | The requested model (e.g. deepseek/deepseek-chat or hotel/gpt-4) |
provider_id |
UUID | Which provider handled the request. NULL until resolved, and set back to NULL if the provider is later deleted. |
virtual_key_id |
UUID | The virtual_keys id the request authenticated with (NULL for anonymous and dashboard requests). A plain UUID with no foreign key, so it outlives the key's deletion. |
virtual_key_name |
TEXT | Which virtual key was used. Retained even after key deletion for audit purposes. |
status_code |
INT | HTTP status for the request, rewritten across its lifecycle. See Status code and error kind over a request's life. |
error_message |
TEXT | Error text on failure, capped at 10,000 characters. Populated for upstream provider errors and proxy-internal errors (invalid model format, provider not found, etc.). Empty on success. |
error_kind |
TEXT | Machine-readable failure classification (migration 045). NULL on success and on rows predating the column. See Error classification and status codes. |
streaming |
BOOLEAN | Whether the request used SSE streaming |
failover_attempt |
INT | Which attempt this was - 0 for the first try, incrementing with each failover |
resolved_model_id |
TEXT | The actual upstream model ID used (e.g. z-ai/glm-4.6). Written only for hotel/ requests, where it differs from the requested model_id (e.g. hotel/glm-4.6); empty for direct provider requests. |
state |
TEXT | Request lifecycle state: pending → streaming → completed or failed |
endpoint_type |
TEXT | Endpoint family the request came through: chat (default), messages, embeddings, rerank, image, tts, or stt. Written at INSERT time; exposed in the Logs API, filterable via ?endpoint_type=, and shown as a badge in the dashboard Logs page for non-chat requests. |
attempts |
JSONB | Per-attempt trail: one element per failover attempt, hedged probe and pre-request skip. NULL for rows predating migration 078 and for requests that never committed to a provider. See Per-attempt trail. |
duration_ms |
REAL | End-to-end wall time (request start to response end) |
latency_ms |
REAL | Provider response time only (duration_ms - proxy_overhead_ms) |
proxy_overhead_ms |
REAL | Total proxy overhead (sum of all seven overhead phases) |
parse_ms |
REAL | JSON parsing and request validation time |
failover_lookup_ms |
DOUBLE PRECISION | Time resolving the failover group for hotel/ requests (0 for direct requests) |
model_lookup_ms |
REAL | Time resolving the model entity, checking enabled status, building candidate list |
provider_lookup_ms |
REAL | Time finding provider record in database (excludes key decryption) |
key_decrypt_ms |
REAL | Time decrypting provider API key (first call per 10-minute cache window; subsequent calls near-zero) |
settings_read_ms |
DOUBLE PRECISION | Time reading runtime settings from cache (circuit breaker state, rate limits, etc.) |
dial_ms |
DOUBLE PRECISION | Full DNS + TCP dial time to the upstream provider (renamed from safe_dial_ms in migration 032) |
cache_hits |
JSONB | Per-component cache hit/miss flags (failover, model, provider, key, settings); true = prewarmed cache hit, false = miss, absent = not applicable |
response_header_ms |
REAL | Time until upstream HTTP response headers arrived (renamed from the old ttft_ms in migration 035, which had actually measured headers, not tokens) |
ttft_ms |
REAL | True time to first token (streaming requests only). Measured by the TTFT probe that reads ahead to confirm the first data chunk before committing the stream. |
tokens_per_second |
DOUBLE PRECISION | Streaming throughput (completion_tokens / generation_duration × 1000) |
tokens_prompt |
INT | Number of prompt tokens reported by the provider |
tokens_completion |
INT | Number of completion tokens reported by the provider |
tokens_completion_reasoning |
INT NOT NULL | Reasoning tokens (DeepSeek-R1, etc.), the part of tokens_completion a reasoning model spent thinking. A breakdown, not an extra count: never add it to completion. Written to DB and exposed in Logs API. |
tokens_prompt_cache_hit |
INT NOT NULL | Prompt cache hit tokens (DeepSeek). Defaults to 0. |
tokens_prompt_cache_miss |
INT NOT NULL | Prompt cache miss tokens (DeepSeek). Defaults to 0. |
search_units |
INT NOT NULL | Search units a rerank provider billed the request for, read off Cohere's meta.billed_units.search_units (migration 091). 0 on every other row and on rerank rows written before the column existed. |
cost_usd |
DOUBLE PRECISION | What the request cost in US dollars at the prices the models carried when the row was written (migration 085). The serving model prices its own share: cache-hit tokens at its cache-hit price when it has one, other prompt tokens at the input price, completion tokens (reasoning included) at the output price. In a walked failover group, each earlier candidate that answered 2xx without an answer billed its prompt too; that prompt is priced at that candidate's own model when it is rejected and added to the row, so the members' different rates each apply to what they read; a rejected candidate whose model has no prices is priced with the serving share at the serving model instead, so the row stays charged. Anthropic cache writes are priced as plain input (there is no cache-write price column; Anthropic bills them at 1.25x). A rerank served by a model with a search_price_per_thousand is priced from search_units instead of the token columns. NULL when the request never reached a provider or the model holds no usable price; a dispatched request that charged nothing, and a free model, price to 0. |
owner_user_id |
UUID | Dashboard user who owned the request when it was made: the session user on keyless rows (dashboard chat/arena, migration 067) and the key's owner on keyed rows (migration 088). The log and stats views still resolve a keyed row through the key's current owner, so reassigning a key moves its log history with it; dollar budgets sum this stamped column instead, so what a user spent stays theirs when the key moves or is deleted. |
client_ip |
TEXT | Trusted-proxy-resolved client address, written at INSERT time (migration 073). NULL on rows predating the column. Shown in the dashboard Logs IP column and detail modal; see Privacy. |
created_at |
TIMESTAMPTZ | When the request was inserted (defaults to now()) |
Status code and error kind over a request's life
status_code is nullable and starts empty. The initial INSERT omits it, so a request that never received upstream headers stays NULL. Once headers arrive the row is updated with the upstream status (typically 200) and moves to state='streaming', so a long-lived stream reads 200 while still in flight.
How it ends depends on where the request failed:
- Mid-stream failure: rewritten to
0, whatever the cause. Find these bystate = 'failed'anderror_kind, not by status. - Terminal upstream non-2xx (non-streaming): the upstream's own status is kept (
500,429,401, and so on). - All candidates exhausted with no forwardable response: the proxy synthesises a truthful gateway code:
499(client hangup),504(failover or retry timeout),429(every provider alive and at capacity), or502for everything else. - Rejected before any upstream attempt: validation and authorization failures carry their own code (
400,404,403).
error_kind is written alongside error_message and is the classification to filter on; the status alone cannot tell a busy provider from a broken one. The dashboard's "Interrupted" badge reads error_kind, falling back to substring-matching the English error_message only when it is NULL. The Prometheus error_kind label carries the raw value verbatim and is empty ("") when unset: it does not fall back, so legacy rows with no kind appear unclassified in metrics.
Per-attempt trail
The flat columns describe only the attempt that ended the request. attempts (migration 078) records the rest, written once when the request reaches a terminal state:
- One element per attempt, with the provider, the resolved model, the upstream status, the
error_kind, a duration and a TTFT. - Hedged probes that lost the race, and attempts abandoned when the race ended, are recorded too and flagged
hedged. A hedged race is still one log row: the losers live in the trail, not in rows of their own. - Candidates the circuit breaker or an in-flight limit refused before any request was sent appear with
attempt: -1and the reason. - A
breakerverdict per attempt says what the circuit was told:charge,noop,success,alive,skipped, ordisabled. detailcarries at most 160 characters of the sanitized, credential-masked upstream error text, never request content. The terminal attempt has none, because its error is the row's ownerror_message.
This is the only place a 429 on attempt 0 of a request another provider then served is visible. The attempt_provider_id and attempt_status filters on the Logs API query it.
Privacy Note
The proxy never logs prompt text, completion text, or any user content. The request_hash is a random identifier generated with crypto/rand (8 random bytes → 16 hex characters) - it is not derived from request content in any way.
Dead Columns
The request_id TEXT column (from the initial schema) was never populated by the proxy and was always empty in the Logs API response. It was dropped in migration 030_drop_request_id.sql.
⚠️ The
promptcolumn was removed in migration 027. It was added in migration 006 but no application code ever wrote to it. The column has been dropped entirely - it no longer exists in the database schema.
Proxy Overhead Breakdown
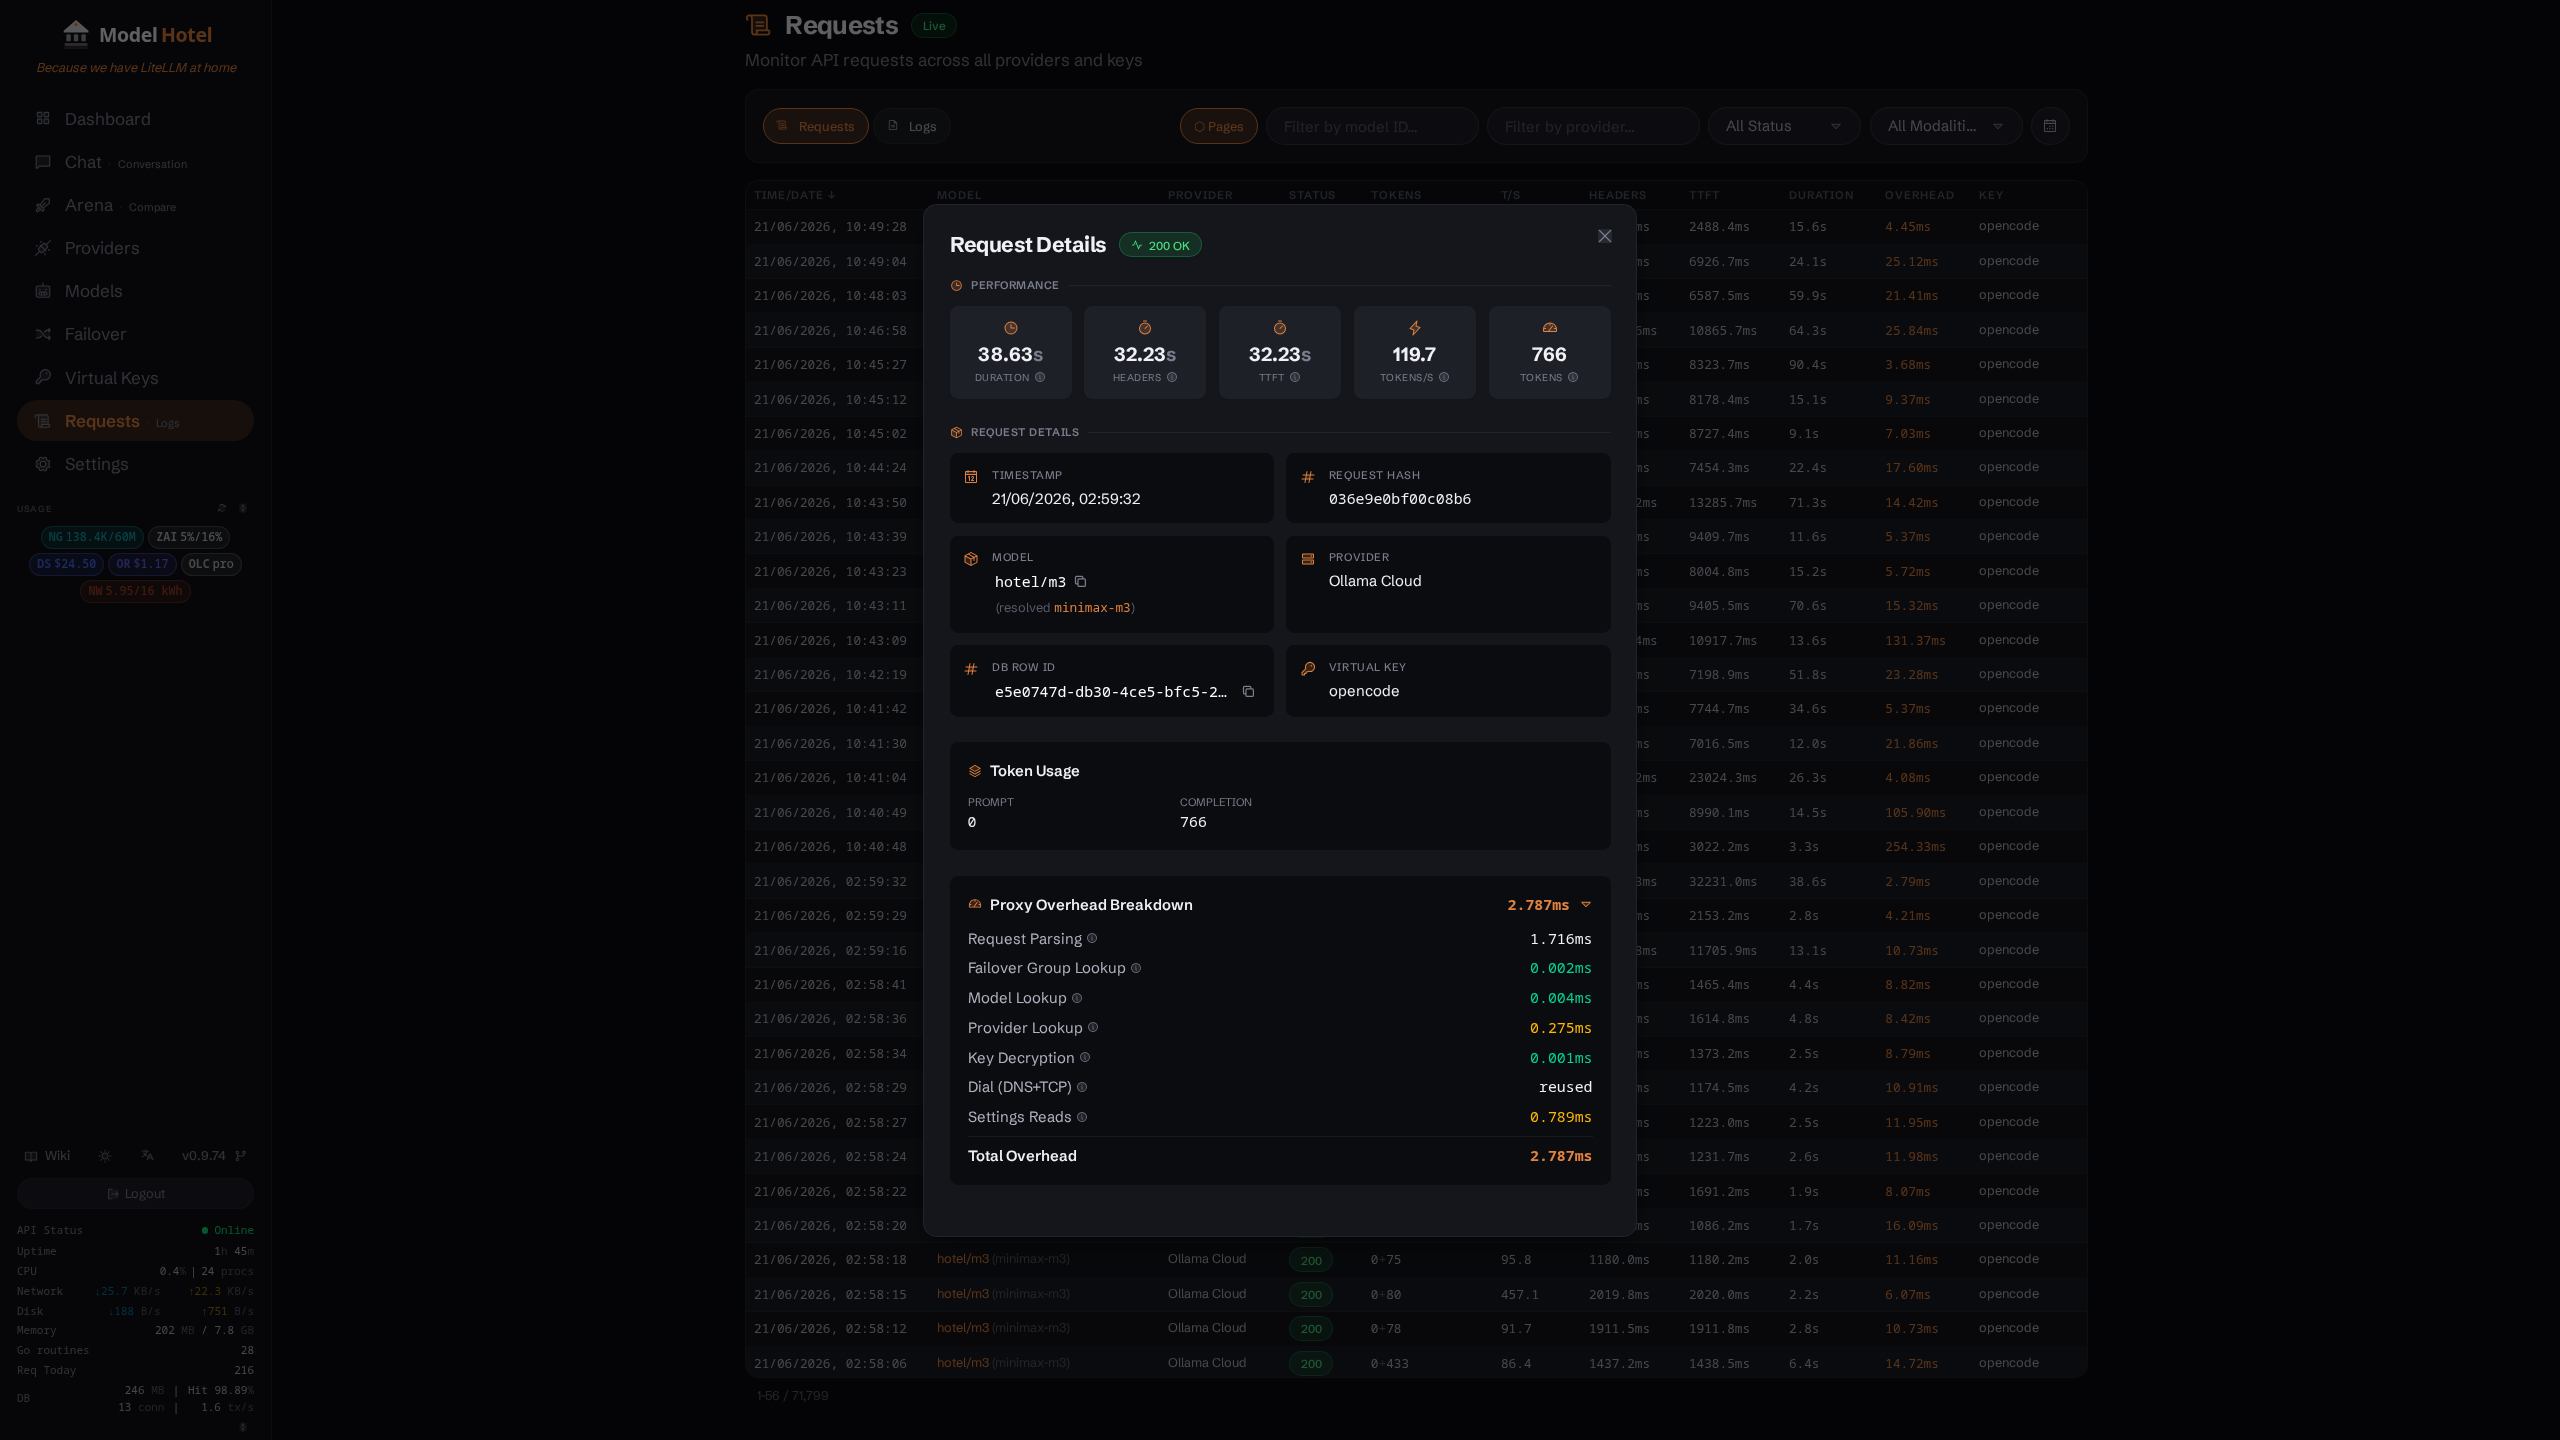
The proxy_overhead_ms field is decomposed into seven phases, measured in parallel with the actual provider request:
| Phase | DB Column | Description |
|---|---|---|
| Parse | parse_ms |
JSON parsing and request validation |
| Failover lookup | failover_lookup_ms |
Resolving the failover group for hotel/ requests (0 for direct provider requests) |
| Model lookup | model_lookup_ms |
Resolving the model entity, checking model and provider enabled status, and building the ordered candidate list |
| Provider lookup | provider_lookup_ms |
Finding the provider record in the database (excludes key decryption time) |
| Key decryption | key_decrypt_ms |
Decrypting the provider API key (first call per 10-minute cache window; subsequent calls within the window are near-zero) |
| Settings read | settings_read_ms |
Time spent reading runtime settings from the cached settings store (circuit breaker state, rate limits, etc.) |
| Dial | dial_ms |
Full DNS + TCP dial time to the upstream provider |
The companion cache_hits JSONB column records, per component (failover, model, provider, key, settings), whether the lookup hit a prewarmed cache - useful for explaining why the same phase is sometimes fast and sometimes slow.
These represent pure proxy overhead - the time spent inside Model Hotel before and after the upstream call. You can use this to determine whether latency is coming from the provider or from the proxy itself.
The relationship between fields is:
proxy_overhead_ms = parse_ms + failover_lookup_ms + model_lookup_ms + provider_lookup_ms + key_decrypt_ms + settings_read_ms + dial_mslatency_ms = duration_ms - proxy_overhead_ms
Log Lifecycle and State Machine
Request States
| State | Description | Transitions |
|---|---|---|
pending |
Initial state when request is received | → streaming (on headers) or → failed (on error) |
streaming |
SSE stream in progress (headers sent, tokens flowing) | → completed (on success) or → failed (on error/interrupt) |
completed |
Request finished successfully (2xx status) | Terminal state |
failed |
Request failed (4xx/5xx status, timeout, or stale cleanup) | Terminal state |
Logging Phases
1. Initial INSERT (async)
When a request arrives, the proxy generates the row's UUID and request hash immediately and fires the INSERT off in a goroutine with a 5-second timeout, so the handler is never blocked by the write. A failed insert is logged but does not fail the request.
Fields written at this stage:
id- UUID generated synchronouslyrequest_hash- Random 16-char hex IDmodel_id- From request bodystreaming- Boolean from requestvirtual_key_name- From context (if authenticated)virtual_key_id- From context (if authenticated)failover_attempt-0initiallystate-"pending"endpoint_type- Endpoint family (chatwhen unset)owner_user_id- The session user on keyless dashboard rows, the key's owner on keyed rows (see the schema table)client_ip- Trusted-proxy-resolved client address (NULL when the ingest path had none)
All other columns are NULL at this point.
2. UPDATE on headers (streaming) or on completion (non-streaming)
A single UPDATE statement writes everything else: the resolved provider and model, the status, the state, all seven overhead phases plus cache_hits, response_header_ms and ttft_ms, every token counter, error_message, error_kind, and the per-attempt trail. latency_ms is derived (duration_ms - proxy_overhead_ms) just before the write.
For streaming requests this runs twice: once when upstream headers arrive (pending → streaming) and once when the stream ends (streaming → completed/failed). For non-streaming requests it runs once (pending → completed/failed).
Because the row is visible from the first UPDATE onward, in-flight requests appear in the dashboard Logs table in real time, pulsing while they stream and settling as they finish. A request interrupted by a server crash or an unclean client disconnect stays in pending or streaming until the stale cleanup marks it failed.
3. Error handling
A failing request takes the same UPDATE path with state = 'failed', a status code, an error_message and an error_kind. The message is capped at 10,000 characters at the point of writing, so no code path can slip a longer one past it, and it is passed through the content fence first (see Error message limits).
SSE Events
Request lifecycle events are published to the event bus:
| Event Type | Severity | When | Metadata |
|---|---|---|---|
request.started |
info |
Once the model name is known, just after the initial INSERT | request_id, model_id, streaming, state, owner_user_id |
request.streaming |
info |
Once a provider is chosen and the upstream stream starts forwarding | request_id, model_id, provider_name, state, owner_user_id |
request.completed |
success |
On successful completion | request_id, model_id, provider_name, state, status_code, owner_user_id |
request.completed |
warning |
On failure | Same fields; the error text is in the event's message, truncated to 200 characters |
request.streaming exists because a live dashboard row knows only the requested model until a provider is committed to; the event tells the dashboard to refetch the row and swap "Resolving" for the real provider mid-stream.
Log Retention and Purge
Automatic Retention
The log_retention setting controls how long logs are kept. When set, a background goroutine runs hourly and deletes rows older than the retention period from both request_logs and app_logs.
Dollar budgets are summed straight from request_logs, so the sweep never deletes a row an open budget period still counts: request_logs keep every row back to the earliest start among the budget periods any virtual key or user currently runs, even when that reaches past the retention window (app_logs follow the window alone). A sweep that cannot read the budget periods leaves request_logs untouched until the next hourly sweep.
Accepted values: any Go duration string (24h, 48h, 168h0m0s, ...); the dashboard slider covers 0 to 30 days in whole-day steps and stores the value in hours. The legacy tokens 1d, 1w, and 1m are still accepted, where 1m means 30 days, not one minute; for a minute-scale window write 60m or 1h. Set to 0 (or any zero duration) or leave empty to disable automatic cleanup. A value that cannot be parsed is skipped and warned about once, not once per hour.
This setting can be changed at runtime via the Settings API (PUT /api/settings).
Stale Request Cleanup
The stale_request_timeout setting (default: 30m) controls how long a request can remain in pending or streaming state before being marked as failed with error_kind = 'internal' and the error "request interrupted (stale)".
Cleanup runs every 5 minutes and applies two strategies in a single pass:
-
Server-start-time check: Any in-progress row that predates the current server process is definitively orphaned (the previous process is dead). This has zero false-positive risk.
-
Age-based check: Rows older than
stale_request_timeoutare marked failed. This catches in-process orphans (e.g. a panic skips the final update). The timeout is generous to avoid killing legitimate long-running streaming requests.
Accepted values: any Go duration; the dashboard slider covers 0 to 120 minutes in 5-minute steps. A value of 0 disables the whole periodic pass, including the server-start-time check, not just the age-based half.
Independently of that setting, the server runs one cleanup at startup, marking any in-progress row that predates the current process as failed with error_kind = 'internal' and the error "request interrupted (server restart)".
Neither sweep touches status_code. A row still at pending keeps its empty status; a row already in streaming keeps the interim status it was given (typically 200).
Manual Purge
API endpoints: DELETE /api/logs/purge (request logs, admin only) and DELETE /api/logs/app (application logs).
Request body:
{
  "older_than": "1h"
}
Accepted values: 1h, 1d, 1w, 1m, all. For DELETE /api/logs/app the body is optional; an empty body clears everything.
DELETE /api/logs/app purges in a fixed order: it first drains the asynchronous app-log writer, so entries already queued cannot flush back in behind the delete; then it deletes the rows; then it clears the in-memory ring buffer. A delete the database refuses answers 500 and leaves the ring buffer intact, so the live view still matches the rows that are still there. The reported deleted count is the number of database rows removed, or the number of ring entries cleared when no database is configured, never the two added together. A ranged purge matches rows on their insert time and ring entries on the entry's own timestamp, so at the cutoff itself the two can disagree by the writer's flush lag.
If that first drain does not finish, DELETE /api/logs/app answers 503 Service Unavailable and nothing is deleted: no rows, no ring entries, no count. A healthy writer clears its queue in milliseconds however busy the gateway is, so a 503 means the writer is stalled behind an unreachable database or the process is shutting down; retry once the log history is moving again. The same answer covers a writer that is shutting down, since its queue is still draining into the database, and one that has already stopped: the stopped writer stays in place for the rest of the process lifetime, so a purge arriving after shutdown is refused rather than run against a queue nothing can confirm was drained. Retry once the database is healthy again, or after the process has restarted: a writer stalled behind a slow database recovers on its own and the next purge succeeds, but a stopped writer never resumes, so every purge for the rest of that process's lifetime answers 503.
Response for DELETE /api/logs/purge: 204 No Content on success. DELETE /api/logs/app answers 200 OK with {"deleted": N}.
Viewing Logs
The dashboard has two log views, accessible from the Logs sidebar entry with sub-mode toggling.
Requests Log
API endpoints: GET /api/logs (page/offset), GET /api/logs/cursor (keyset scrolling), GET /api/logs/{id} (one row, including its attempt trail).
Shows all proxy requests with:
- Sortable columns (timestamp, model, provider, status, latency, TTFT, tokens, etc.)
- Filters (date range, model, provider, status code, endpoint type, virtual key, client IP)
- Pagination (default 20 per page, max 200)
- In-flight request highlighting (rows pulse with animation while streaming)
- Click-through to provider/model details
- Status code color coding (green for 2xx, red for 4xx/5xx)
Visibility is scoped by identity. An admin sees every row and may narrow the view with ?owner_user_id=. A non-admin sees only traffic from virtual keys they own, plus keyless dashboard rows stamped with their own user id; the scope is applied server-side to the listing, the count and the single-row fetch alike, so a row they do not own answers 404 rather than revealing that it exists. Rows with neither a key owner nor a stamped owner stay admin-only.
Spend
Every row carries a cost_usd column (see the schema above), filled on terminal rows from the serving model's per-token prices at the time the row was written, applied to the usage the provider reported or, when it reported none, to the estimate from the delivered bytes that charges the token limits (the token columns keep the provider's figures). Three places read it:
- The Requests table and detail modal. A
Costcolumn on the row and aCostitem in the detail grid,$0.000093for a small request.sort_by=costorders the listing by it. A row with no price shows a dash in the table and "Unpriced" in the modal: the request never reached a provider, or the model it was served by has no known input or output price (or, for a rerank row, no search price). A rerank row also shows the search units it was billed for. - The Dashboard. The header toggles between tokens, requests and dollars (
T/R/$). In the$state the spend tile sums the period, the spend chart plots it, and the provider, model and virtual-key panels show dollars instead of tokens. Hovering the spend tile says how many served requests went unpriced in the period, since those meter at zero and the total is a floor when the count is not. - Budgets. A virtual key or a user account can carry a dollar budget per calendar period; the proxy sums these rows for it and refuses with
429once the period's spend reaches the cap. See Dollar Budgets.

Prices come from the models.dev catalog or a per-model override (see Model-Discovery); a price edited later leaves history alone, so a row's cost is what it cost then.
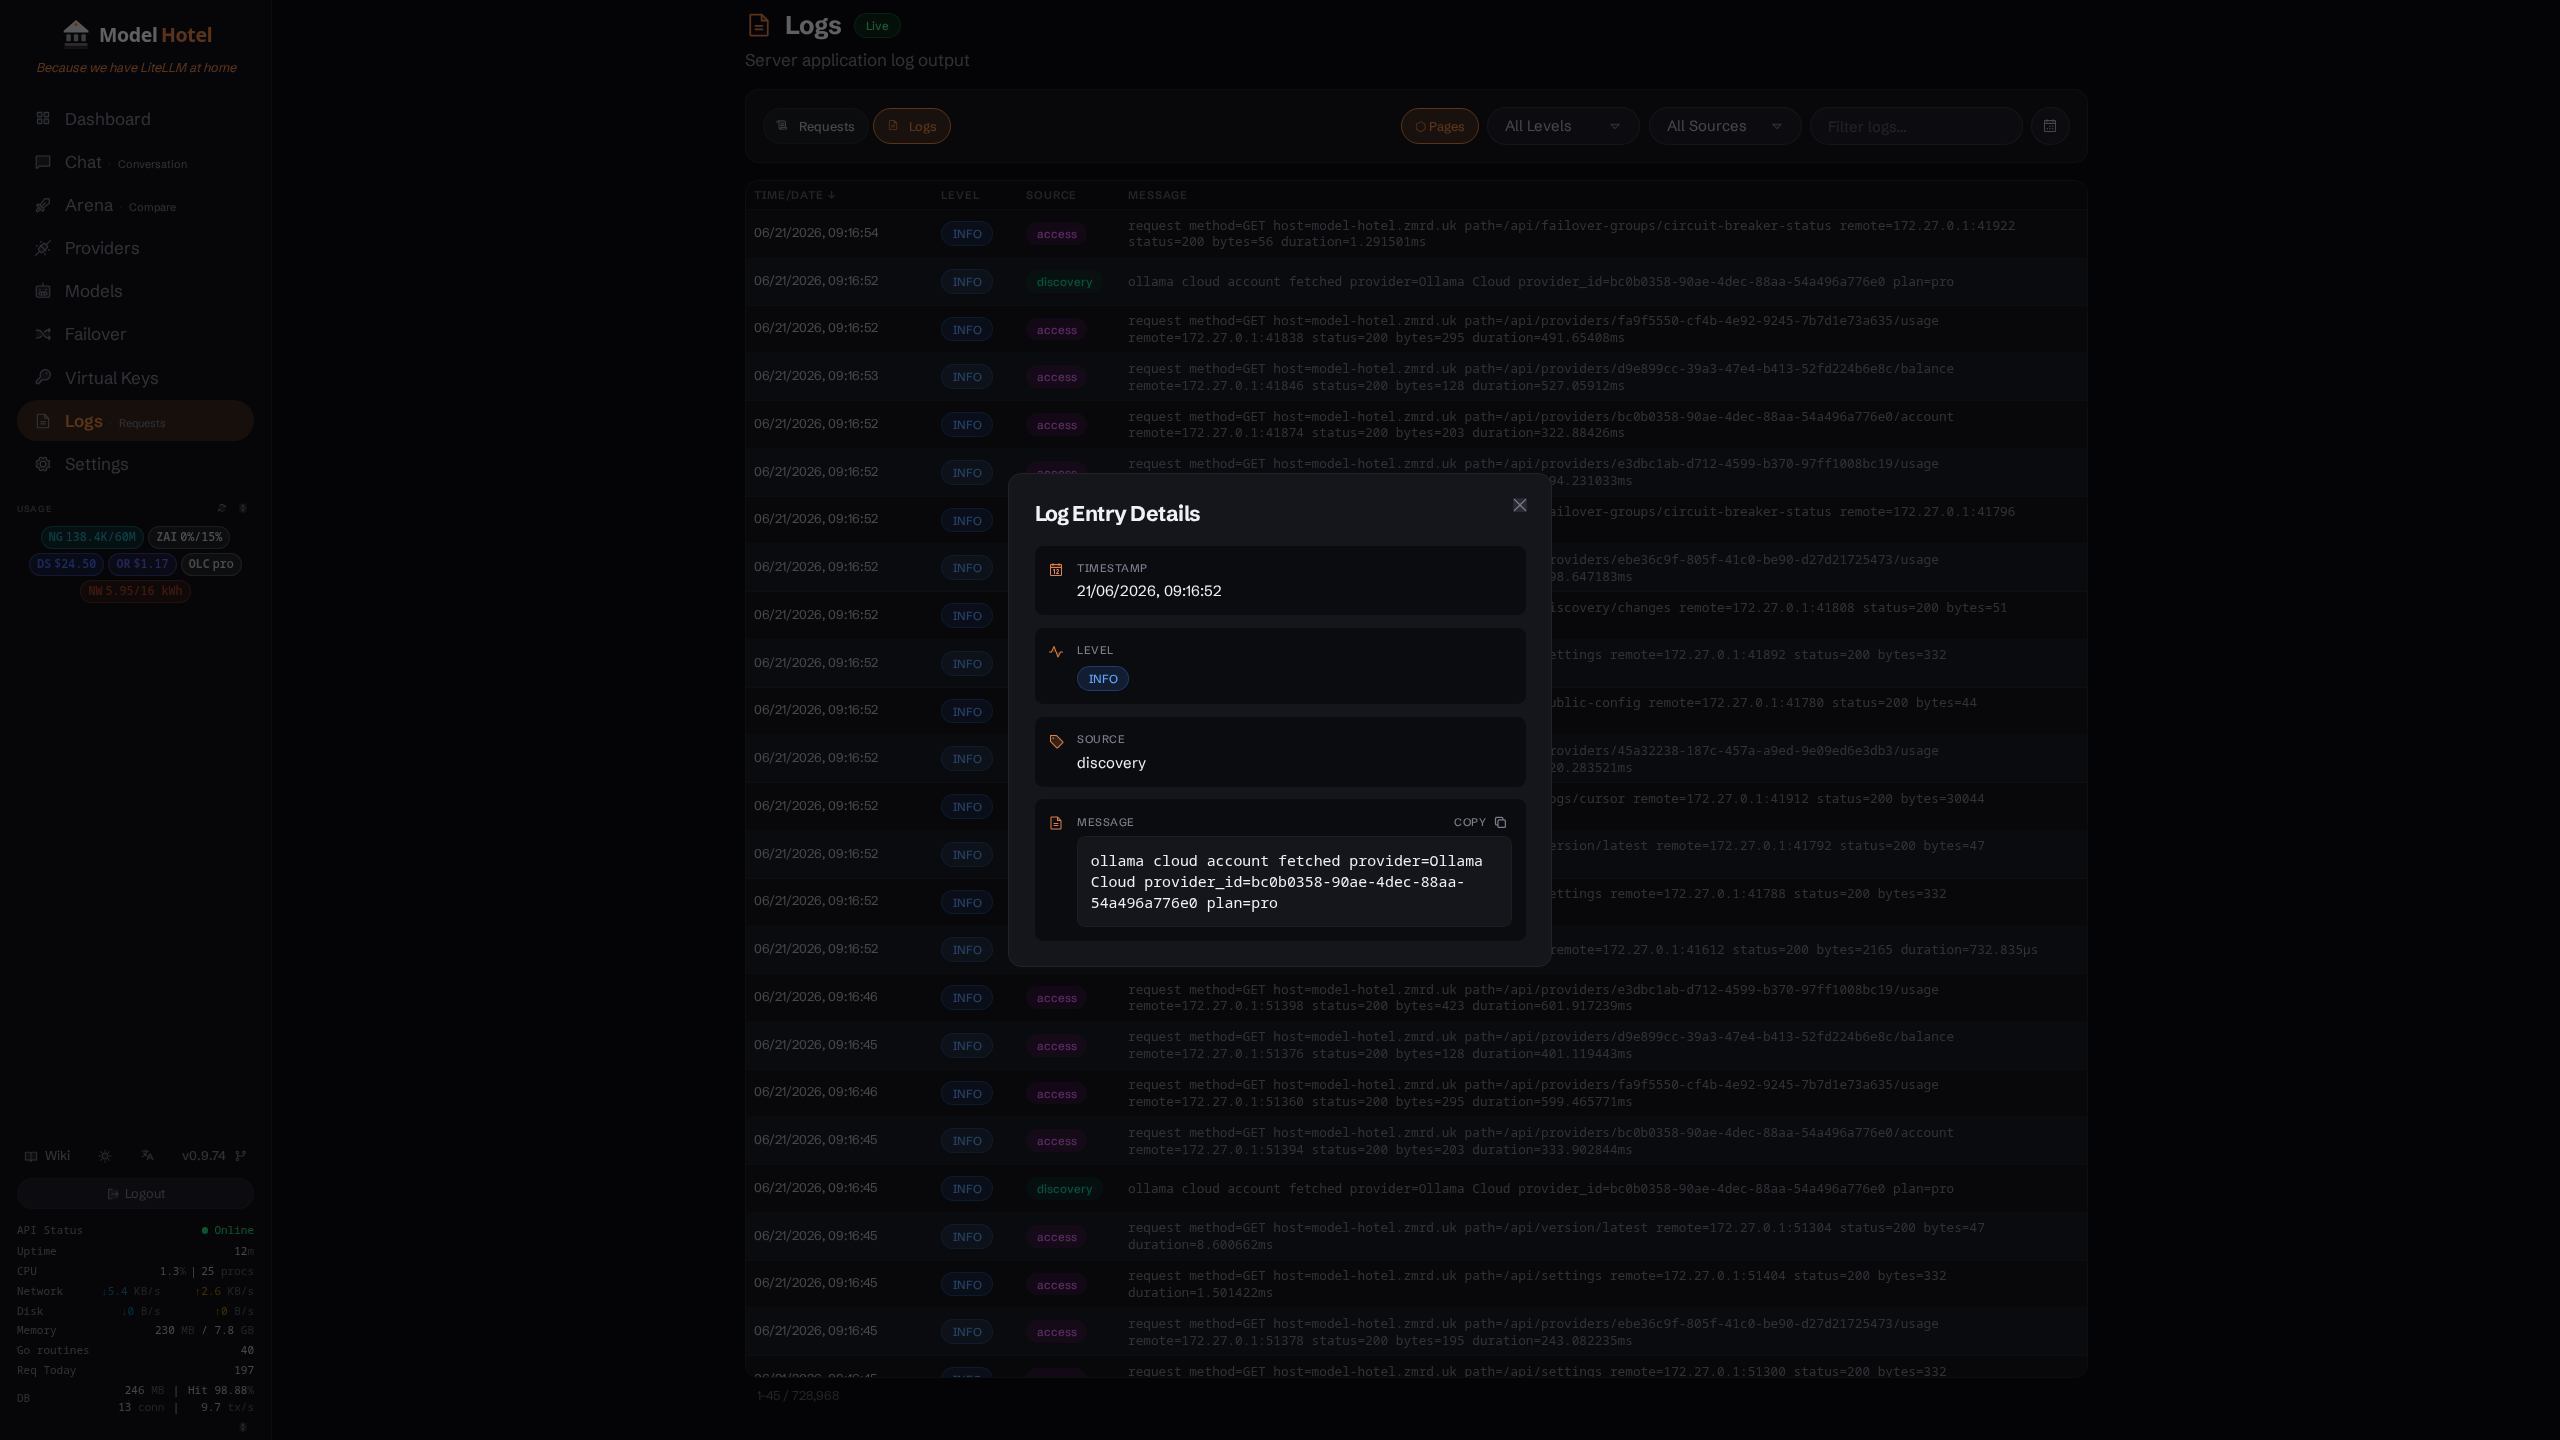
App Logs
API endpoints: GET /api/logs/app (ring buffer or history), GET /api/logs/app/cursor (keyset scrolling), DELETE /api/logs/app (purge).
Shows the server's own application logs:
- Persisted to the
app_logsdatabase table - Async batch writer for performance (buffers writes, flushes every 500ms or every 50 entries)
- Severity levels (
info,warning,error,debug) - taken from the slog record where one exists, otherwise inferred from the line's wording - Source attribution: the prefix before the first
": "in the message (proxy: forwarding ...has sourceproxy), or a leading[bracketed]tag on lines that use one - Two access modes:
- Ring buffer mode (default) - returns the last N entries from an in-memory buffer of 500 (
?limit=defaults to 500, maximum 1000), with optional?after=polling for live updates - History mode (
?history=true) - queries the database with full filtering, pagination, and sorting
- Ring buffer mode (default) - returns the last N entries from an in-memory buffer of 500 (
Application logs are also what the optional OTLP exporter ships when OTEL_EXPORTER_OTLP_ENDPOINT is set. Request logs are not exported that way; they stay in request_logs and are read through the Logs API and the Prometheus metrics.
Debug verbosity (DEBUG_LOG / DEBUG_LOG_SCOPES)
By default the server logs at Info and above. To get the per-request Debug mechanics:
DEBUG_LOG=trueturns Debug on for every scope. Thorough, but it floods both stdout and this App Logs view at any real request rate.DEBUG_LOG_SCOPES=failover,resolveturns Debug on for only the named scopes - far more usable in production. It is ignored whenDEBUG_LOG=true.
A scope is the source prefix before the first : in a log line (matched
case-insensitively). The scopes that actually emit Debug records are:
access, admin, admin-chat, adminauth, anthropic, api, audit,
backup, configsync, db, discovery, failover, frontdesk,
metrics, models.dev, paramrewrite, phrases, provider, prune,
proxy, quota, resolve, responses.
proxy is by far the most voluminous (the per-request mechanics), followed by
frontdesk, discovery and resolve; the rest are a handful of lines each.
api and adminauth are near-silent: their only Debug records come from the
shared JSON response writer, when a client hangs up or a handler times out
mid-response.
Both variables are startup-only (env vars, set via .env / compose). See
Configuration for the full table.
A source is not the same thing as a scope. These variables gate Debug
records only, so naming a source that emits none does nothing at all. Most App
Logs sources are in that position - ratelimit, settings,
webauthn, auth, model, virtual-keys, keycache, docker, stats,
system, applogs, events and version all log at Info and above only, as
does netguard (the outbound connection guard behind SSO and alerting, see
Security), which logs at WARN
and above. Their lines appear in App Logs and in its source filter and are always
emitted; there is nothing to enable. The list above is the whole of what
DEBUG_LOG_SCOPES can act on.
App Logs Schema
| Column | Type | Description |
|---|---|---|
id |
UUID PK | Auto-generated |
timestamp |
TIMESTAMPTZ NOT NULL | When the log was emitted |
level |
TEXT NOT NULL | Severity: info, warning, error, debug |
source |
TEXT NOT NULL | Package/module that emitted the log |
message |
TEXT NOT NULL | Log message content |
escaped |
BOOLEAN NOT NULL | Whether the message uses the structured-attribute escaping the dashboard decodes (migration 075). FALSE on legacy and raw lines, which render verbatim. |
attrs_at |
INTEGER NOT NULL | Offset in message where the encoded attribute suffix begins, in UTF-16 code units (migration 076). Meaningful only when escaped is TRUE, so raw message text is never rewritten. |
created_at |
TIMESTAMPTZ NOT NULL | DB insertion timestamp (default now()) |
Filtering and Search
Request Logs (GET /api/logs)
| Parameter | Description |
|---|---|
page |
Page number (default 1) |
per_page |
Results per page (1–200, default 20) |
model_id |
Filter by model ID (ILIKE match) |
provider_id |
Filter by provider UUID |
virtual_key_id |
Filter by virtual key UUID |
client_ip |
Filter by exact client address |
owner_user_id |
Admin only: restrict to one dashboard user's traffic. Ignored for non-admins, whose own scope is already forced. |
status_code |
Filter by HTTP status. Accepts exact codes, 4xx, 5xx, or 0 for in-progress/never-responded |
endpoint_type |
Filter by endpoint family: chat, messages, embeddings, rerank, image, tts, stt (unknown values are ignored) |
attempt_provider_id |
Filter on the attempt trail: requests in which this provider was tried at all, whoever served them in the end |
attempt_status |
Filter on the attempt trail: requests in which some attempt reached this upstream status |
from |
Start timestamp (RFC3339) |
to |
End timestamp (RFC3339) |
sort_by |
Sort column: time, model, provider, status, tokens, tps, ttft, response_header_ms, duration, overhead, key, ip |
sort_dir |
asc or desc (default desc) |
attempt_provider_id and attempt_status combine into a single containment test, so giving both matches requests where one attempt had that provider and that status, not two separate attempts. Unparseable values are ignored rather than rejected, as with the other filters.
GET /api/logs/cursor takes the same filters plus cursor, direction (after/before) and limit (1–200, default 20). It always sorts by time, so sort_by does not apply there.
Special sorting behavior:
provider: NULL providers sort last, deleted providers (name NULL but ID present) sort second-to-lasttokens: rows with no tokens at all sort after rows with tokens; among those, ones whose error mentions cancel/disconnect/context-canceled come before the reststatus: within the same status code, errors with cancel/disconnect/context-canceled messages sort after other errorskey: Deleted virtual keys (ID present but no matching row) sort lasttps,ttft,response_header_ms,duration,overhead: zero values sort lastip: rows with no address sort last; addresses order lexicographically, which groups the same address together but puts10.*before9.*
App Logs (history mode: GET /api/logs/app?history=true)
| Parameter | Description |
|---|---|
level |
Filter by severity: info, warning, error, debug |
source |
Filter by log source (e.g. proxy, auth, discovery) |
search |
Text search in message (ILIKE match) |
from |
Start timestamp (RFC3339) |
to |
End timestamp (RFC3339) |
page |
Page number (default 1) |
per_page |
Results per page (1–100, default 20) |
sort_by |
Sort column: time, level, source, message |
sort_dir |
asc or desc (default desc) |
History mode returns a structured response including entries, total, page, per_page, plus level_counts and source_counts aggregates (cached for 5 seconds).
How Model Name, Provider, and Token Counts Are Captured
Model Name
model_id is the model field of the request body, exactly as the client sent it. For failover group requests (hotel/xxx) that display name is what is logged; the provider-specific model that actually served the request goes to resolved_model_id.
Provider Resolution
provider_id is written once the proxy commits to a candidate and the upstream connection is established. Deleting a provider sets the column back to NULL (migration 010), so those rows show no provider at all rather than a dangling id; the Logs API's 'Deleted' label is for the rarer case of a provider_id that no longer matches any provider row.
Token Counts
Token counts come from the provider's own usage object, never from counting anything locally.
- Non-streaming: read straight out of the parsed upstream response.
- Streaming: accumulated as SSE chunks arrive. Some providers send usage only in the final chunk, others in every chunk, so the proxy keeps the last non-zero value it saw.
- Large passthrough responses: embeddings, image and audio responses over 8 MiB stream through without usage extraction, because buffering them would defeat the point. The row then records no token counts, but the request is still metered against the key's usage and TPM budget using an estimate of the prompt, so an oversized response is not a free one. The estimate never appears in the log as measured usage.
DeepSeek Cache Tokens
DeepSeek providers may report prompt_cache_hit_tokens and prompt_cache_miss_tokens in the usage object. These are captured, written to the tokens_prompt_cache_hit and tokens_prompt_cache_miss columns, and exposed in the Logs API response.
Error Logging for Failed Requests
Error classification and status codes
Most failed requests are tagged with a machine-readable error_kind, defined in internal/proxy/reqerror.go. The persisted status_code is not a fixed function of error_kind: it depends on where the request failed, as described under Status code and error kind over a request's life.
error_kind |
Status code | When | Example error_message |
|---|---|---|---|
validation |
400 / 404 | Malformed body, missing model, invalid model format (400); unknown model / no enabled providers (404) | "invalid request body", "model 'xxx' not found" |
auth |
403 | Virtual key lacks access to any provider for the model | "virtual key does not have access to any provider for this model" |
provider_error |
upstream status, else 502 | Any upstream failure not placed more precisely, including every 5xx and an aggregator's own backend fault. Also the kind for a stream that ended without its [DONE] sentinel. |
"all 3 providers failed; last error: provider \"X\" returned HTTP 500 on attempt 2" |
provider_model_gone |
upstream status | The provider says it no longer serves this model. Permanent: retire it or stop routing to it. | "provider \"X\" no longer serves this model (attempt 1)" |
provider_not_entitled |
upstream status (402, or a 429) | The account cannot pay for the model: empty balance, or a model outside the subscription. Retrying cannot help until someone tops up or changes plan. | "provider \"X\" rejected the request for billing or plan reasons on attempt 1" |
provider_bad_request |
upstream 400 | The provider understood the request and refused the payload, normally the wrong dialect for that upstream route rather than a provider fault | "provider \"X\" rejected the request payload on attempt 1" |
provider_saturated |
429 | Alive and refusing on capacity (concurrency slots, RPM, TPM). Retry in seconds. | "all 3 providers busy; last error: provider \"X\" is busy (rate limited at capacity) on attempt 3" |
provider_quota_exhausted |
429 | A usage window is spent (session, daily, weekly, or a coding-plan window). Retry after the window resets. | "no available provider for hotel/glm-4.6; earliest retry in 45s" |
provider_timeout |
502 | TTFT probe, stall watchdog or the upstream header timeout fired: provider connected but produced no headers or output in time | "provider \"X\" did not return a response in time on attempt 1" |
failover_timeout |
504 | The overall failover deadline expired | "request timed out while waiting on provider \"X\"" |
retry_timeout |
504 | The param-strip retry's deadline expired | "retry without unsupported parameters timed out on provider \"X\"" |
client_disconnect |
499 | The calling client hung up before we responded | "client disconnected during attempt 1 to provider \"X\"" |
hedge_superseded |
502 | The gateway cancelled this attempt because a faster hedged candidate won the race. The client is unaffected and is served by the winner, so this never appears as a terminal cause on its own. | "attempt 2 to provider \"X\" was superseded by a faster hedged attempt" |
internal |
502 | Gateway-internal failure (e.g. could not build the upstream request). Also written by both stale sweeps. | "internal error on attempt 1: …", "request interrupted (stale)" |
The 429 on the two capacity kinds is deliberate: every provider is alive, and OpenAI SDKs back off and retry on a 429 where they would give up on a 502. A Retry-After header carries the last provider's own ask, or the earliest instant a circuit reopens, capped at a minute. Turning the failover_exhaustion_status_429 setting off restores the older 502 for both.
Error message limits
Two different limits apply, for two different consumers:
- In the database,
error_messageis capped at 10,000 characters, cut on a character boundary and marked with…. An upstream error body is sanitized to the same budget before it gets there. Both then pass through the content fence: an upstream fragment sharing a run of 16 or more characters with the request's own text (a provider quoting the prompt back) is dropped whole rather than partly blanked, leaving the fixed phraseprovider error text withheldinerror_messageand an empty per-attemptdetail. The gateway's own wording around it, such as theall N providers failed; last error:wrapper, is never fenced and always survives. - In SSE events, the
request.completedmessage is truncated to 200 characters with a…suffix, because it is a notification, not a record.
What the client receives is a third thing, and depends on the error class. A payload-class 4xx (a plain 400 and its kin, not 401/402/403/404/407/429) forwards the provider's own error body with every provider key the gateway holds masked out (any row's key, enabled or not, not only the one being called), read under a 1 MiB cap. Anything else, meaning auth, billing, rate-limit, not-found and server-fault classes, or a body over the cap, gets a synthesized OpenAI-style envelope carrying the classified reason, because those upstream bodies can quote the operator's provider credentials or account details.
Client Disconnect Handling
A client hanging up is detected through context cancellation on the request. The row is finished with state = 'failed', error_kind = 'client_disconnect' and status 499, which distinguishes it from a provider failure: nothing upstream went wrong, and the circuit breaker is not charged for it.
Database Migrations History
The request_logs table has evolved through these migrations:
| Migration | Changes |
|---|---|
001_init.sql |
Initial schema: id, provider_id, model_id, status_code, latency_ms, tokens_prompt, tokens_completion, streaming, error_message, created_at |
006_enhanced_logs.sql |
Added: request_hash, ttft_ms, proxy_overhead_ms, duration_ms, tokens_per_second, virtual_key_name, prompt (never used) |
007_overhead_breakdown.sql |
Added: parse_ms, model_lookup_ms, provider_lookup_ms, key_decrypt_ms |
008_timing_precision.sql |
Converted timing columns from INT to REAL for sub-ms precision |
010_provider_delete_cascade.sql |
Changed the provider_id foreign key to ON DELETE SET NULL, so deleting a provider no longer blocks on its log history |
011_failover_attempt.sql |
Added: failover_attempt |
012_add_virtual_key_id_to_request_logs.sql |
Added: virtual_key_id |
013_backfill_virtual_key_id.sql |
Backfilled virtual_key_id for existing logs with matching virtual_key_name |
017_deepseek_pricing.sql |
Added: tokens_prompt_cache_hit, tokens_prompt_cache_miss (NOT NULL, default 0) |
020_log_state_column.sql |
Added: state with default 'pending', backfilled existing rows |
024_cleanup_stale_logs.sql |
One-time cleanup of rows stuck in pending/streaming state |
027_drop_unused_prompt_column.sql |
Dropped prompt column (never written to) |
028_add_timing_columns.sql |
Added: safe_dial_ms, settings_read_ms (DOUBLE PRECISION) |
030_drop_request_id.sql |
Dropped request_id column (never populated) |
031_reasoning_tokens.sql |
Added: tokens_completion_reasoning (the reasoning share of completion, reported as a breakdown) |
032_rename_dial_add_failover_lookup.sql |
Renamed safe_dial_ms → dial_ms (now full DNS+TCP dial); added failover_lookup_ms |
035_rename_ttft_to_response_header_ms.sql |
Renamed old ttft_ms → response_header_ms (it measured time-to-headers); added new true ttft_ms |
036_resolved_model_id.sql |
Added: resolved_model_id (actual model that served a hotel/ request) |
042_cache_hits.sql |
Added: cache_hits JSONB (per-component cache hit/miss flags) |
043_endpoint_type.sql |
Added: endpoint_type with default 'chat' (multimodal proxy endpoints: embeddings, image, tts, stt) |
045_error_kind.sql |
Added: error_kind (nullable machine-readable failure classification; no backfill) |
067_request_log_owner.sql |
Added: owner_user_id (attribution for keyless dashboard rows) + a partial index on it |
073_request_log_client_ip.sql |
Added: client_ip (trusted-proxy-resolved client address; no backfill) |
074_request_log_vk_index.sql |
Added a partial index on virtual_key_id for the Logs page's virtual-key filter |
078_request_log_attempts.sql |
Added: attempts JSONB (per-attempt trail) + a GIN index serving the attempt_provider_id / attempt_status filters; no backfill |
085_request_log_cost.sql |
Added: cost_usd; backfilled existing rows at their serving model's current prices (an estimate, since older prices are not kept) |
086_request_log_cost_reasoning.sql |
Repriced rows with reasoning tokens at current prices (085 and the first proxy build charged reasoning on top of completion, which already contains it); a reasoning row whose model is gone or unpriced becomes NULL, and rows not yet terminal lose their cost |
088_request_log_owner_stamp.sql |
Stamped the key's current owner into owner_user_id on keyed rows that had none (the proxy stamps keyed rows from then on, for budgets); replaced the single-column owner and virtual_key_id indexes from 067 and 074 with (owner_user_id, created_at) and (virtual_key_id, created_at) partial indexes |
091_rerank_search_price.sql |
Added: search_units (what a rerank provider billed; no backfill, older rerank rows stay unpriced) |
Implementation Details
Async INSERT with synchronous ID
The row's UUID and request hash are generated on the request goroutine, then the INSERT itself is queued. That way the later UPDATE always has an id to aim at without the client ever waiting on a database round trip, and a failed INSERT degrades to an UPDATE that touches no rows rather than to a failed request.
Waiting for the INSERT
Updates on the hot path deliberately skip the wait, because it runs before the response body reaches the client and a cold INSERT could hold that up by as much as 5 seconds. That includes the interim pending → streaming write and the terminal writes on the latency-sensitive response paths. If such an update is terminal and touches no rows, it has lost the race with its own INSERT, so it then waits and retries once: without that repair the request would stay at pending with no status, no duration and no error until a stale sweep relabelled it. Every other update waits up front. An UPDATE that errors outright has no row count to trust and is left for the stale sweep.
Log caching
The Logs API caches query results for 2 seconds to keep live polling off the database. The cache key includes the caller's owner scope, so an admin's unscoped page and a member's own page never share an entry. Responses carry X-Cache: HIT or X-Cache: MISS.
Related
- App Logs - Application log system (ring buffer + DB, documented below)
- Configuration - Runtime configuration including
log_retentionandstale_request_timeout - API Reference - SSE event system for real-time updates