DocFaqDEM - Maproom/qmapshack GitHub Wiki
Prev (WMTS Examples) | Home | Manual | Index | (OpenSource, Donation, etc) Next
Table of contents
Frequently Asked Questions - Elevation data (DEM data)
How to use DEM data in GeoTIFF or ESRI Grid ASCII format?
Elevation data (DEM data) are provided in different file formats, among them the GeoTIFF and the ESRI Grid ASCII formats.
Examples of sources for DEM data are
-
GeoTIFF:
-
ESRI Grid ASCII format: (also known as
ARC/INFO ASCII GRID)- Germany: https://gdz.bkg.bund.de/index.php/default/digitale-geodaten/digitale-gelandemodelle/digitales-gelandemodell-gitterweite-200-m-dgm200.html (UTM32s/EPSG:25832)
- Germany/Bavaria: https://www.ldbv.bayern.de/produkte/weitere/opendata.html (UTM32/EPSG:25832)
- Spain: http://centrodedescargas.cnig.es/CentroDescargas/catalogo.do?Serie=LIDAR
DEM data files having one of these formats can be used in QMS after building a VRT wrapper for them. QMS offers a tool for the creation of such wrappers which can be called via the main menu entry Tool - VRT builder. Section "Installing Raster Maps or DEM Data" describes details on the use of this tool and the use of the wrapper files.
Remark: ESRI Grid ASCII files do not have a reference to a coordinate reference system (CRS). This information should be found in the metadata on the file server and must be added as value of the advanced optional -a_srs parameter in the VRT builder. If there is a .prj file attached to the DEM file, then the CRS info can be found there. In the case of the above-mentioned Bavarian data source, the CRS used is UTM32 having the CRS code EPSG:25832.
DEM data files are available for relatively small areas (tiles) to keep their size relatively small. The area covered can be found with the gdalinfo tool (on Windows provided with the QMS installation package and located in the installation directory). Here is an example:
gdalinfo DGM200_UTM32_EsriGridAscii.asc.vrt
Driver: VRT/Virtual Raster
Files: DGM200_UTM32_EsriGridAscii.asc.vrt
       DGM200_UTM32_EsriGridAscii.asc
Size is 1854, 1857
Coordinate System is:
PROJCS["ETRS89 / UTM zone 32N",
    GEOGCS["ETRS89",
        DATUM["European_Terrestrial_Reference_System_1989",
            SPHEROID["GRS 1980",6378137,298.257222101,
                AUTHORITY["EPSG","7019"]],
            TOWGS84[0,0,0,0,0,0,0],
            AUTHORITY["EPSG","6258"]],
        PRIMEM["Greenwich",0,
            AUTHORITY["EPSG","8901"]],
        UNIT["degree",0.0174532925199433,
            AUTHORITY["EPSG","9122"]],
        AUTHORITY["EPSG","4258"]],
    PROJECTION["Transverse_Mercator"],
    PARAMETER["latitude_of_origin",0],
    PARAMETER["central_meridian",9],
    PARAMETER["scale_factor",0.9996],
    PARAMETER["false_easting",500000],
    PARAMETER["false_northing",0],
    UNIT["metre",1,
        AUTHORITY["EPSG","9001"]],
    AXIS["Easting",EAST],
    AXIS["Northing",NORTH],
    AUTHORITY["EPSG","25832"]]
Origin = (494800.000000000000000,5606600.000000000000000)
Pixel Size = (200.000000000000000,-200.000000000000000)
Corner Coordinates:
Upper Left  (  494800.000, 5606600.000) (  8d55'35.42"E, 50d36'40.55"N)
Lower Left  (  494800.000, 5235200.000) (  8d55'52.52"E, 47d16'12.93"N)
Upper Right (  865600.000, 5606600.000) ( 14d 9'21.70"E, 50d29'49.19"N)
Lower Right (  865600.000, 5235200.000) ( 13d49'28.32"E, 47d10' 6.91"N)
Center      (  680200.000, 5420900.000) ( 11d27'34.53"E, 48d54'53.26"N)
Band 1 Block=128x128 Type=Float32, ColorInterp=Undefined
  NoData Value=-9999
Here, the coordinate system information is only available after the use of the additional parameter -a_srs: EPSG:25832!
The lines following the Corner coordinates marker in the output show the area coordinates.
The pixel size shown is measured in coordinate system units (here: in meters). It describes the precision of the DEM data in the file.
Warning: Sometimes DEM data are offered for bigger areas (whole countries). When using an ASCII file format (ESRI Grid ASCII or XYZ format, too) this may result in very big files and, as a consequence, in considerable degradation of QMS performance.
Why are there data gaps between adjacent DEM tiles?
(inspired by German newsgroup discussion)
In QMS, DEM tiles are called up via VRT files. Each VRT file contains a new virtual DEM tile built from one or more DEM tile files.
Data gaps between DEM tiles can occur if a separate VRT file is used for each tile. These gaps do not occur if adjacent tiles are combined into a single VRT file and thus into a single larger virtual tile.
Tiles belong to a certain area, which can be found, e.g., with gdalinfo.exe (included in the QMS directory under Windows). The areas belonging to neighboring tiles fit together seamlessly.
Assume that a VRT file is used for only one tile: This tile is divided into smaller rectangles/squares by a certain number of horizontal and vertical lines (corresponding to the data accuracy). Elevation data are and will only be provided for the center points (grid points) of these squares in the DEM file. If one creates the convex hull of these center points, one obtains a new and smaller area. Elevation values can only be calculated by interpolation in this area. So there remains a narrow border (for 3" accuracy in the width of 1.5") for which no elevation data are available when using a single tile, i.e., elevation data are not available seamlessly.
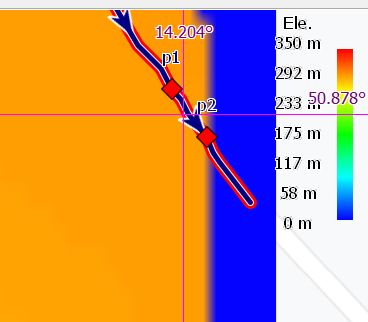
Here is an example of this situation in QMS obtained by using elevation shading:

The colored area is part of a DEM tile. The small blue strip at the right edge of this area is outside of the convex hull of the grid points. Here, elevation data can't be found by interpolation. QMS inserts elevation 0 as default value.
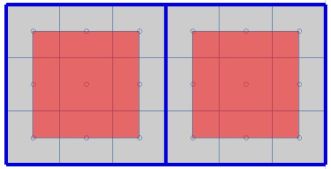
The following figure illustrates the described situation in a more formal way for 2 adjacent tiles.

Elevation data is available in the red areas. In the grey-shaded strips elevation data is not available. The width of this strip is determined by the grid size of the tile.
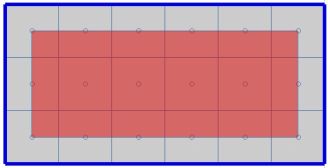
If, on the other hand, one uses a single VRT file that contains several DEM tiles, i.e., combines them into a larger one, the procedure just described is used for the larger virtual tile and not for the individual parts. The areas without elevation values are only the outer edges of this virtual tile.

Thus, it is recommended to create and use a single VRT file for as many related DEM tile files as possible.
Prev (WMTS Examples) | Home | Manual | Index | Top | (OpenSource, Donation, etc) Next