DocControlMapDem - Maproom/qmapshack GitHub Wiki
Prev (Maps & DEM) | Home | Manual | Index | (Sources of QMapShack-compatible maps and elevation data) Next
Table of contents
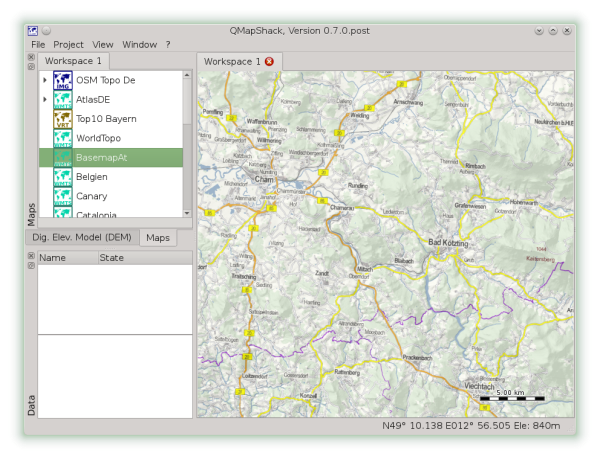
The render engine of QMapShack is quite flexible and lets you create map stacks with maps of different binary geographic datum, projection and binary format. Additionally it adds elevation information to the displayed maps if DEM data is loaded. The DEM data is completely independent from the loaded map. However the same concepts as for maps apply.
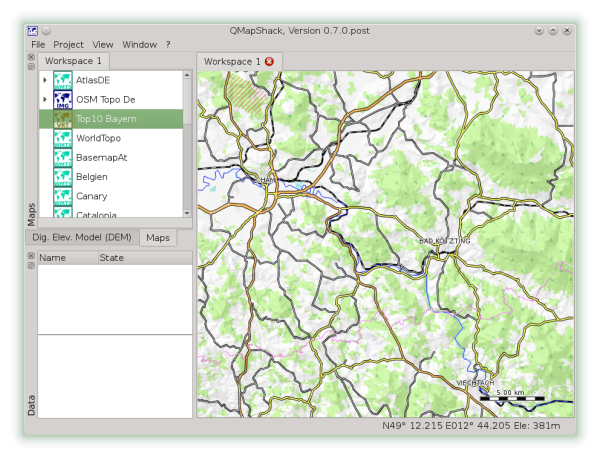
By opening additional workspaces you can have several different map stacks. This allows you to quickly view your data on different maps.
-
Maps are handled by the topmost item fist, down to the bottom item last. Thus the item at the bottom of the list will overlay all other items
-
DEM files are handled by the topmost item fist, down to the bottom item last. Doing an elevation data query the first match will stop the query. Thus the topmost item wins. Doing hillshading or similar the item at the bottom will overlay all other items.
-
The draw order can be changed by moving the item in the list via drag-n-drop.
Some properties are set globally for all workspaces. You find them below the View menu.
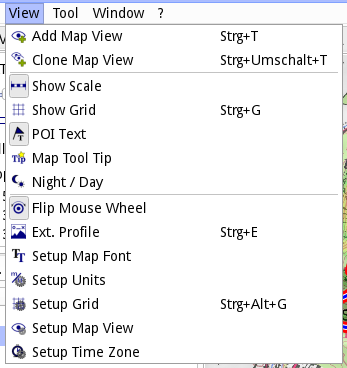
- Add Map View Add a new View to display your data over a selection of maps. Hint: The default name of a view can be edited in a configuration file.
- Clone Map View Clone the current view.
The properties for the views:
- Show Scale A scalebar will be drawn in the right bottom corner of the map.
- Show Grid A grid is drawn over the map. To setup the grid for the current visible workspace select Setup Grid
- POI Text This applies to vector maps only. If inactive labels of waypoints are not drawn in the map window.
- Map Tool Tip This applies to vector maps only. If active a tool tip with information about the element below the mouse cursor is displayed. If the map does not have any information at the position of the mouse cursor then nothing is displayed.
- Night / Day This applies to vector maps only. Switch between night and day color scheme. This must be defined within the map, else nothing will happen.
Not really map related but workspace related:
- Flip Mouse Wheel This will change the zoom in and zoom out direction.
- Ext. Profile Switch on the extended profile view in an own window.
- Setup Map Font This will change the font used for any text drawn on the map.
- Setup Units Change the unit system to metric, imperial, nautical, or aviation.
- Setup Grid Setup the projection of the grid overlay.
- Setup Map Workspace Setup the projection of the current workspace. The default is Mercator/WGS84.
- Setup Time Zone Setup the current timezone or automatic time zone selection.
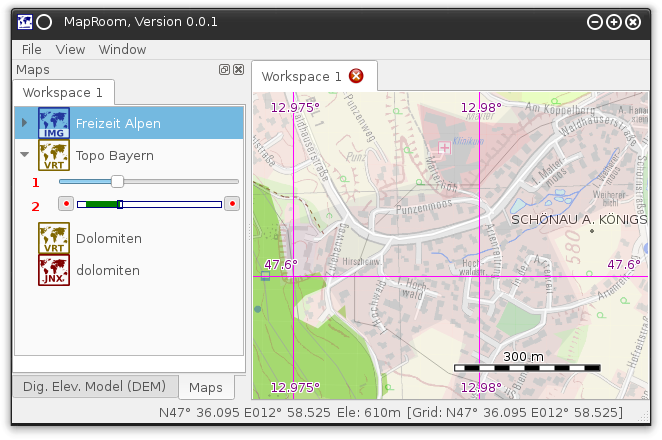
If you expand a map or DEM item you can see the property setup of this item for the current workspace.
-
The slider on the top controls the opacity.
-
With the bar and the two buttons you can control the range of scale the map is visible. The blue square on the bar indicates the actual scale. Zoom to the minimum scale you want to see the map and press the left button. Now zoom to the maximum scale to display the map and press the right button. The green bar will indicate the range of visibility now.
Vector maps have additional properties.
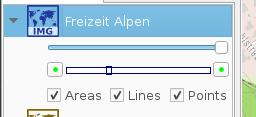
Use the checkboxes to control what major map elements are displayed. For example you can overlay your raster map with a vector map and display the points of interest only, to add more information to your map.
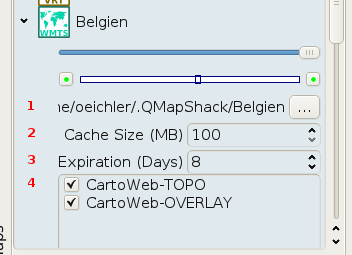
- The path to the tile cache. Each map has it's own path. The default is "<home_dir>/.QMapShack/<map_file_name>"
- The maximum tile cache size.
- The maximum age of the tiles in the cache
- If the map has more than one layer you can enable/disable the layers
DEM Files have additional properties.
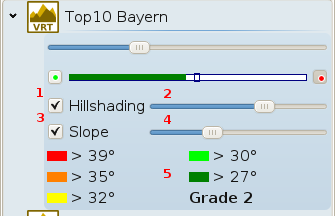
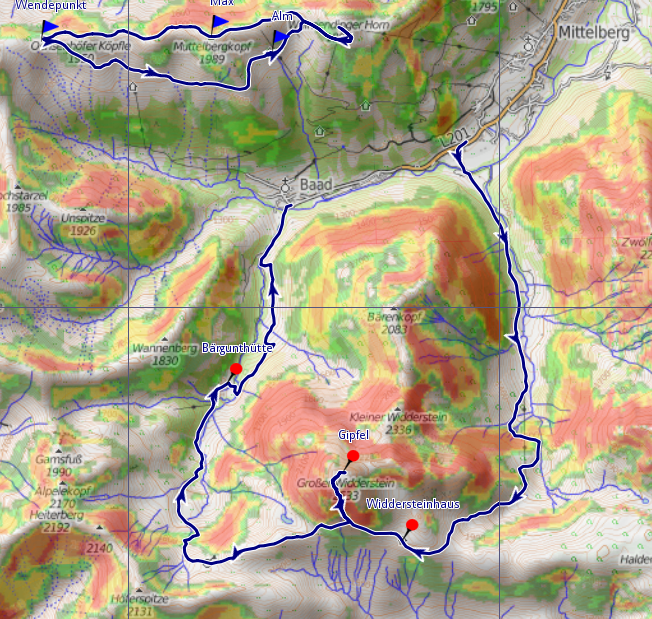
Hillshading (1) will overlay the map with a gray shaded relief. You can fine tune the contrast of the hillshading with the slider (2). Slope (3) will overlay the map with a color pattern for certain ranges of slopes. The pattern reflects the ranges defined by the so called DAV Snow Card. This is a scheme to evaluate the risk of a snow avalanche commonly used in the European Alps. It knows 4 grades of risk. Use the slider (4) to select the grade. You will see the ranges in the legend (5). As a result the map will look a bit strange:
Compare section Adjustable elevation properties for additional details.
Prev (Maps & DEM) | Home | Manual | Index | Top | (Sources of QMapShack-compatible maps and elevation data) Next