MObjects - 3dct/open_iA GitHub Wiki
Videos:
Publication: Andreas Reh, Christian Gusenbauer, Johann Kastner, Eduard Gröller, Christoph Heinzl, "MObjects - A Novel Method for the Visualization and Interactive Exploration of Defects in Industrial XCT Data", IEEE Transactions on Visualization and Computer Graphics (Proceedings of IEEE Scientific Visualization 2013), Vol. 19, No. 12, pp. 2906-2915, December 2013, doi: 10.1109/TVCG.2013.177.
Parts of the MObjects functionality described in the video and papers above is now included in the FeatureScout tool.
Quick Start User Guide
For testing purposes, we will use the pores.csv from the FeatureScout/Pores subdirectory in our open_iA 2020.09 test datasets here. See below for some notes on loading custom data.
If you are interested in the steps required to create a labeled volume with open_iA, you can refer to the Object Characteristics guide.
-
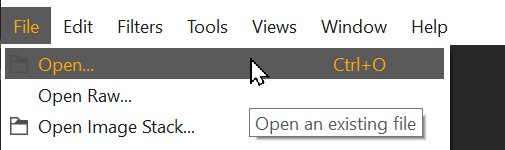
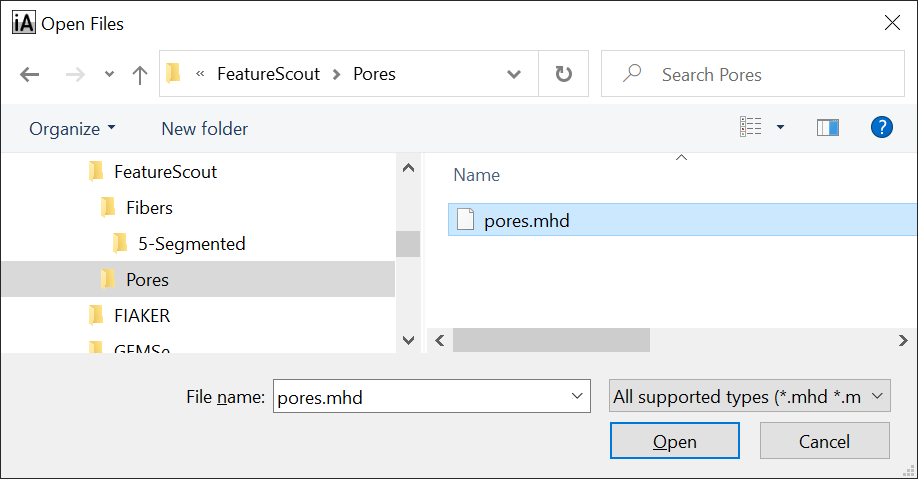
Load the labeled volume containing the (numbered) objects you want to analyze:
images/FeatureScout-MObjects-01.png
images/FeatureScout-MObjects-02.png
images/FeatureScout-MObjects-03.png
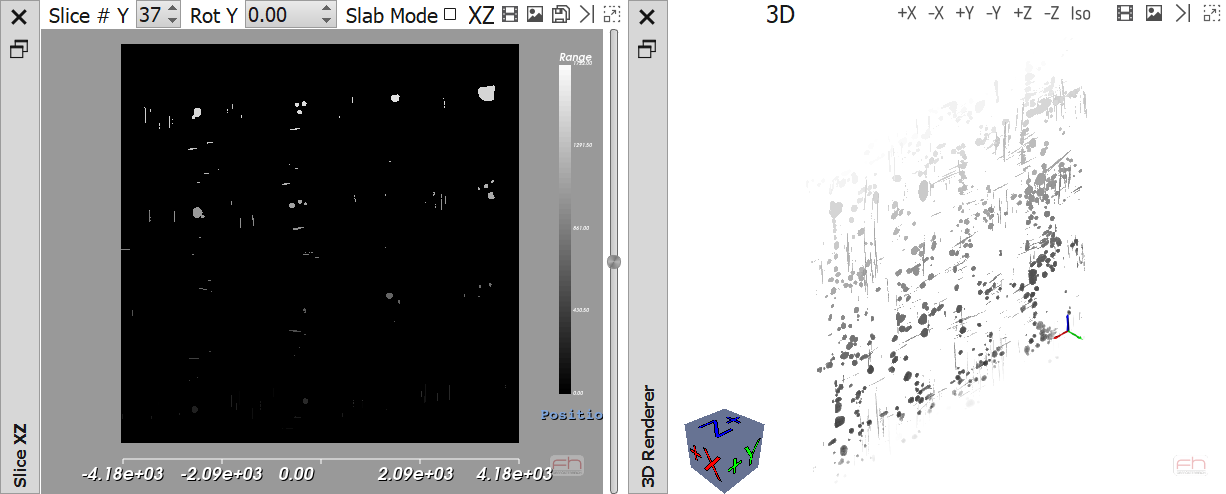
Adjust the layout to your needs (e.g., to show the 3D view), as explained in the Widgets section of Core User Guide.
-
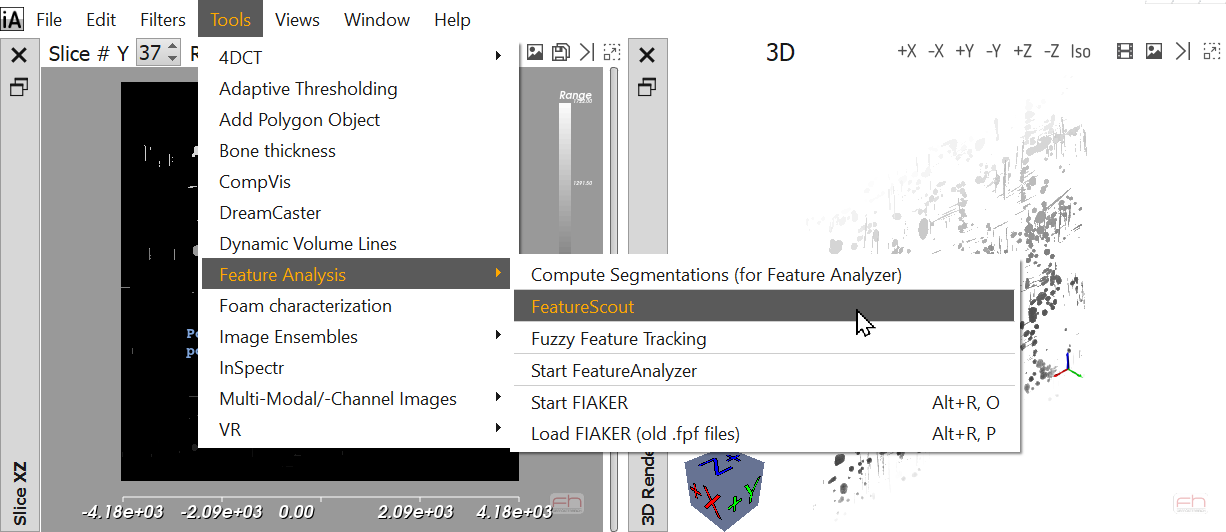
Start FeatureScout: Tools -> Feature Analysis -> FeatureScout
-
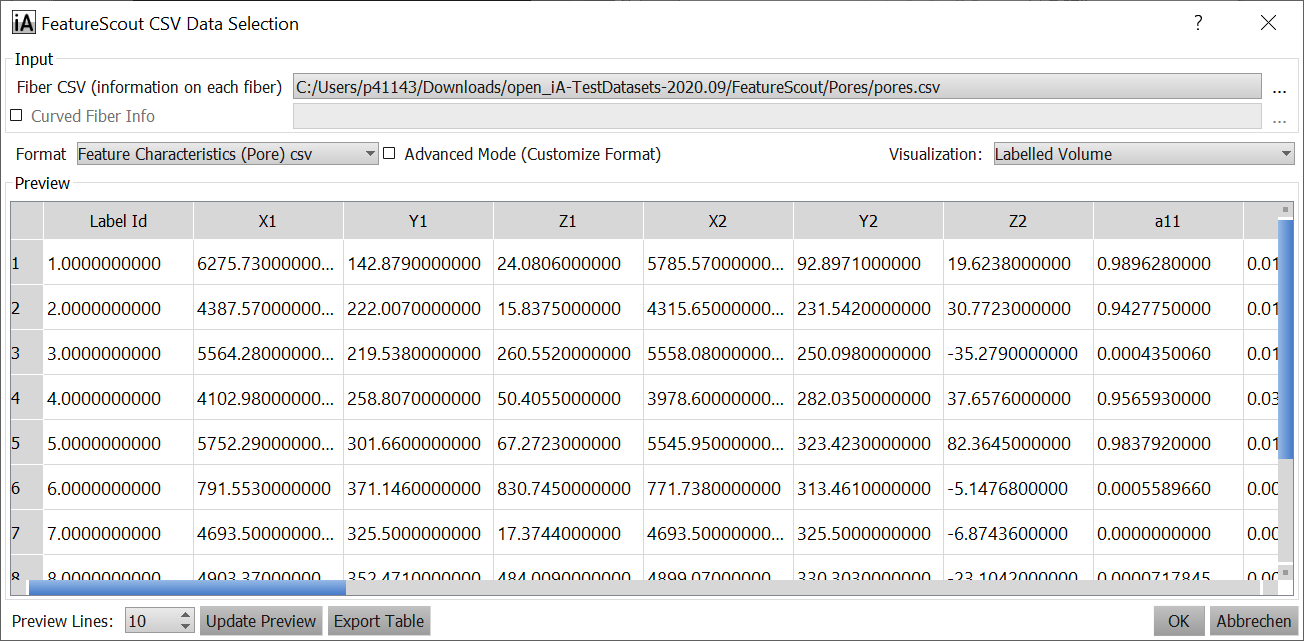
In the opening dialog, select the according .csv file (pores.csv, for our example dataset), its format ("Feature Characteristics (Pore) csv", for our example dataset), and the appropriate visualization ("Labeled Volume", for our example dataset):
images/FeatureScout-MObjects-05.png
Note: In case your .csv file is in a format that open_iA is not yet familiar with, you can define your own format via the "Advanced Mode". There is currently no documentation available describing this in detail.
-
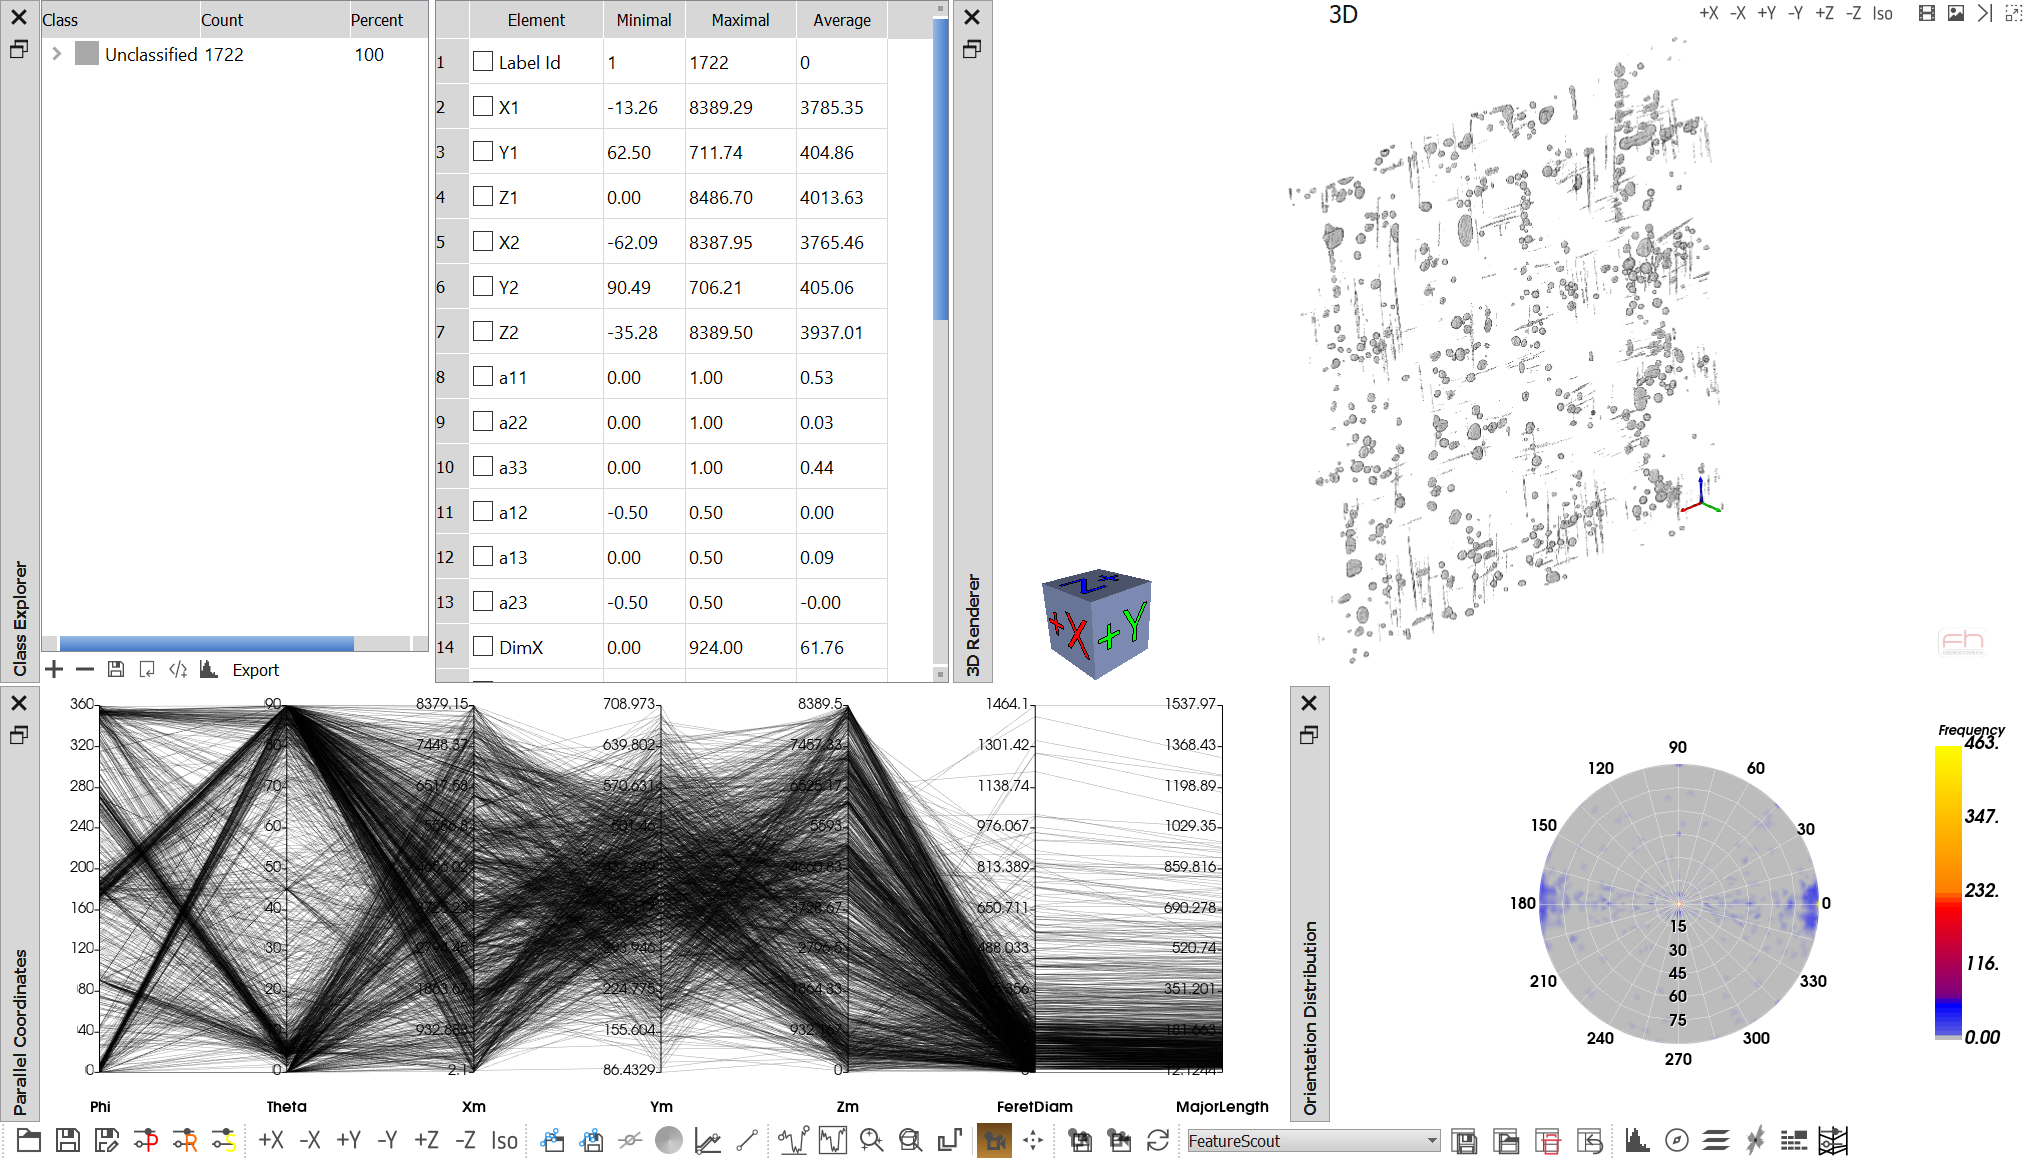
You should see a "Class Explorer" and a "Parallel Coordinates", and optionally an "Orientation Distribution" window. Again, you can arrange these windows to your liking, as explained in the Widgets section of Core User Guide:
-
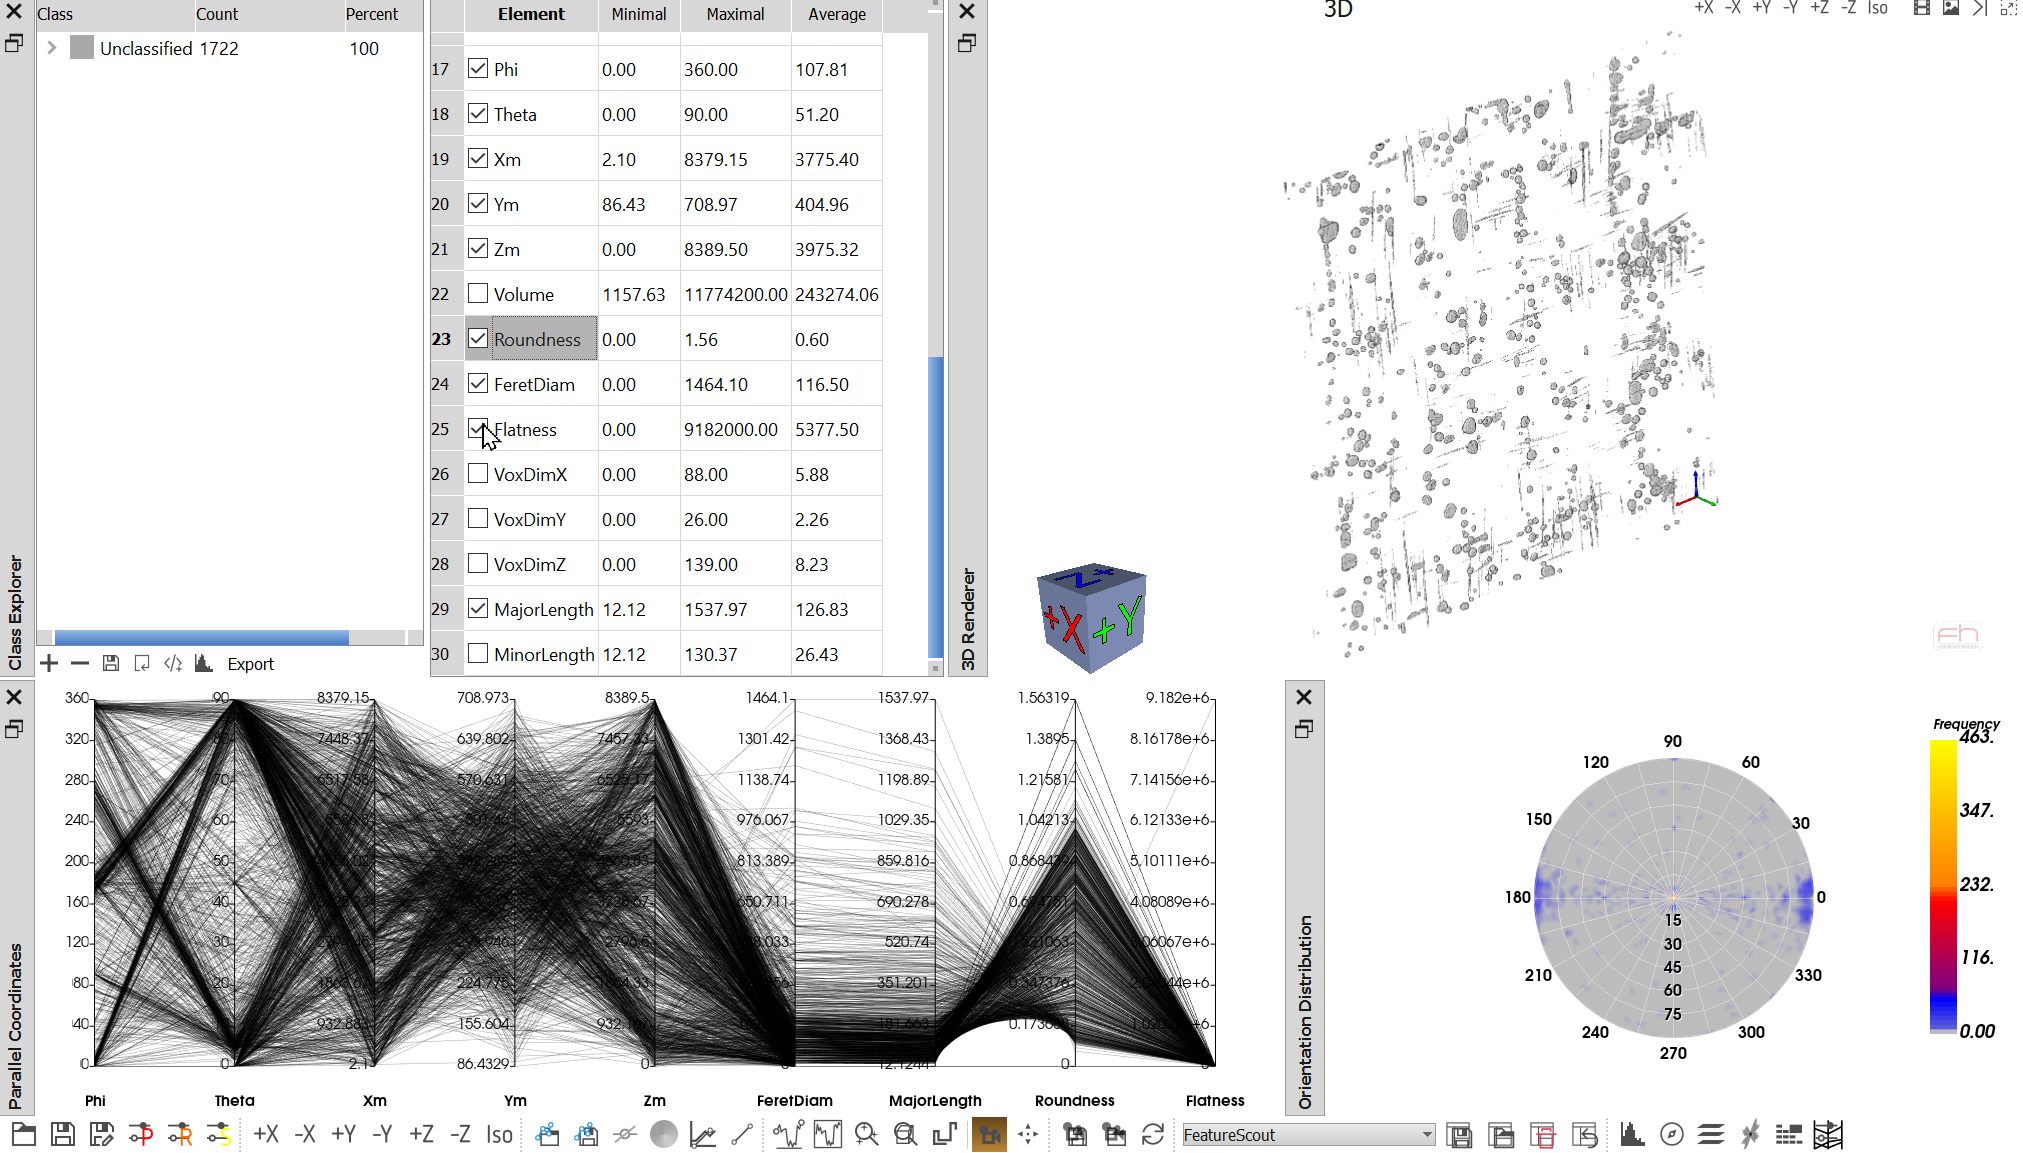
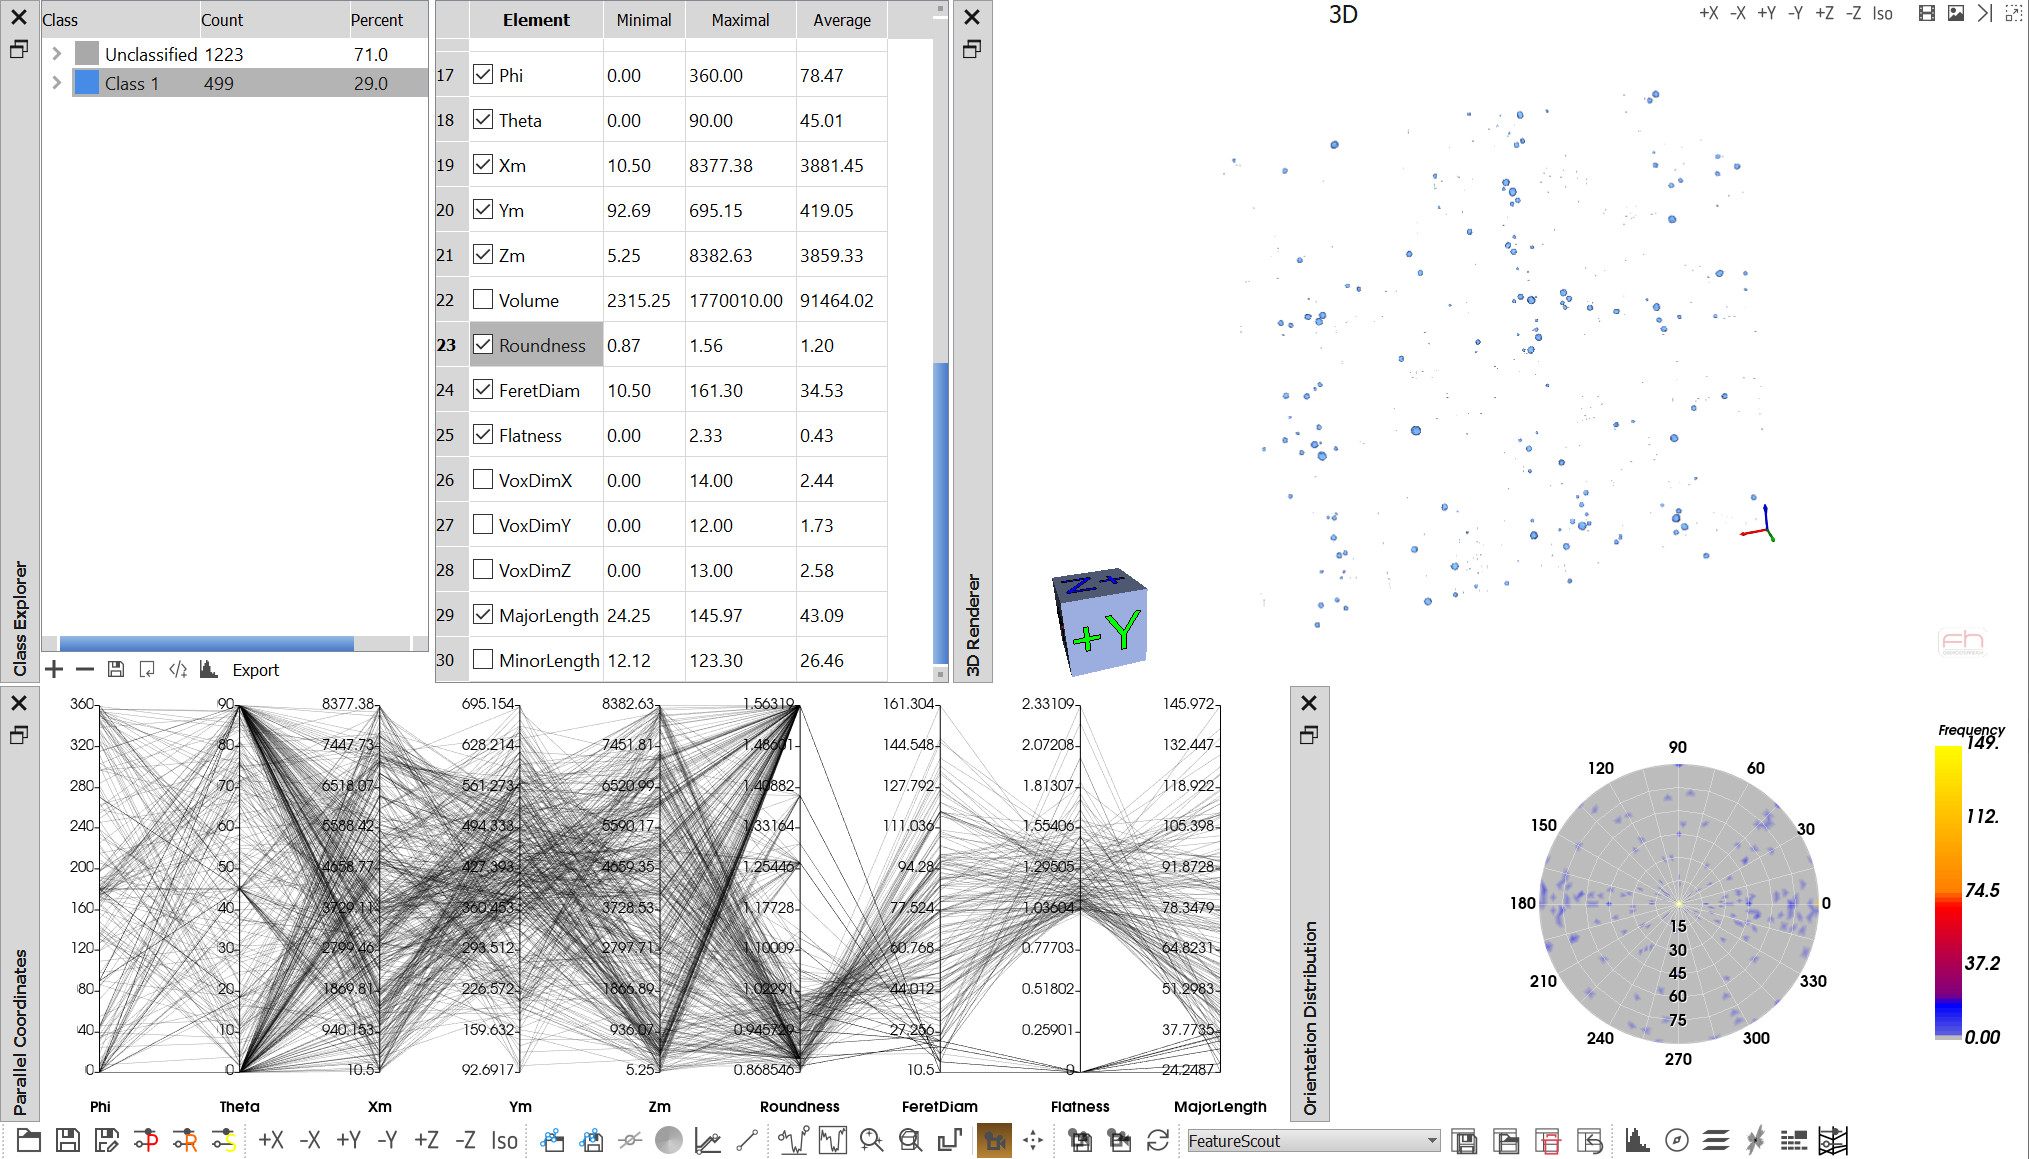
Use the list on the right side of the Class Explorer to select additional characteristics (such as Roundness and Flatness in our example) to be shown in the parallel coordinates plot:
-
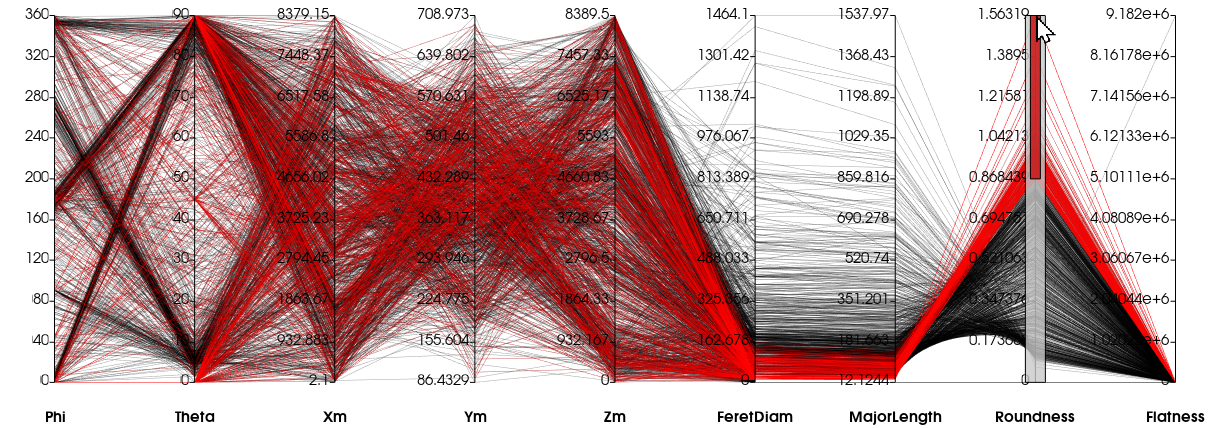
Select objects where a specific characteristic falls into a given range by clicking and dragging the respective range on the corresponding parallel coordinates plot axis:
-
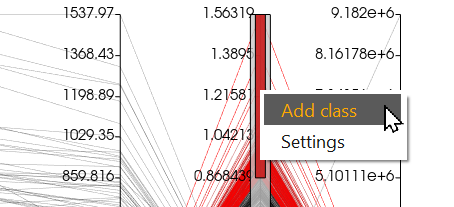
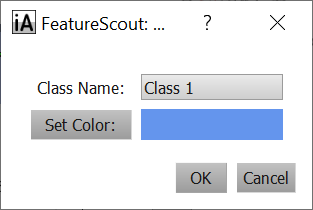
Right click on the range, and select "Add class" from the context menu. You will be asked to specify a name and a color for the class:
-
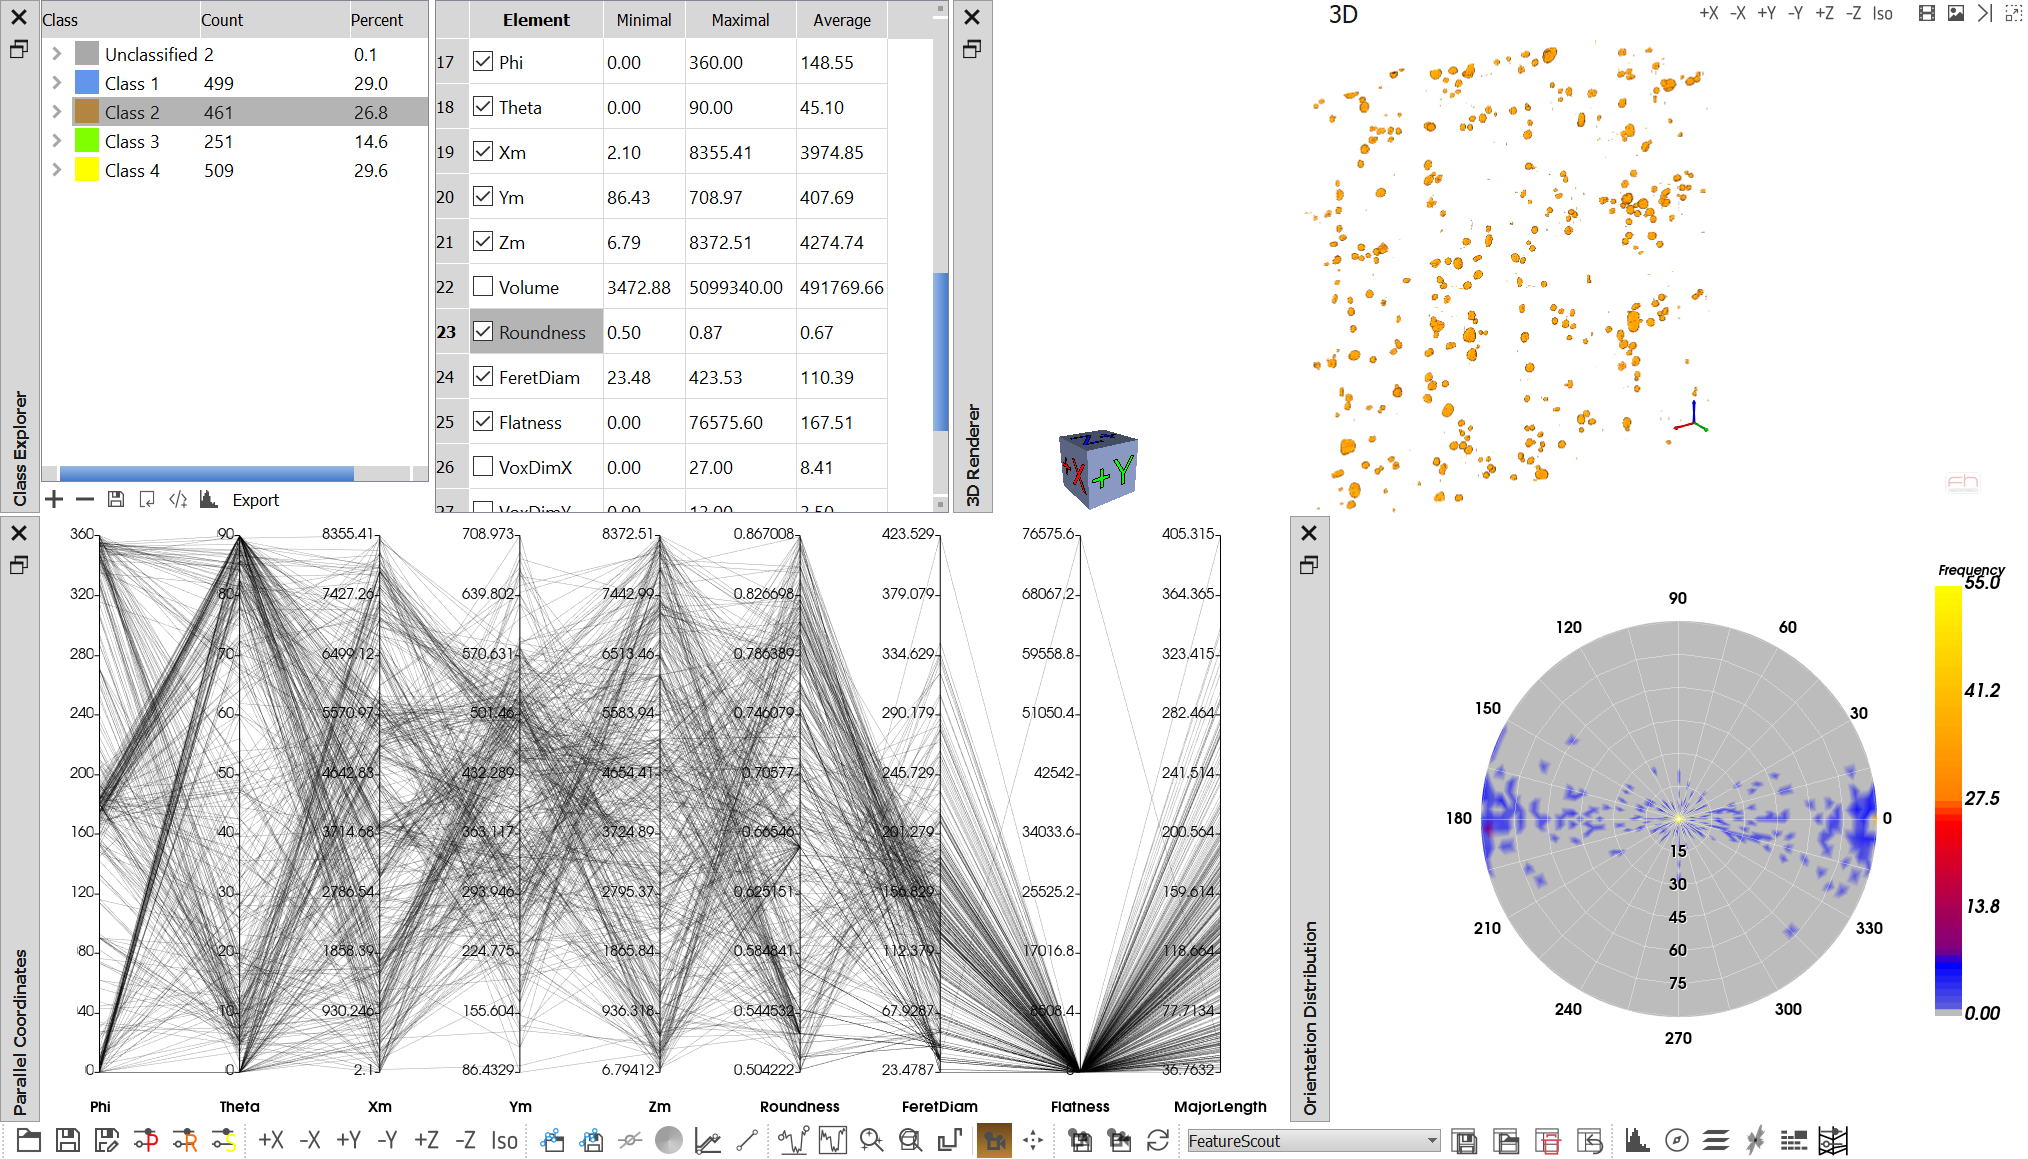
You should now see the class in the list on the left of the Class Explorer. The 3D view and the Parallel Coordinates will now only show the elements from "Class 1" as long as it is selected in the Class Explorer:
-
Click on the "Unclassified" class to see the remaining, unclassified objects. Repeat steps 6-8 until you have configured classes for all the groups of objects for which you want to have MObjects.
-
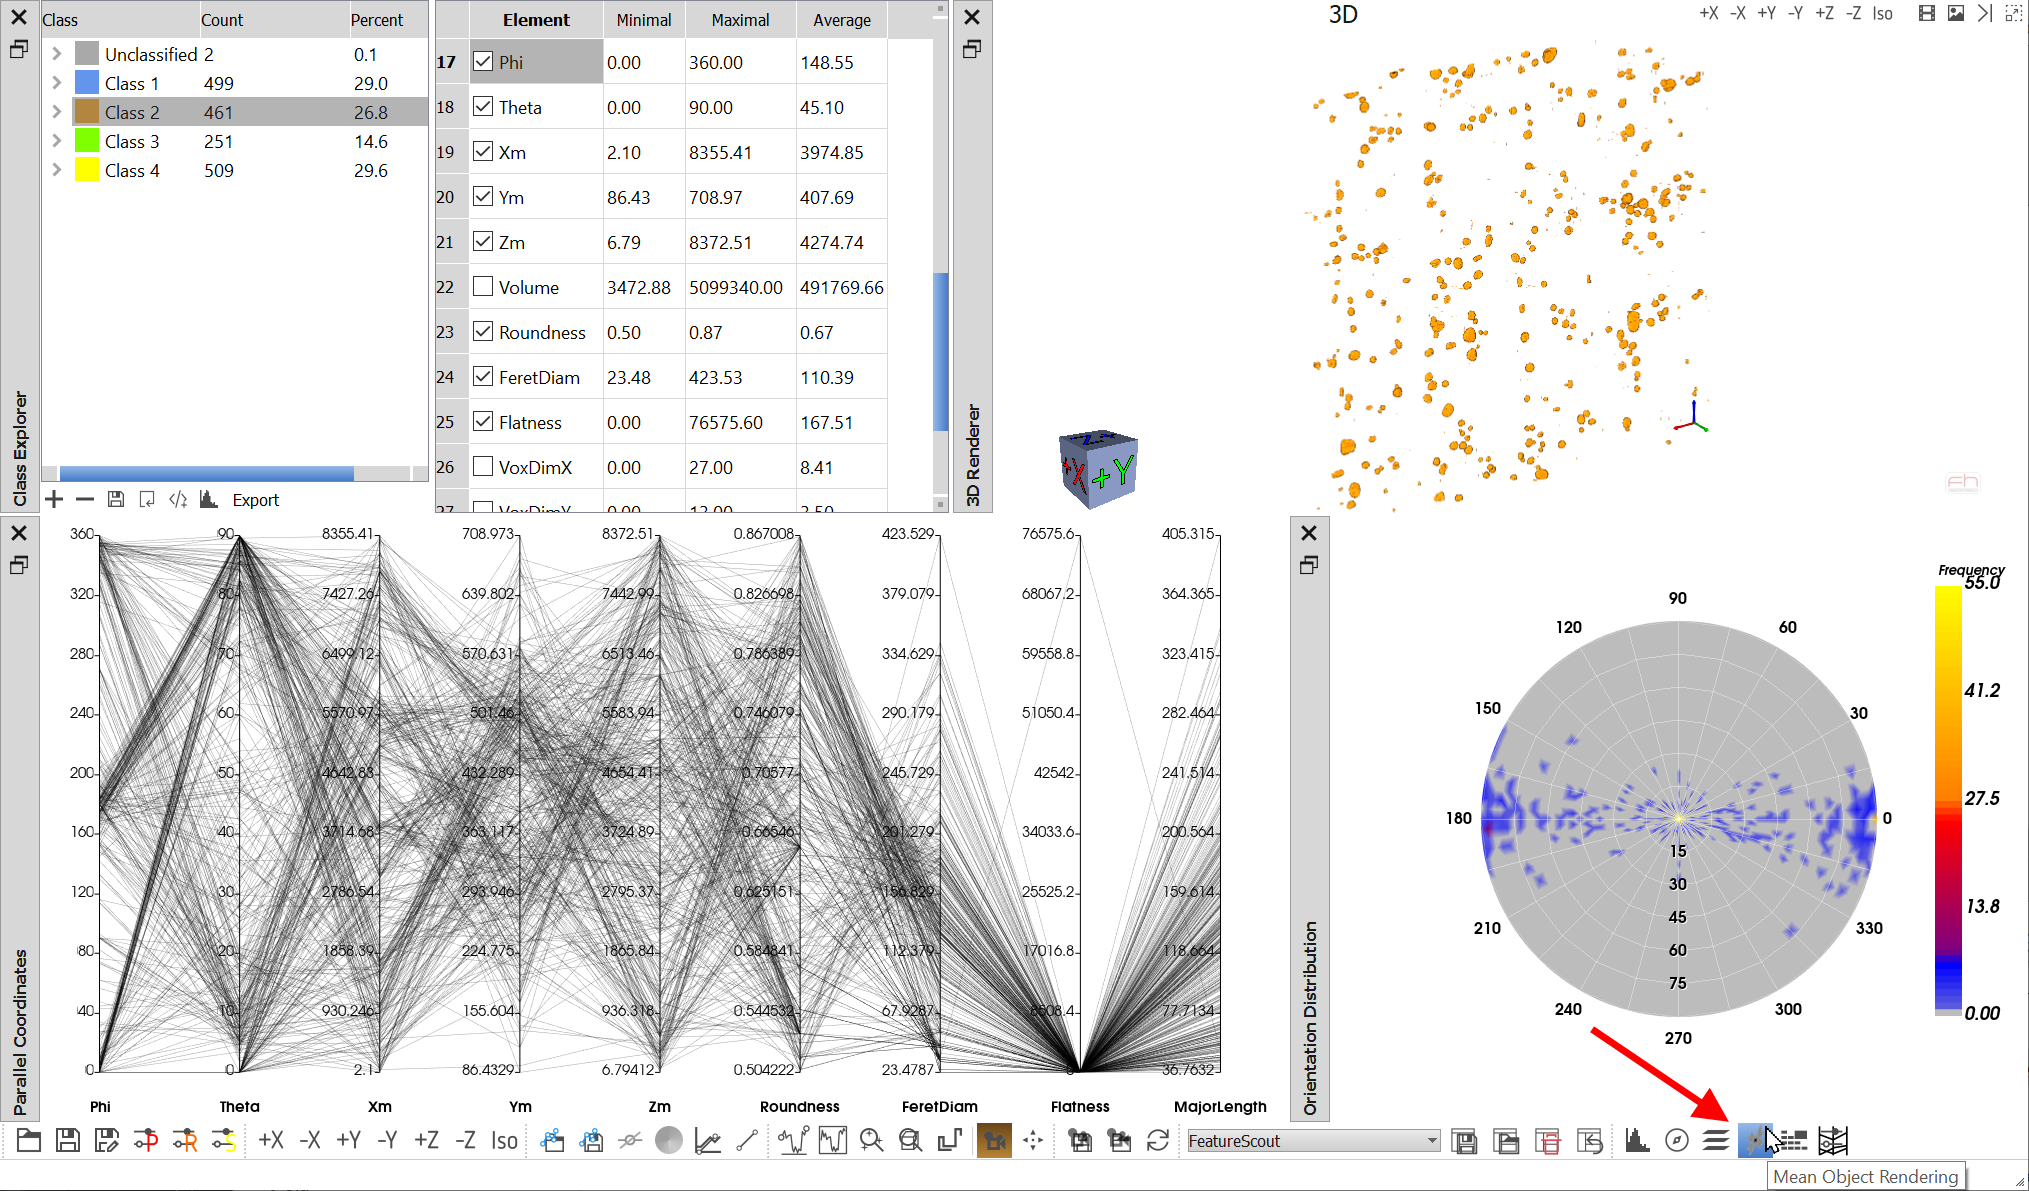
Choose the "Mean Object Rendering" option from the symbol bar:
images/FeatureScout-MObjects-13.png
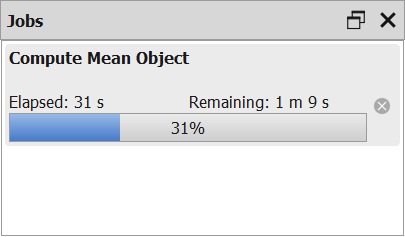
- A Jobs subwindow opens, in which the progress of the computations is indicated:
images/FeatureScout-MObjects-14.png
- When the computation is finished, the mean object for each class will be shown in a new Voids Mean Object View subwindow:
images/FeatureScout-MObjects-15.png
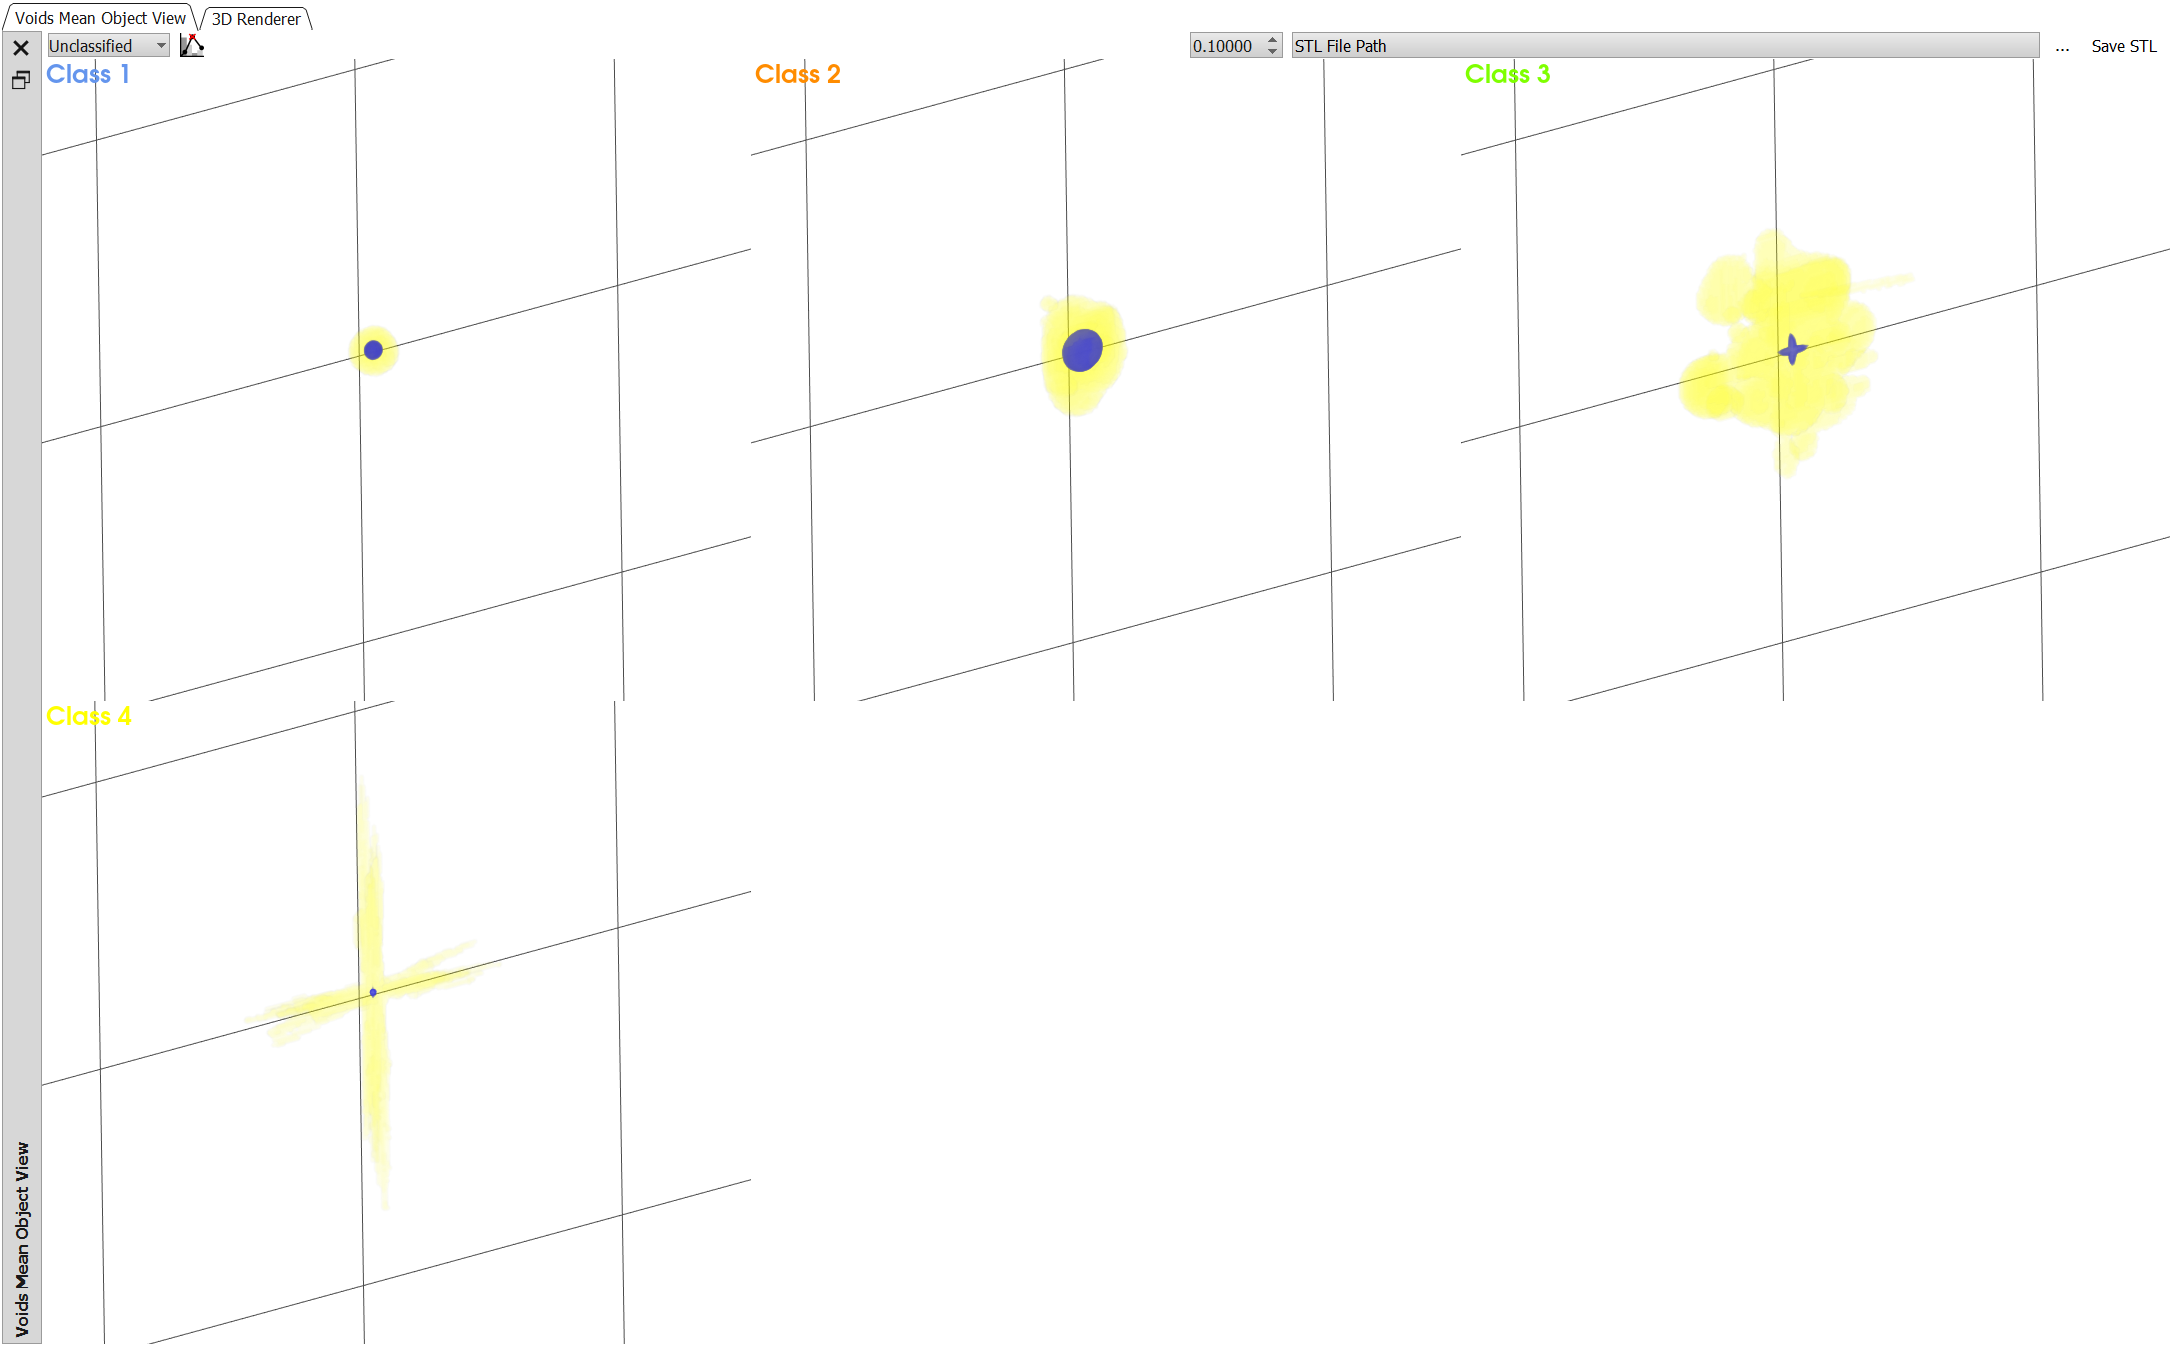
The cameras for the renderer for the MObject for each class are linked, which lets you explore the mean shape of all classes in comparison to one another.
Custom datasets
When loading other datasets than the testdata, you need to make sure that it conforms to the same format as the abovementioned data.
Some notes on the data format / Restrictions:
- Your volume must be a segmented, numbered dataset, meaning that all voxels that belong to an object (pore, fiber, etc.) that you want to analyze need to have the (integer) label ID for that object as (single) intensity value.
- The according csv file needs to have one line per analyzed object, with the ID (in the first column) matching the label ID in the volume for the respective object. The properties of the objects can be configured freely in the advanced options, see step 3 above.
Back to Tools.