dashboards - weewx/weewx GitHub Wiki
WARNING: Some of the components described in this page are experimental or not yet implemented!!
This is an outline of strategies for getting data from hardware into reports or reporting services using weeWX.
When choosing/designing a configuration, consider:
- the components - how many sensors/computers are you willing to maintain?
- the data flows - where are the points of failure?
- the desired frequency of updates to the display - do you need real-time or is every 5 minutes fast enough?
- the frequency at which the sensors emit data - does the hardware emit data as fast as you want to see it?
- the topology of the observations - do the observations come all at once, or do they come sensor-by-sensor?
The Strategies for getting data into weeWX page enumerates configurations for getting data from hardware into weeWX.
Here we focus on displaying the data. Let's start by looking at the data flow from weather station to the display.
|
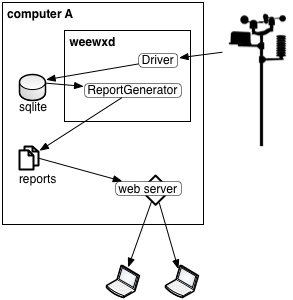
WeeWX collects data from hardware, saves the data to database, then generates reports. A local web server provides access to the reports. This is the configuration in the default weeWX installation. The update frequency for this configuration is the archive interval. |
|
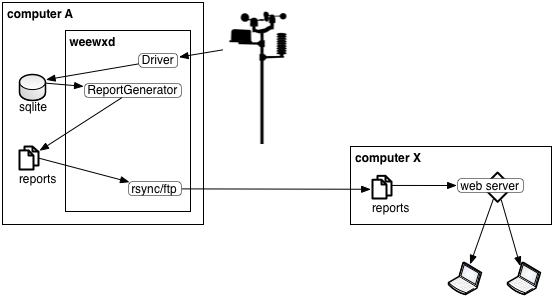
WeeWX collects data from hardware, saves the data to database, then generates reports. WeeWX also runs an rsync or ftp 'report' that synchronizes the reports with a public-facing web server. This is a traditional configuration used by software such as Cumulus and Weather Display. Images and videos from web cameras can be included simply by placing them with the reports that get synchronized. Like the standalone case, the update frequency for this type of configuration is the archive interval. |
|
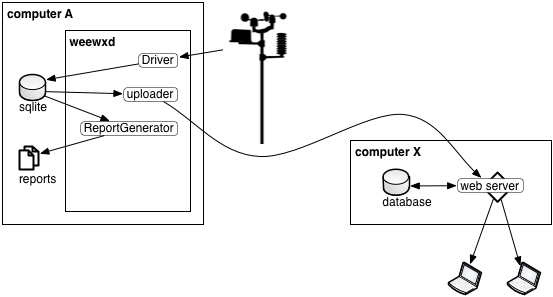
WeeWX collects data from hardware, saves the data to database, then optionally generates reports. It also sends data to a server using a RESTful uploader. The web server provides clients with web pages that contain the current and historical conditions. This is the mechanism used by some recent personal systems such as Meteotemplate. The update frequency for this configuration may be the archive interval, but if the upload is tied to LOOP packets then the update frequency could be as fast as the hardware emit data. |
|
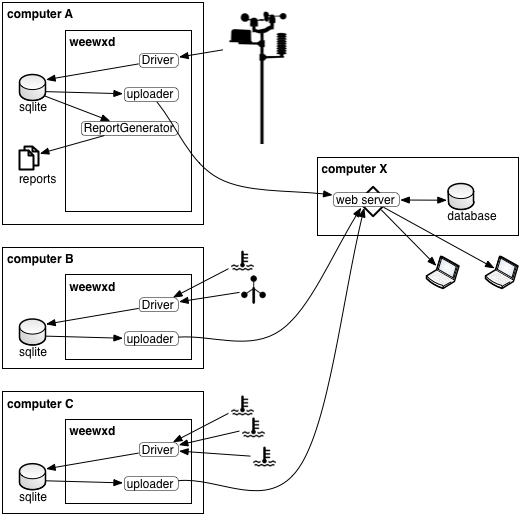
One or more weeWX instances send data to a server using a RESTful uploader. The web server provides clients with web pages that contain the current and historical conditions. This is how many on-line services work, such as weather underground and CWOP. The update frequency for this configuration can be either LOOP or archive interval (REC). |
|
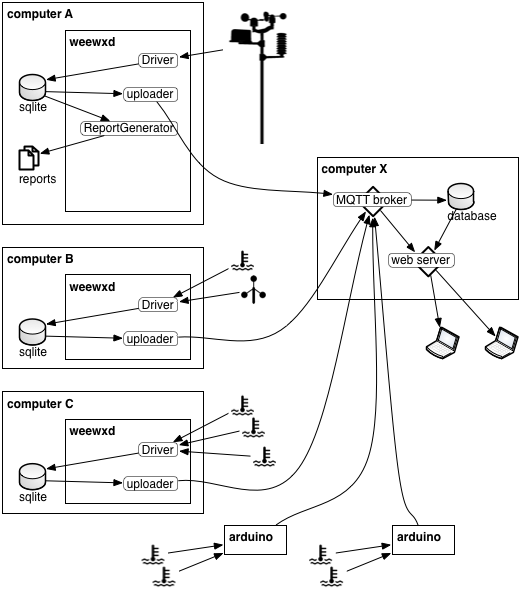
One or more weeWX instances send data to an MQTT broker using the weewx-mqtt extension. The web server provides clients with web pages that use web sockets for near real-time display of data as they arrive at the MQTT broker, and an interface to the historical data via InfluxDB or other data store. The update frequency for this configuration is typically as fast as the hardware emits data. The server then does the temporal aggregation. |
|
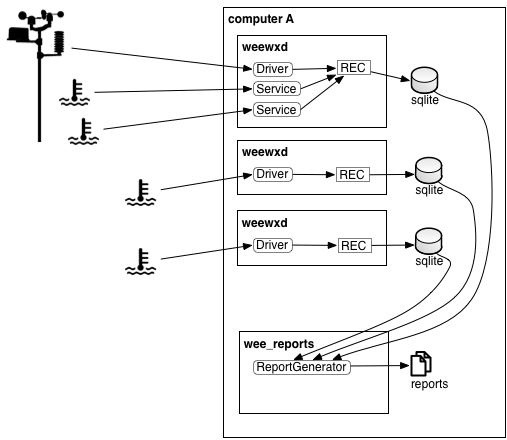
Another way to collect data from multiple data sources is to run a weeWX instance for each source, then use the weeWX reporting architecture to generate a report with data from all of the sources. The reports are generated by invoking `weectl report run` periodically, typically using cron. |
|
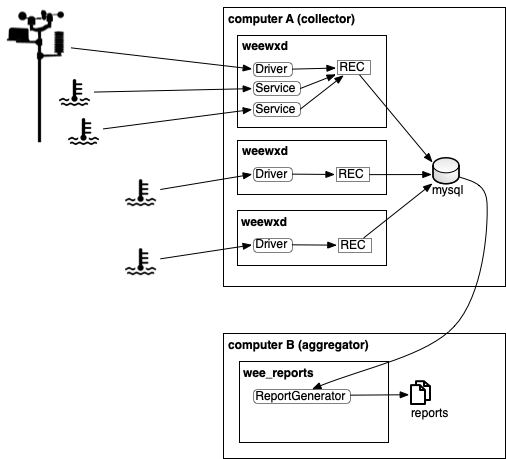
In this configuration, multiple instances of weeWX run on a computer dedicated to data collection, and data are sent to a network-accessible database (e.g., mysql), not the default local-only database (sqlite). The database can reside on the data collection computer, or on a remote computer. Only very basic weeWX reports are generated on the data collection computer - this makes it easy to diagnose problems, but keeps the report processing to a minimum. On a separate computer, the `weectl report` utility runs regularly to generate one or more larger reports that aggregate data from all of the weeWX instances. Data for the reports are retrieved from the network-accessible database. The reports are generated by invoking 'weectl report' periodically, typically using cron. |
Now lets look at some specific use cases.
A default weeWX installation emits a set of web pages (the StandardReport) every archive interval. The web pages are simple HTML with plots rendered as PNG images. There is minimal use of JavaScript, and no dependencies on any web-development frameworks. Data are updated at most every archive interval. There is no automatic refresh for clients viewing the report, nor notification to client when new data arrive.
Update frequency: Report is generated/updated once per archive interval.
Local/Remote: Report can be copied/synchronized to a remote location using FTP, FTPS, or rsync.
Goals:
- Basic functionality with any type of hardware
- Simple implementation that is easy to understand and extend
- Illustrate and exercise weeWX concepts and capabilities
- No network dependencies (e.g., no content delivery network for fonts or images)
- No framework dependencies (e.g., no jQuery or additional fonts)
- No additional software required (e.g., web server)
Generate reports using the plotting and template mechanisms included in weeWX. These reports consist of text, RSS XML, HTML, and image files. Templates are written using the Cheetah and dot-code syntax built-in to weeWX.
Update frequency: Reports are generated/updated once per archive interval.
Local/Remote: Reports can be copied/synchronized to a remote location using FTP, FTPS, or rsync.
Examples: Responsive, Bootstrap, Byteweather, Flat, Niculskin, exfoliation, simple, amphibian
Use weeWX to generate a data file in the format required by a non-weeWX template, possibly generating plots and additional files in the process. In this case, the templates have been created and maintained independently of weeWX. These templates typically read data from one or more text files. For example, many of these templates expect sensor readings in a realtime.txt or customraw.txt file. They may also use plotted data rendered as image files.
Update frequency: Reports are updated every archive interval.
Local/Remote: Reports can be copied/synchronized to a remote location using FTP, FTPS, or rsync.
Examples: Saratoga, Leuven, Steel-Series, Weather-for-you
In this scenario, weeWX emits data at each LOOP, typically as fast as the hardware produces it. The reporting system receives the data and displays it immediately, typically pushing it to any clients that are viewing the report.
For example, weeWX might save LOOP data to a json file, then JavaScript plots poll the json file for changes, reloading the file and updating the display on each change.
Update frequency: Data are updated as frequently as the hardware sends it (every LOOP packet).
Local/Remote: Typically local, especially if the updates happen frequently.
Examples: mesowx, InfluxDB+Grafana
In this scenario, weeWX feeds into a separate service that aggregates, stores, and reports data.
Update frequency: Data are updated as frequently as the hardware sends it (every LOOP packet), or at each archive interval.
Local/Remote: The report display can be on the same computer running weeWX, same network as weeWX, or in the cloud.
Examples: weeRT (EXPERIMENTAL), InfluxDB, EmonCMS, SEG, ThingSpeak, meteotemplate
static plot images vs dynamic javascript plotting
for javascript plotting: read data from json/csv file vs read data from a server
current values vs historical values
ability to accumulate historical values
mechanism: ftp/ftps/rsync vs restful
frequency: loop vs archive