ERPLAB Studio: Data Quality Metrics - ucdavis/erplab GitHub Wiki
ERPLAB contains multiple routines designed to allow users to quantify the quality of their data. This page provides a general overview of how these routines work together. Details of implementation are provided in the manual pages for the Compute Averaged ERPs panel and the Average Across ERPsets panel. Here, we provide the big picture.
Most of this page is devoted to data quality metrics that focus on the quality of amplitude and latency values obtained from averaged ERP waveforms. However, we also provide a Spectral Data Quality routine for continuous EEG that can give you coarse information about the amount of power in different frequency bands (e.g., line noise at 50 or 60 Hz).
At present, we directly support four classes of metrics of data quality that are automatically computed at the time of averaging and stored in the ERPset. You can also compute and view these metrics without averaging using the Compute Data Quality Metrics panel (in the EEG tab). Here are the metrics:
- Baseline noise - the noise level during the baseline period for each waveform in an ERPset. This is typically quantified as the standard deviation of the voltage values during the baseline period. It provides a generic measure of the amount of noise that remains in the data after averaging.
- Pointwise SEM - The standard error of the mean at each time point for each waveform in an ERPset (i.e., each combination of bin and channel). This can be either the standard error across trials for a single-participant averaged ERP waveform or the standard error across participants for a grand average. This is a common way of visualizing the noise, but it is less useful as a quantitative metric.
- aSME and bSME - The standardized measurement error (SME) for one or more amplitude or latency “scores”. A score would be something like “mean amplitude from 300-500 ms,” “peak latency from 200-800 ms,” or even “50% area latency from a difference wave.” The SME quantifies the standard error of measurement for that specific score. A given type of noise will impact some types of scores more than others. For example, high-frequency noise has much more impact on a peak amplitude score than on a mean amplitude score. The SME quantifies the noise that directly impacts whatever score you are actually using as the dependent variable in your final analyses. See this paper (or free version).
- aSD - The analytic standard deviation of the mean amplitude across trials. The SME takes into account the number of trials being averaged together, which is appropriate given that this has a huge impact on data quality. However, sometimes it is useful to examine trial-to-trial variability independent of the number of trials. To accomplish this, we provide tools for quantifying the SD across trials. That is, the mean voltage within a given time range is calculated on each trial, and we calculate the SD across trials. Note that there is no straightforward way to use bootstrapping to obtain these values for other types of scores (e.g., peak amplitude). For examples of the use of aSD, see Zhang & Luck 2023.
Important Note: The data quality information is stripped from the ERPset by any ERPLAB operations that modify the ERPs (e.g., ERP filtering, ERP bin operations, ERP channel operations). This is because we cannot guarantee that the metrics are still valid for the modified ERPs. For example, filtering or averaging across electrode sites might improve the data quality. If you want to quantify the data quality for a transformed ERPset, you must manually compute the metrics from the transformed ERPset (e.g., using the bootstrapped SME).
Analytic SD, SEM, and SME estimates exhibit a bias that varies with the number of trials: As the number of trials gets smaller, these estimates become progressively lower than the true value. We provide an option that corrects for this bias (Gurland & Tripathi, 1971). We recommend using this option, but it is off by default (to maintain backward compatibility with previous versions of ERPLAB that did not include this option). Unfortunately, we know of no simple correction that can be applied to bootstrapped values.
If you are scoring the amplitude of an ERP component as the mean voltage during some time window (e.g., quantifying P3 amplitude as the mean voltage between 300 and 500 ms), the SME can be automatically calculated using a simple equation during averaging. We call this the analytic SME or aSME. By default, ERPLAB computes aSME at the point of ERP averaging, in. The time windows in which it is computed can be customized, and are 100 ms windows, centered around 0 ms, by default.
For types of scores where analytic SME does not easily apply (like peak amplitude scores, or any score using latency measures), the process of bootstrapping can be used to compute the SME. In this case, we specify this as bootstrapped SME (bSME). This is not computed by default, but can be added via simple Matlab scripts.
- Watch a 3-minute video overview of the SME
- View an infographic providing a quick explanation of the SME
- Read a full-length journal article about the SME: Luck, S. J., Stewart, A. X., Simmons, A. M., & Rhemtulla, M. (2021). Standardized measurement error: A universal metric of data quality for averaged event-related potentials. Psychophysiology, 58, e13793. https://doi.org/10.1111/psyp.13793 [View on free version]
Data quality metrics are initially computed for each participant at the time of averaging, but you can obtain aggregate values for a group of participants when you make a grand average.
The single-participant data quality metrics can be used to determine whether the data from a specific participant, channel, or bin are especially noisy. For example, you might use the SME value from a given channel to determine if any channels are “bad” and should be interpolated for a given participant. You might also use this value to determine whether a given participant’s data are so noisy that the participant should be excluded from the final analyses of a study (although this should be done only when you have an a priori criterion for deciding how bad the noise must be for a participant to be excluded).
When aggregated across a group, the SME can tell you how much of the overall variance in your amplitude or latency score is a result of measurement error. The aggregated SME also allows you to compare data quality across experimental paradigms, across laboratories, across recording systems, across research assistants, and across signal processing methods.
We encourage you to report the aggregated SME values in your publications (and please cite our paper when you do so!). If SME values become common in publications, this will make it possible for the field to determine what recording and analysis procedures lead to the highest data quality, which will allow everyone to improve the quality and reproducibility of their research.
In many cases, these metrics of data quality will be automatically computed at the time of averaging (as described in the Data Quality section of the manual page for the Compute Averaged ERPs panel). By default, the averaging routine will save the data quality values in the dataquality field of an ERPset (ERP.dataquality).
In other cases, you may write your own script that computes these metrics (especially for bSME), and then your script will save them to the dataquality field. The structure of this field will be described below. Example scripts and test data are available here. You can also invent your own metrics of data quality and store them in the dataquality field.
The data quality values can be aggregated across the individual participants in a group using the Average Across ERPsets panel. The simplest way to do this is just to average a given data quality metric across participants. However, it is often better to aggregate the single-participant values using the root mean square (RMS) of the values. When the RMS is used instead of the average, the result is more directly related to the effect of noise on your effect sizes and statistical power. See our paper for details.
When you use the Average Across ERPsets panel to aggregate across participants, the data quality values are simply stored in the ERP.dataquality field of the grand average ERPset. You can view and save them using the same methods used for the ERP.dataquality field of a single-participant ERPset.
We provide several ways of accessing, viewing, and saving the resultant data quality measures for an ERPset.
-
Summary information is presented in a table when an averaged ERP is created. This includes the median, minimum, and maximum aSME values. This information can be viewed later by looking in the Data Quality Metrics panel.
-
Data Quality Table ERPLAB can produce a window with a table showing all the data quality values. You can access this from ERPLAB Studio by going to the View Data Quality Metrics panel in the ERP tab and clicking Show in a table.
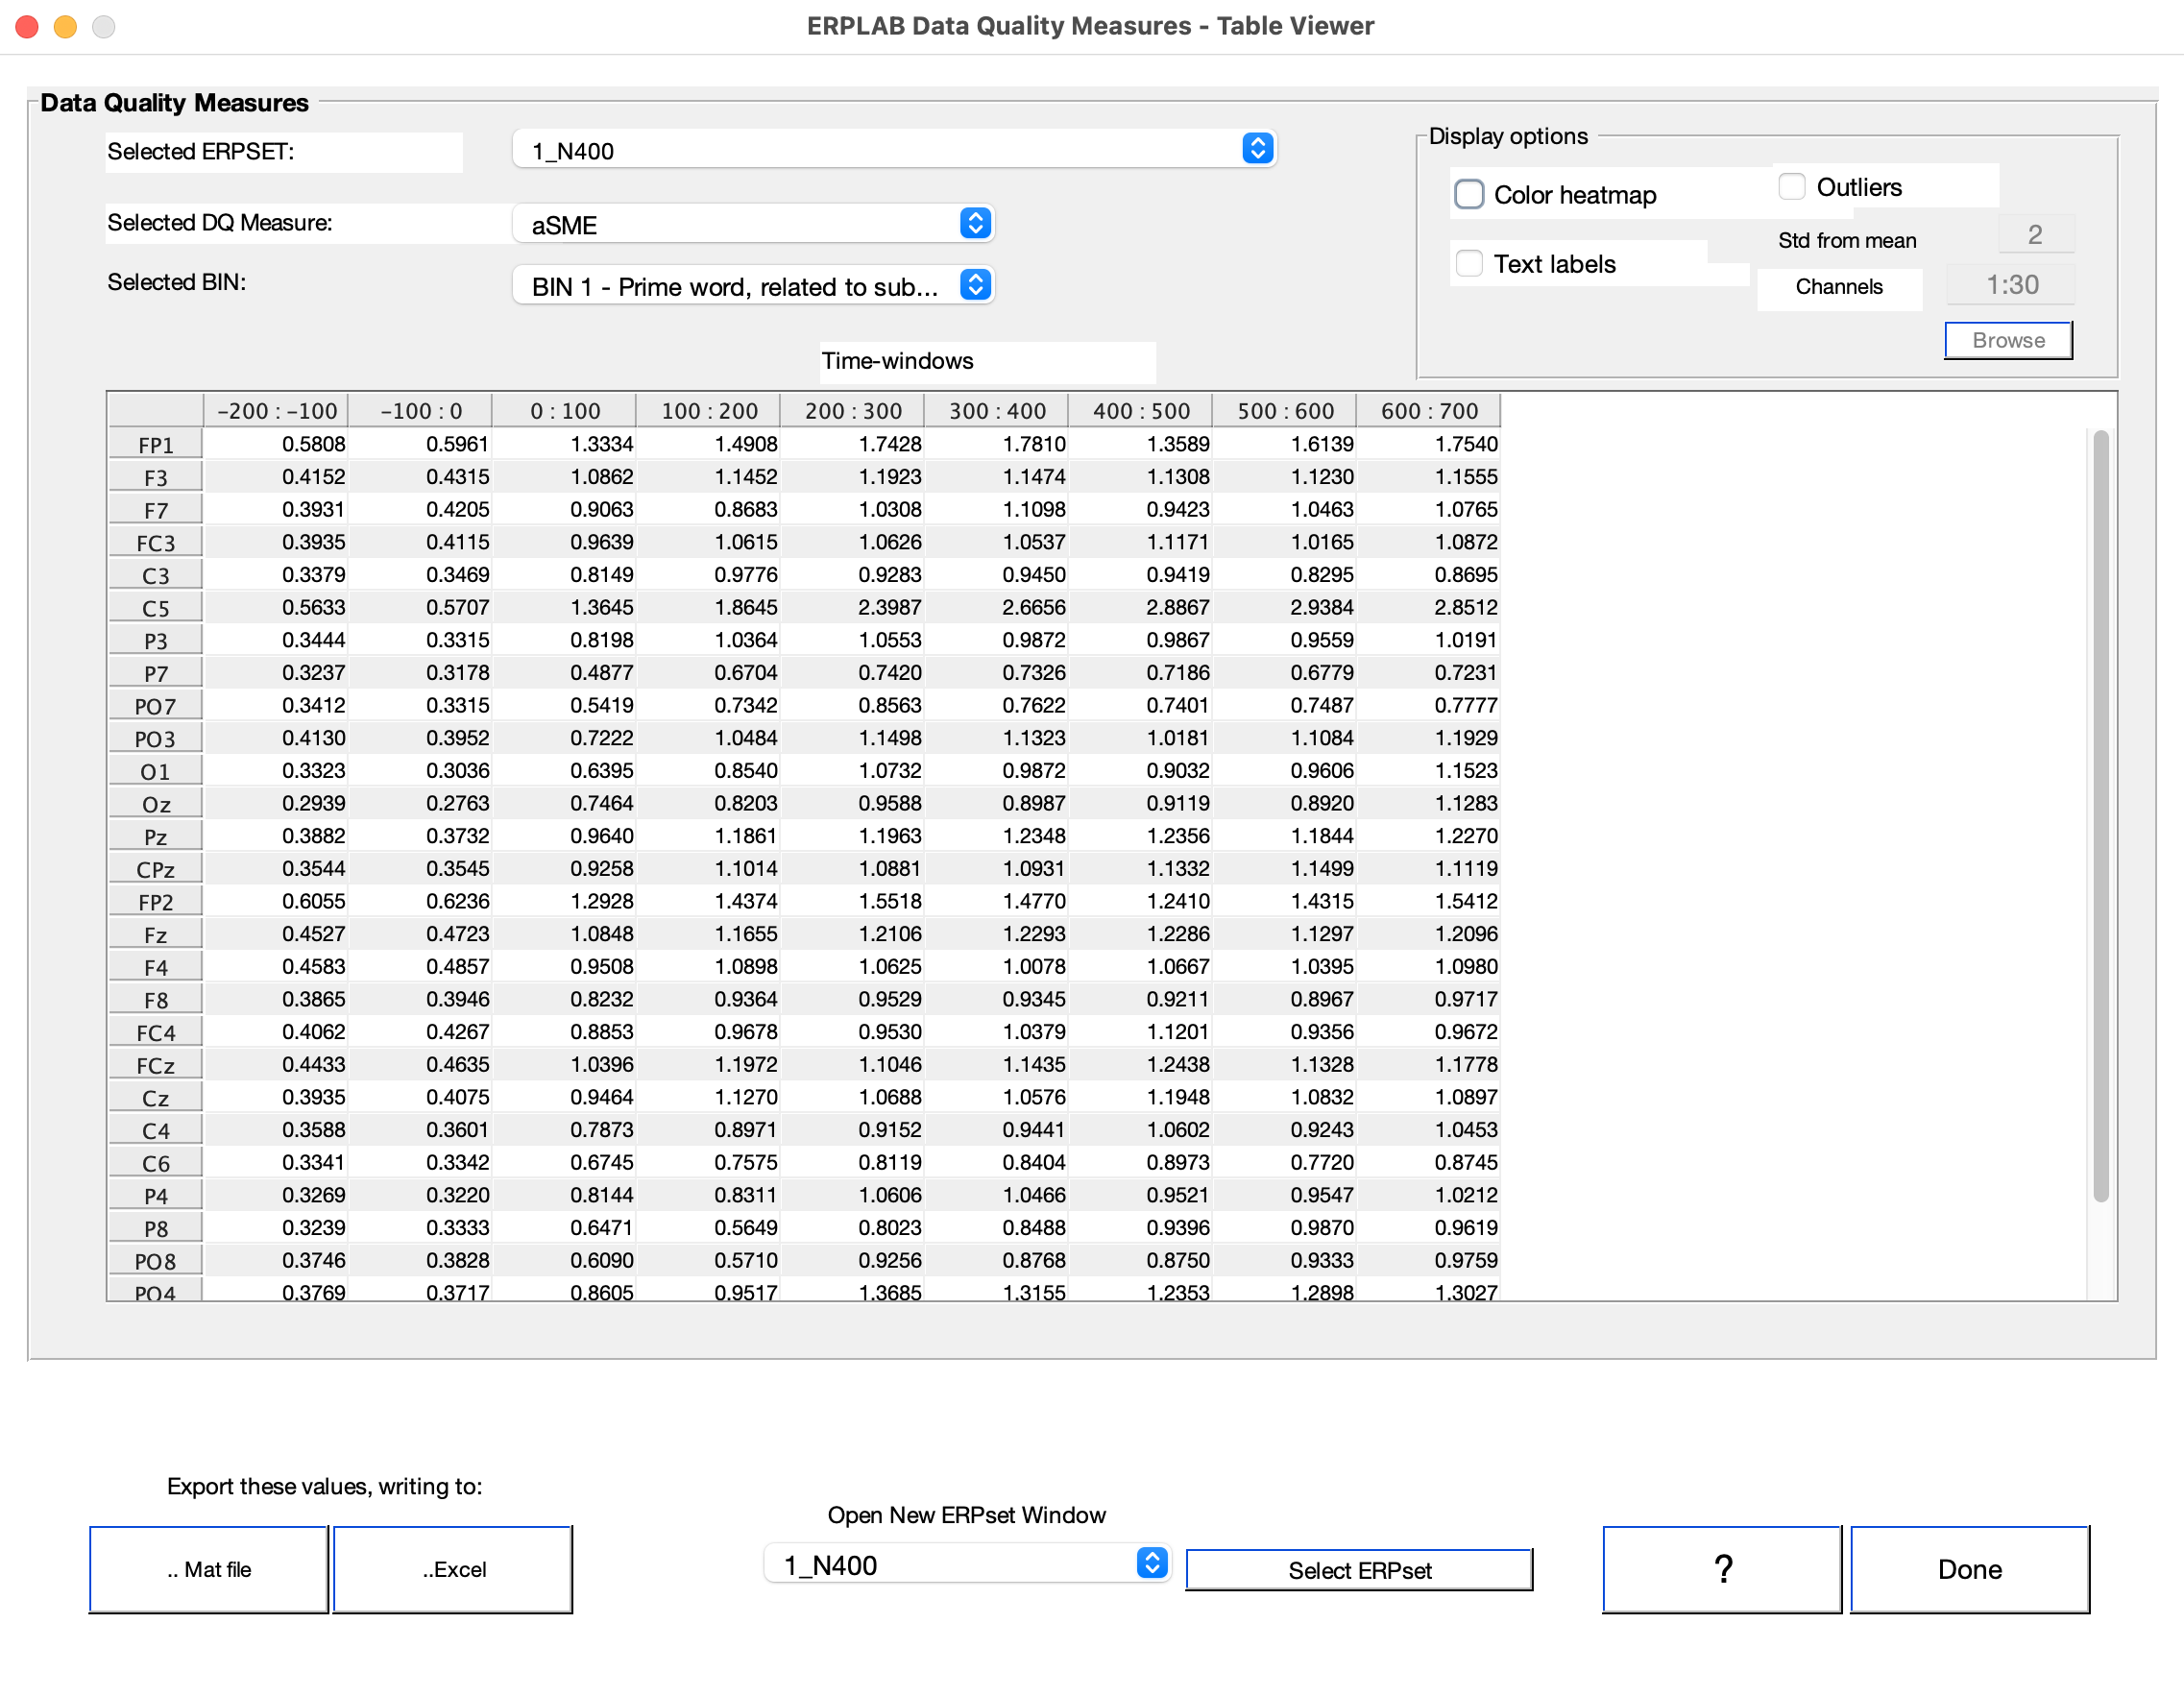
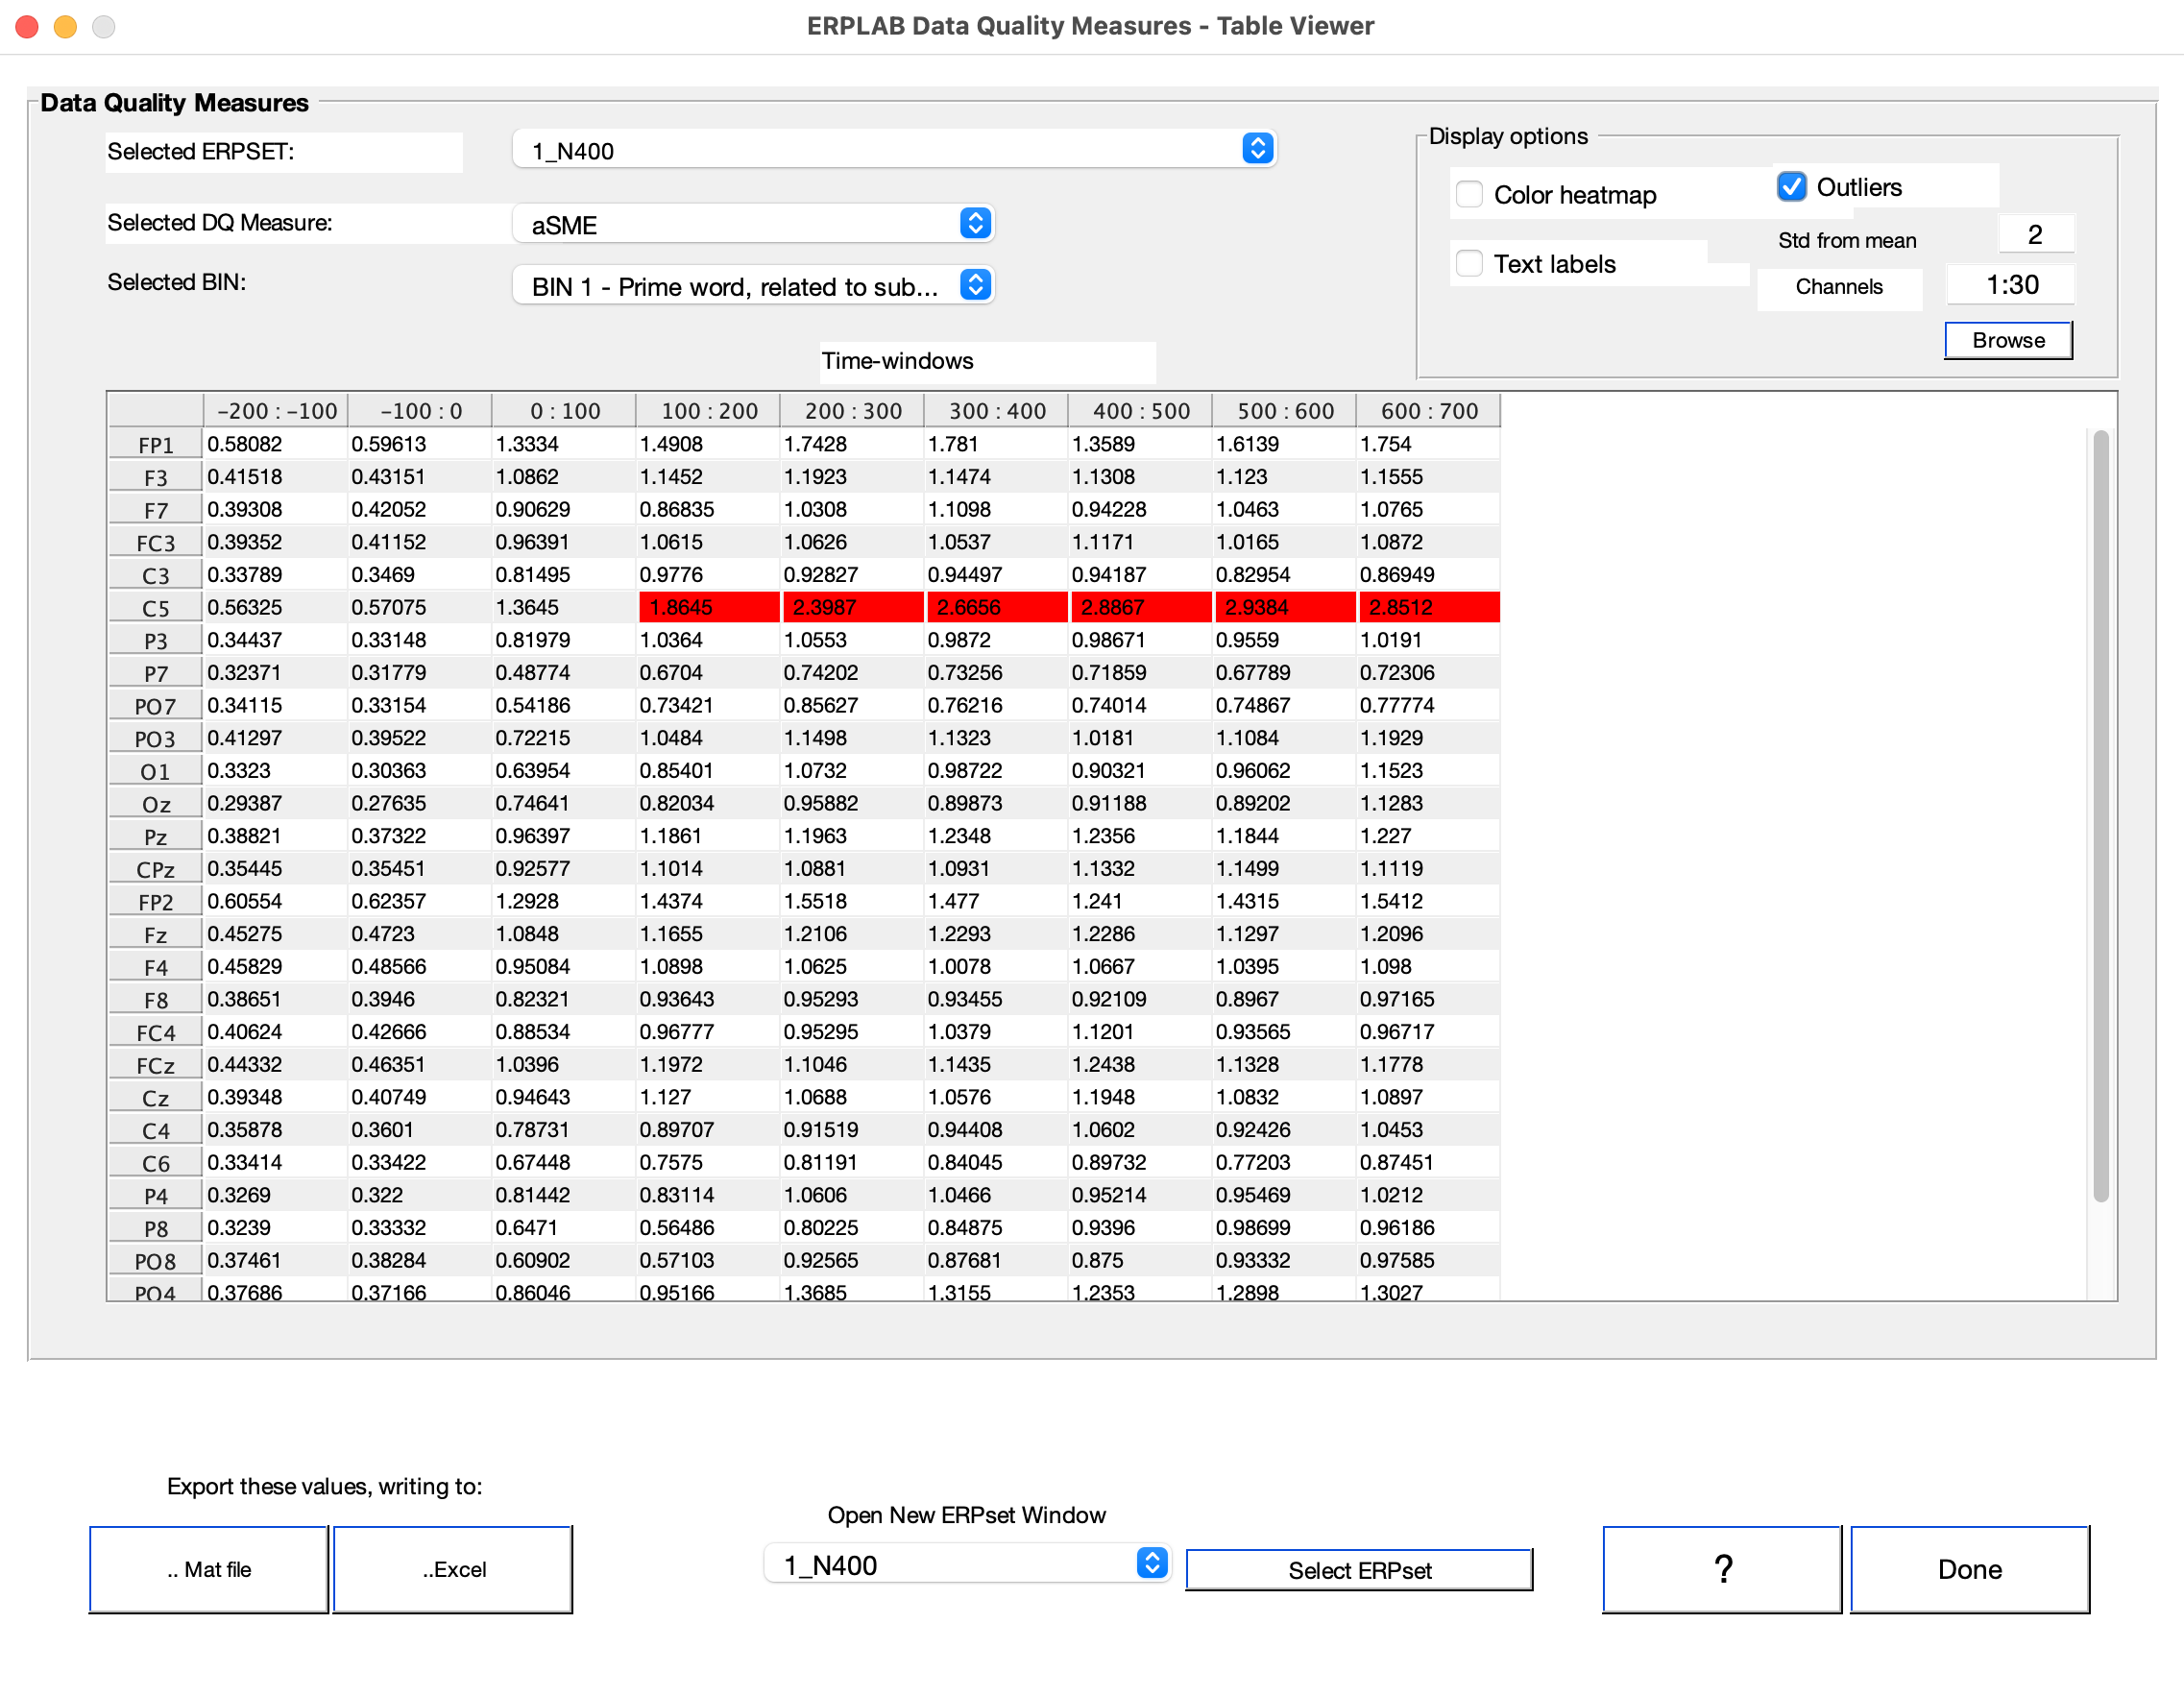
You can more easily detect problematic values by selecting the Color heatmap option or the Outliers option. Outliers are defined as channels whose values are more than N standard deviations away from the mean across channels for a particular Time Window (where N is entered in the Std from mean box).
- Scripting you can access the data quality information from a script by accessing the ERP.dataquality data structure. See ERP.dataquality details here.
The Data Quality measures can also be saved to a Matlab binary file, or to an Excel-compatible spreadsheet for viewing or further analysis.
Note that the above Data Quality Table interface has options to save the values in a file.