ERPLAB Studio Panels: Spectral Data Quality - ucdavis/erplab GitHub Wiki
The Spectral Data Quality panel allows you to estimate the amount of power within specific frequency bands (e.g., 60 Hz). This can be used as a measure of EEG data quality. For example, skin potentials predominantly produce low-frequency voltages (under ~3 Hz), and line noise produces narrow spikes at the line frequency (60 Hz in North America and some other parts of the world, 50 Hz in Europe and most of Asia). This panel allows you to quantify the amplitude or power in whatever frequency bands you like. More precise information about data quality can be obtained at the time of averaging with our other data quality metrics. However, those metrics require more extensive preprocessing, and this panel provides a quick assessment of data quality on the continuous EEG with minimal preprocessing. Note that it works only with continuous EEG data.
- Before using this routine, you should do a quick cleaning of the continuous EEG using both Delete Time Segments and Artifact Rejection in Continuous EEG).
- These routines will eliminate the periods of time between trial blocks and periods with extreme noise (e.g., when an electrode has become disconnected or the subject scratches the electrode cap).
- These periods will not impact your final data quality, but they can have a large impact on the Spectral Data Quality routine. If you do not remove them, the output of this routine may be misleading.
- For a more sophisticated approach to characterizing EEG frequency content, see the FOOOF package from the Voytek lab.
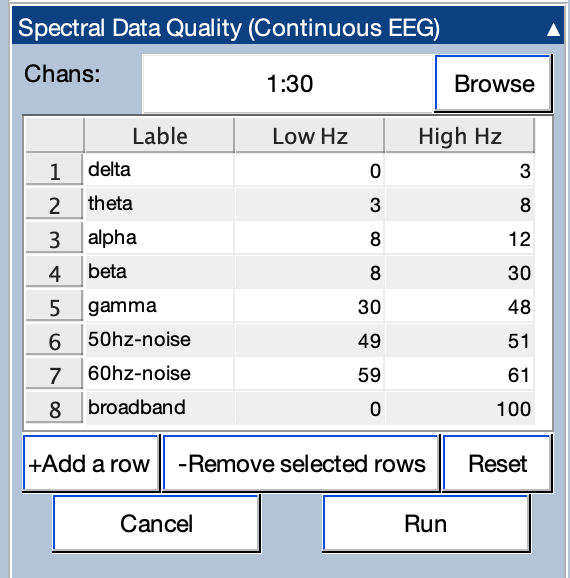
The Spectral Data Quality panel allows you select a subset of channels for analysis. It also allows you to select which frequency bands to quantify. We provide a set of defaults, but you can edit and delete those bands, and you can add additional bands. The Reset button restores the defaults. Once you are satisfied with the parameters, click the Run button.
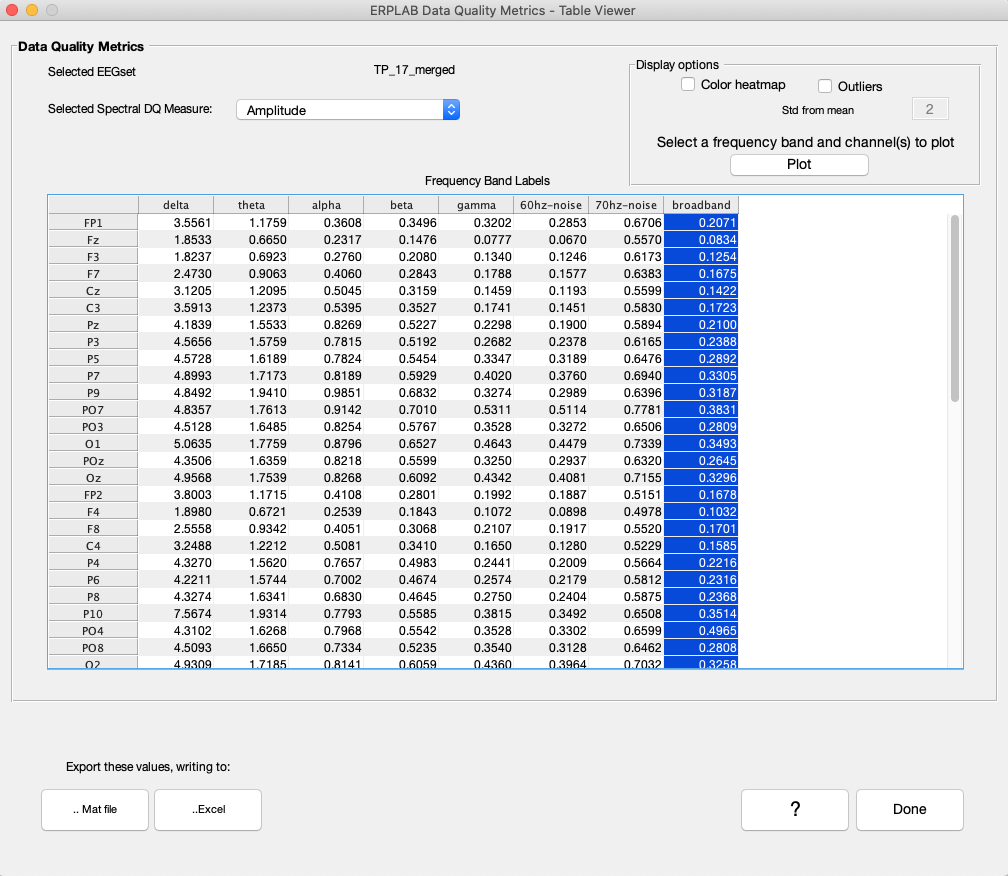
The routine will take some time to run (typically between 10 seconds and 2 minutes, depending on the size of the dataset and the speed of your computer). When it completes, it shows the results in a Viewer window, as shown in the screenshot below. The Viewer shows the amplitude or power for each band, separately for each channel. These values can be exported to either a Matlab data file or an Excel spreadsheet.
If you see a value of NaN in the Viewer, this usually means that the corresponding frequency band is not valid for the current dataset. In particular, the maximum frequency is 1/2 the sampling rate (e.g., 128 Hz if your sampling rate was 256 Hz).
This can be a lot of information, so we provide two options for highlighting extreme values. If you check the Color heat map box, each cell of the table will be color-coded according to the amplitude or power of that cell. If you check the Outliers button, any cells that are more than X standard deviations from the mean for that band will be highlighted. (The default for X is 2, but you can adjust this with the text box.)
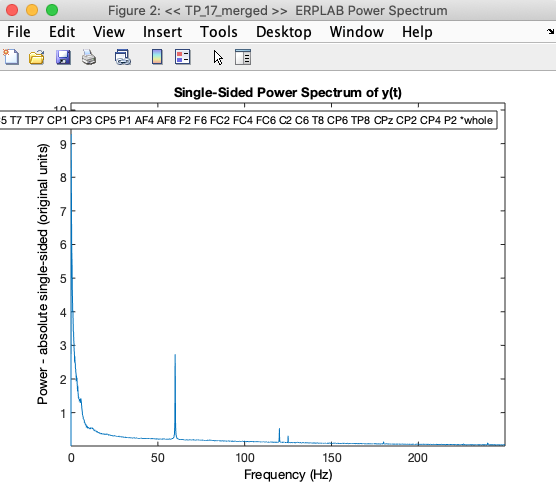
You can also plot the amplitude or power for each individual frequency within a selected band, as shown in the screenshot below. First, select one or more channels from a single frequency band. Then click the Plot button to see a graph of amplitude or power over the frequencies within that band (averaged over the selected channels).
This routine returns the averaged single-sided amplitude of frequency bands via Fast Fourier Transform from ~5-second epochs of the continuous EEG. The windows are created and randomly selected from a random 20% of the 5-second windows to increase speed. A fixed seed is used for selecting the random set of windows so that the results will be the same if the routine is run multiple times. An FFT is run on each window, and then the average of the FFTs is computed. This yields much more precise values that computing the FFT of a single long epoch.
Note that an FFT requires that the number of time points is a power of 2. The actual epoch length is the closest value to 5 seconds that can be achieved with this constraint.
[EEG, fft_out] = pop_continuousFFT( EEG, 'ChannelIndex', 1:64, 'Frequencies', [ 0 3; 3 8; 8 12; 8 30; 30 48; 49 51; 59 61; 0 250], 'FrequencyLabel',... {'delta' 'theta' 'alpha' 'beta' 'gamma' '60hz-noise' '70hz-noise' 'broadband' }, 'PercentRandom', 20, 'viewGUI',... 'true' );
Note that the script version allows you to specify the percentage of 5-second segments to use. It also includes a 'NumberOfPointsFFT' option that allows you to change the length of the window (expressed as the number of sample points rather than the number of seconds). For example, with a sampling rate of 500 Hz, you would specify 2500 points to get a 5-second epoch length. The routine will automatically round to the closest power of two (which would be 2^11 or 2048 points if you specify 2500 points as the epoch length).