Mobile and Dash - rogers-group-inc/polaris GitHub Wiki
Mobile app and Dash wallboard
Two surfaces that are not the desktop app: an installable phone app, and an unauthenticated NOC wallboard.
The mobile app
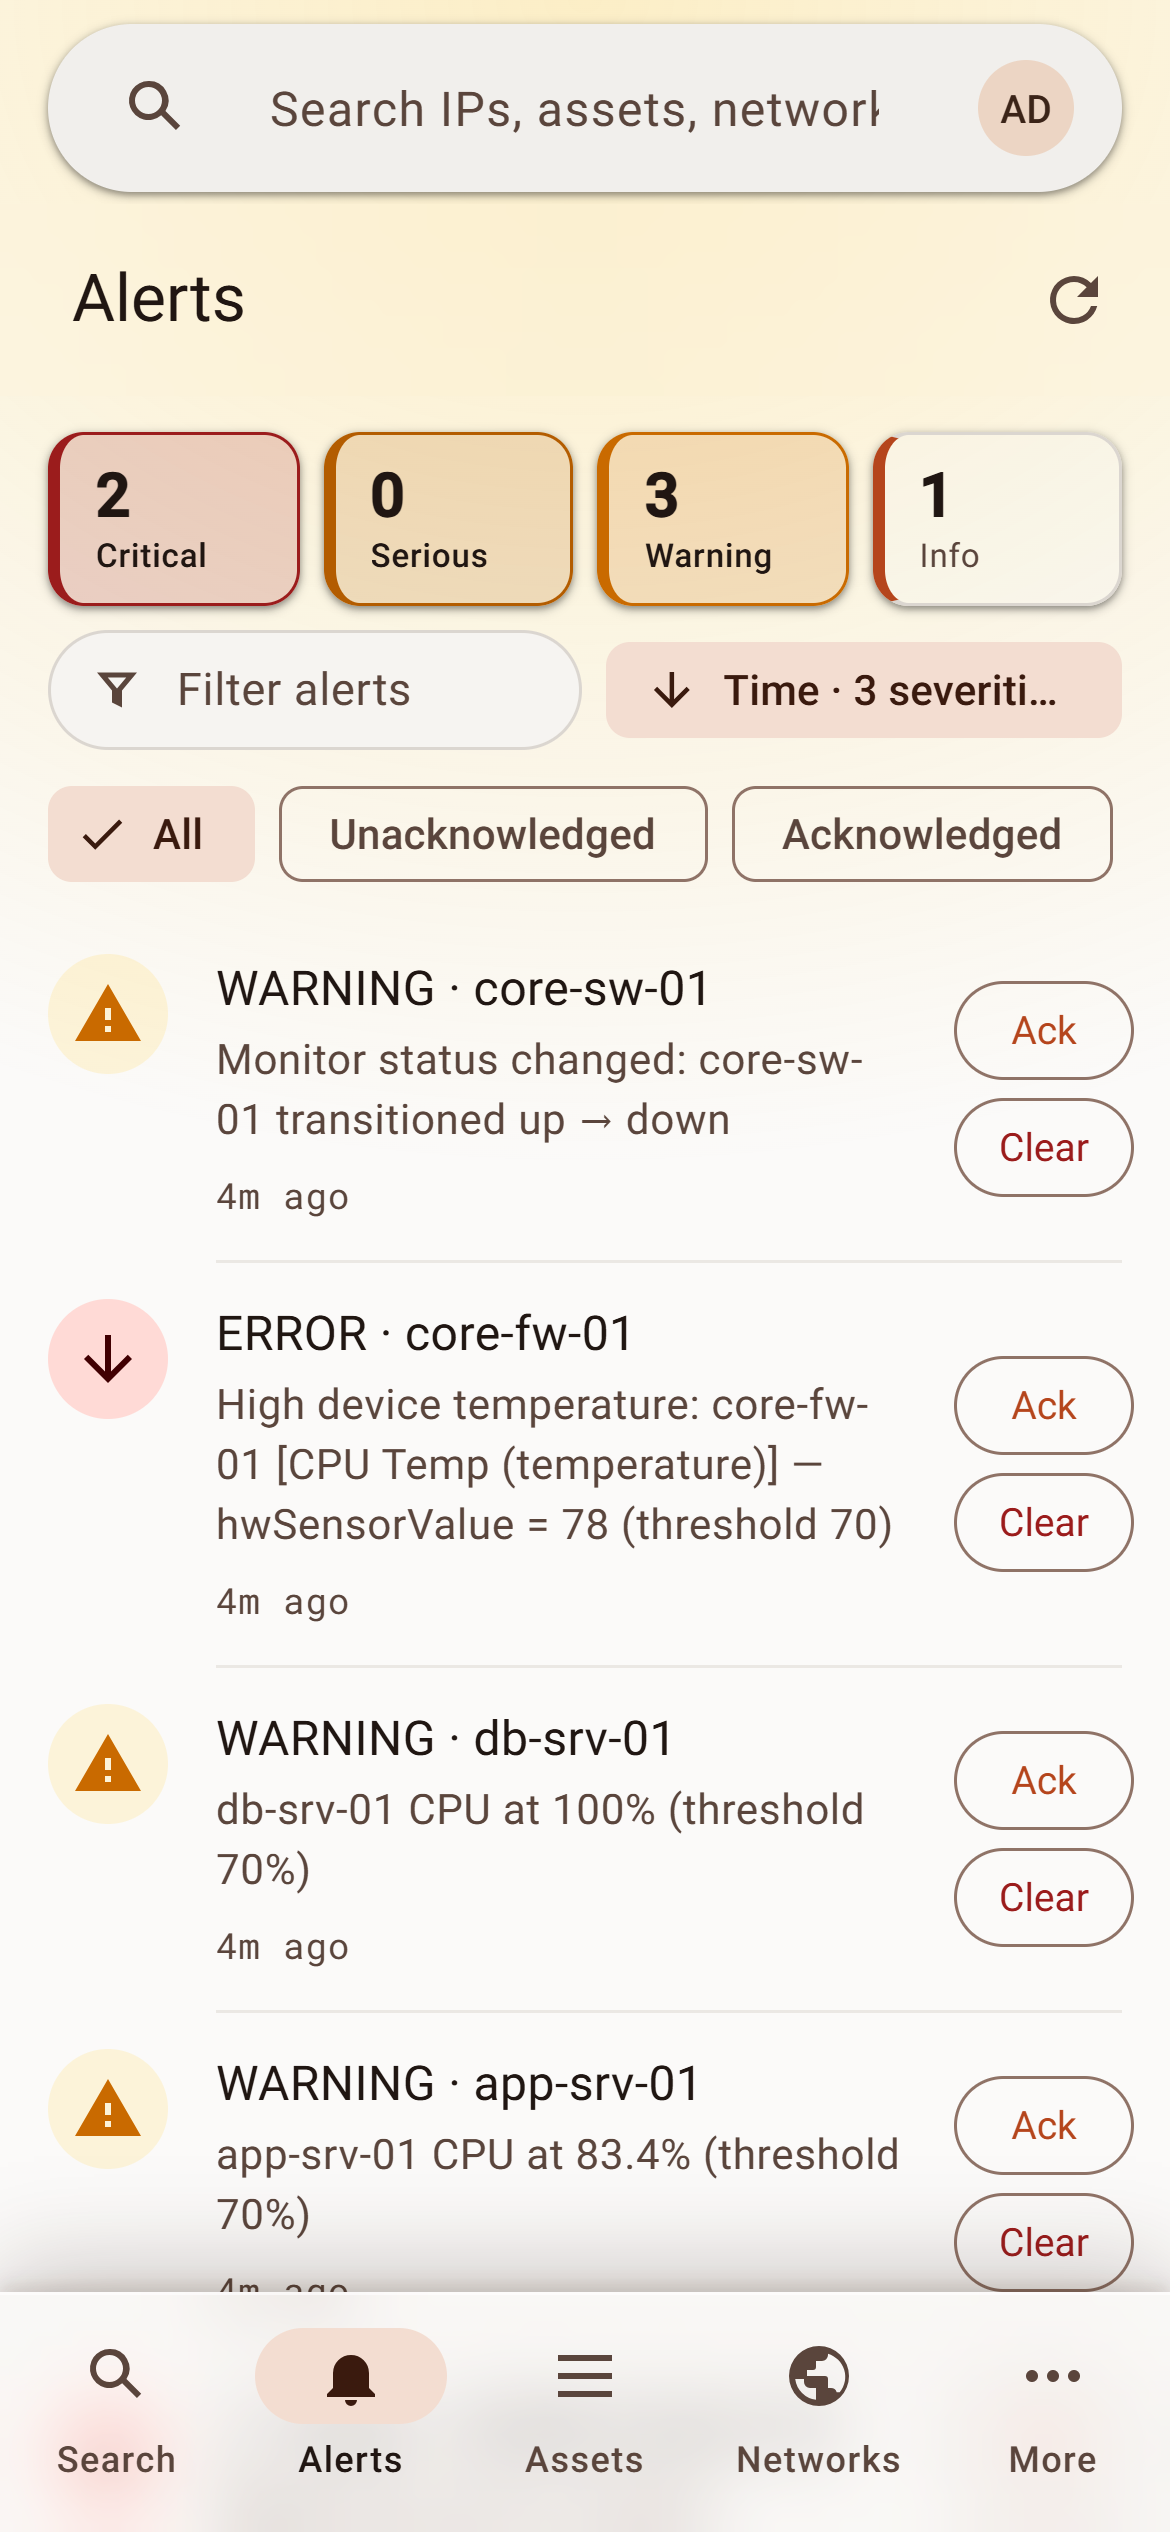
An installable PWA with push notifications. Phones hitting / are
redirected to it; ?desktop=1 escapes. The Open device link in an alert
email or push (and the {asset.link} token) lands here too when opened on a
phone — the link is one address for everyone, and Polaris picks the phone app
or the desktop page when it is opened. Add ?desktop=1 to that link to force
the desktop page.
The tab bar is Alerts · Assets · Networks · More — or, when your role includes the AI Assistant and an AI Assistant integration is enabled, Alerts · Assets · Networks · Chat · More. The app opens on Alerts.
Search is the magnifier at the top right of every screen, beside that
screen's own buttons. Tap it and the search box opens across the top, with the
keyboard up, over a list of the scope shortcuts (asset: or a:,
network: or n:, and the rest) and what each one narrows to; tap a shortcut
to start a scoped search. Results appear as you type. The arrow at the left of the box (or Esc on a
keyboard, once to clear and again to close) closes search and returns you to the
page you were on.
Chat is the same assistant as the desktop's chat
button: the same saved conversations, lookups made with your own permissions,
reports to download as CSV or Markdown, History and New in its top bar,
and the same fresh chat after the integration's idle time (/resume goes back).
Opening Chat continues the conversation you were just having on the desktop,
if you used it within that idle time (30 minutes unless the integration says otherwise).
The text box grows to three lines as you
type, then scrolls inside. While the keyboard is open the navigation bar steps
aside and the conversation scrolls in the space above the text box, so you can
scroll up to read earlier answers while you write; if you were at the newest
answer, it stays in view as the box grows.
The More tab holds the rest, top to bottom: the Device Map (sites and
topology; a legend at the bottom left names each marker colour: Up, Warn, Down,
Maint, Unmonitored, Unknown) and Blocks; Events (the audit log, last 7 days); the Notification
preference; Add to Home Screen when the app is not installed yet; the
theme strip (tap to move through the day, as the desktop's theme band
does; on Android the phone's status bar takes the theme's colour too); your Account; Desktop view; and Sign out. Its Account row shows your name, your
role and, under them, the regions and tags your account is scoped to — the ones
from your role, your user and your sign-in groups together, regions first. An
account with no tag scope shows no tags there.
Alerts
Every active alert you can see, newest first. Across the top, a severity breakdown counts them (Critical, Serious, Warning, Info, Notice; a severity with nothing in it is left out). Tap a count to show only that severity, and tap more than one to combine them. The counts follow the other filters but not the severity one, so they don't move while you tap through them. It opens on Critical, Serious and Warning, so Info and Notice alerts are counted but not listed until you tap their tile, or pick Any under Sort & filter. A selected severity with no alerts still shows, at 0, so you can unselect it. The same filter field and sort chip as the lists below: the field matches device and message, the chips above the list show All, Unacknowledged or Acknowledged, and the Sort & filter sheet orders by Time, Severity or Device and narrows to one or more severities (Critical also catches alerts recorded as "error"). If your account carries region tags, the sheet also offers My regions (the default) or All regions. My regions shows alerts on devices in your regions plus system alerts that aren't about any one device; alerts on devices with no region tag only appear under All regions. If your role limits you to your regions, All regions adds only those untagged devices; for an administrator it is the whole fleet. Whatever the sheet is narrowing by is named on the sort chip, so the list is never filtered by something you can't see. Your choices are remembered on that phone.
Tap a row to open its device; tap Ack to acknowledge (alerts:write) or
Clear to clear it (alerts:fullwrite). Clear asks first: it stops
escalation and runs the automation's reset actions. The tab loads the newest
500 active alerts; when more are active, the count under the list says so.
Assets and Networks
Both lists carry a filter field and a sort chip above their chips. The chip opens a Sort & filter sheet; a choice applies as soon as you tap it, and tapping the selected column again flips its direction. Your sort (and on Assets, the status filter) is remembered on that phone; the filter text is not.
On Assets you can pick several statuses at once — Down and Missed together, say — and the list shows assets in any of them. The statuses you pick move to the front of the row, right after Any, in the order you picked them. Tap one again to drop it, or tap Any to clear them all.
| Filter | Sort by | Extra filter | |
|---|---|---|---|
| Assets | hostname, DNS name, IP, MAC, asset tag, assigned-to | Recently added, Name, IP address, Status, Type, Last seen | monitor Status (Down, Missed, Dep. Down, …), one or several — named on the sort chip while it applies |
| Networks | name, network, purpose, VLAN, FortiGate, block, tags — every word must match | Name, Network (address order), Utilization, Reservations, VLAN | the All / Available / Reserved / Deprecated chips |
On Alerts, Assets and Networks the controls above the list (the severity counts, Assets' tab row, the filter field, the sort chip and the chips) stay at the top while the list scrolls under them. The list passes under the page's title bar as well, and fades out as it goes, so the title bar and the controls read as one frosted band. Every sheet that slides up does the same with its header: its title and its close button (and, on a device, the screenshot and refresh buttons) stay at the top however far down you scroll.
Your desktop Assets tabs are on the phone too. If you have built tabs on the desktop Assets page, the Assets list shows them as a row of tabs at the top, and each one applies that tab's filters and sort. The phone opens on the tab that was last active on the desktop. After that it remembers its own choice, and changing tab on the phone does not change the desktop's. The filter field, type chips and Sort & filter sheet narrow the list further within the tab, and each replaces the tab's setting for the same field: a type chip replaces the tab's Type filter, a status pick its Status filter, and a sort its sort.
Clear a desktop filter from the phone. When the tab showing carries a filter, a Clear filters chip leads the chip row. Tapping it clears the tab's column filters and keeps its sort, the same as Clear Filters on the desktop. If the tab has a base filter, the chip reads Reset filter and puts the tab back to that base instead. The reset is saved to the tab, so the desktop shows it too. The chip goes away once there is nothing left to clear.
Favorites belong to the tab, as on the desktop. The tab's starred assets come first in the list and show a filled star, and the tab names how many it holds. Tap a star to add or remove a favorite. The change is saved to that tab, so the desktop shows it as well. A tab holds up to 500 favorites. With no desktop tabs, the list has no tab row and no stars.
Tapping a network opens its addresses in a sheet over the list, so your filter and scroll position are still there when you close it. A reserved address expands to its details and verbs — Reserve (a DHCP lease), Edit, Release / Revoke, Open asset; a free one opens the Reserve form. A FortiGate VIP or interface address belongs to the device's own config and offers no Edit or Release. The + Reserve button on the Networks tab takes any address and finds its network for you.
Tapping an asset opens its detail sheet. Its header (the device name, which opens the edit menu, and the screenshot, refresh and close buttons) stays at the top of the sheet. The refresh button in its header (or pulling the sheet down) re-reads what Polaris has for the device and repaints the sheet, keeping the sections you opened; it does not poll the device. The sheet does not refresh on its own, so tap it to catch up with the latest poll. Response Time, CPU + Memory, Hardware Sensors and Interfaces each name the polling method that collects them beside the title (Not collected when nothing does), and CPU + Memory has its own 1h · 24h · 7d range. On a switch with PoE ports, Interfaces opens with a count of ports delivering, searching and faulted, naming the faulted ones, and each port shows its PoE state. Tapping a monitored interface shows its usage and error graphs (1h · 24h · 7d) along with its PoE state and class. Under the status pill, a device with a table to read carries a button for it, below View SD-WAN on a firewall that reports SD-WAN:
| Device | Button | What it shows |
|---|---|---|
| Firewall | View ARP Table | the neighbour cache by interface, with the same Current / Last hour … Last 30 days range as the desktop tab (ranges past retention are greyed) and a filter over IP, MAC, interface and hostname |
| Switch | View MAC Table | the forwarding database by port, each port marked access port or uplink / trunk; entries on trunk / LAG pseudo-ports are hidden until you tap Show |
| Monitored access point | View Wireless | each radio (band, channel, width), the SSIDs it broadcasts, and the clients on each. Clients that match no broadcast SSID are listed under their own heading, not dropped |
A client or neighbour Polaris matched to a known device links to it, and tapping it opens that asset. The sheets are read-only; the reload button re-reads what Polaris has stored, not the device itself.
A switch, access point or FortiGate can be upgraded from its sheet. When the Repository holds newer firmware for the device, its OS row under General carries Upgrade to <version>. Tapping it opens a confirm sheet naming the device, its serial, what it runs now, the image it will get and the login it will use. Upgrade starts it; the phone says Upgrade started, and the row then follows the run — signing in, uploading, erasing / writing / verifying with a percent on a switch, rebooting, verifying, waiting for monitoring to answer — and ends on the result. The same sheet has a Schedule for later box: tick it, pick a date and time (your phone's time zone) and who gets the results email, and Schedule books it instead of starting it. When the device cannot be upgraded right now, the button still shows and the sheet opens with the box ticked and locked. A pending booking shows in the row — when, to what version, who hears about it — with Change and Cancel. The button needs Read-Write on Assets; below that the row says the version is available. The phone offers the model's primary image only: picking its backup, and the run history and its log, are on the desktop's Firmware card, and the Repository itself is desktop-only. See Assets → Firmware. When the Repository holds an active image for the device's platform and the device runs exactly that version, the OS row says ✓ Up to date; a device running something newer than the Repository's image, or one the Repository has no image for, shows no mark.
The Uptime row reboots the device. Under General, Uptime shows how long the device has been up and when it last started (frozen while the device is down). On a FortiGate, FortiSwitch, FortiAP or Polaris Agent host that Polaris is allowed to reboot, the row carries Reboot… (Assets → Reboot, rule 115). It opens a confirm sheet naming the device, how the reboot will be sent and what signs it, and says what goes down with it; Reboot stays greyed out until I understand this device will go down is ticked. The row then follows the reboot until the device is back, and ends on the result. The same sheet has Schedule for later, exactly as for a firmware upgrade, and a pending reboot shows in the row with Change and Cancel. When the device can't be rebooted right now but can be booked (an agent host that is offline, say), the row offers Schedule reboot… and says why. When nothing allows a reboot, the row says what is missing. Pressing it needs Read-Write on Assets. A device that reports no uptime and can't be rebooted from Polaris has no Uptime row.
Tapping the asset's name acts on it or edits it. The name at the top of the detail sheet opens a menu. First come the desktop header's two device verbs: Discover Now (Assets → Discover Now; for a FortiSwitch or FortiAP it runs the controller FortiGate's discovery — tap the refresh button a minute or two later to see what it found) and Reboot, the same confirm sheet as the Uptime row's button, shown only when Polaris can reboot the device. Both need Read-Write on Assets. Below them are the same three tabs as the desktop's Edit Asset dialog. Each tab opens its own sheet, which reads the asset fresh and saves only its own fields:
| Entry | What you can change | Needs |
|---|---|---|
| General | hostname, IP address (or Revert to discovered IP), serial, asset tag, manufacturer, model, type, status, location, department, assigned-to, OS, coordinates, purchase dates and order, description, notes, tags | Read-Write on Assets |
| Monitoring | monitoring on or off, and per stream (Response Time, CPU/Memory, Hardware Sensors, Interfaces, LLDP, Storage) the polling method, its credential and MIB, the poll interval and the timeouts. Each inherited value names the tier it comes from, and Response Time says which automation declares the device Down and after how many missed polls | Read-Write on Assets |
| Maintenance | the windows open now and the schedules covering the asset, with Remove this asset and Delete schedule, and Enter maintenance until a date and time in the server's time zone | Read on Assets to look; Read-Write on Maintenance to act |
An entry you can't use is shown greyed with the reason. The phone asks the same questions as the desktop before a save lands: a new IP another asset holds (rule 40) or one Polaris has little evidence for (rule 103) is confirmed first, and a decommissioned, disabled, storage or quarantined asset cannot be monitored (rule 10). With the Polaris Agent installed, the Monitoring sheet shows the agent's state instead of polling methods. Deleting an asset, adding a tag to the tag list, installing the agent and merging two records are done on the desktop. See Maintenance windows.
A reservation is seen and changed in its network.
Installing it
Open Polaris on the phone and use the browser's Add to Home Screen. The app identity — name and icons — is generated per install from your branding.
Long-press the installed icon (Android) for shortcuts straight to Alerts, Assets, Networks and the Device Map.
The manifest and icon routes are deliberately unauthenticated: a
<link rel="manifest"> is fetched with credentials omitted, so a gated manifest
would 401 for everyone.
On iOS, Web Push only works from a home-screen-installed app. Apple grants it to installed PWAs only — but the browser reports push support in plain Safari from 16.4, so the app would otherwise prompt for something that always throws. Polaris says "Add to Home Screen to receive push here" and choosing a push-bearing preference routes you to the install instructions and saves nothing. A preference this phone cannot honour, chosen on this phone, is a promise Polaris would break.
Notifications
The More tab's Notifications row is a preference, not a switch. It names your account's current choice — Email / Push / both — and its supporting line is about this phone: "tap to allow push on this phone", "blocked in your browser settings".
That split matters: the preference can be perfectly saved and still reach nothing here.
Push enrollment is reconciled at boot, not only when the More tab is opened — the point of storing the preference on the account is that a device you never touch again still honours a choice made somewhere else.
It never prompts on boot (a page load has no user activation), so it can only enroll a phone that has already granted notification permission. A phone that has never been asked is instead asked once, on the first sign-in while your account prefers push: a sheet offering Enable or Not now. Dismissing it — either button, or a tap outside — is final on that phone, and the More tab's Notifications row is the way back.
On iPhone and iPad outside the installed app you are not asked at all, for the reason above: add Polaris to your Home Screen first and the offer follows.
Alerts reach the phone in four places
| Surface | |
|---|---|
| The Assets tab | a device with live alerts carries a strobing Alerts control beside its hostname, coloured by the worst one. It goes steady once everything on it is acknowledged |
| The per-asset alerts sheet | one card per active alert, with Acknowledge (alerts:write) per row plus one batched control, and Clear (alerts:fullwrite) |
| The asset detail sheet | the same flag on its hero, beside the monitor pill |
| The Alerts tab | the fleet-wide list, filterable and sortable, and where a push notification opens. Acknowledges in place |
Search results carry the same statement reduced to a dot — deliberately not a tap target, since the row opens the device.
Acknowledge notes and clear confirmations use sheets, never window.prompt or
confirm, which are suppressed in some installed PWAs.
Push notifications
A push carries at most two tray action buttons — the platform limit — sliced from the end of this priority order:
- Acknowledge — the only one that changes state. It opens the page rather than acting from the tray, because that is where the note is typed and the session is what records who did it.
- Open device — deliberately not the body tap's destination, which is the alerts list.
- Ignore — only on an alert that requires interaction. It closes the toast and sends nothing: a tray button carries no session, so it cannot mean "handled". The alert keeps repeating and escalating.
iOS and Safari render no action buttons at all, so the body tap is the path there.
An all-clear carries no Acknowledge action — there is nothing to acknowledge.
Signing out
An explicit Sign out draws the login form once, even where a silent SSO provider would otherwise sign you straight back in. The desktop counterpart is a form-less signed-out page.
The app is online-only.
Dash wallboard
An unauthenticated, read-only duplicate of the Dashboard at /dash, for NOC
wallboards and kiosks. Served by its own process.
Off by default. Enable it at
Server Settings → Web Server → Dash Wallboard,
with a source-IP scope: rfc1918 (the default), all, or custom CIDRs.
Unauthorised source IPs are silently dropped — socket destroyed, no HTTP response — rather than 403'd, so a scanner cannot confirm the surface exists. Behind nginx that manifests to the remote client as a 502.
What it can show
The wallboard answers as the built-in readonly role. Widgets that role
cannot read hide themselves.
Acknowledgement notes are never shown on the wallboard. They are typed by operators about live incidents, and the wallboard has no login, so its ack pills name the owner but hovering them shows no note.
Its Dashboards ▾ menu offers:
- "My layout — this browser", kept in that browser's storage;
- every public saved dashboard.
A session-less caller gets public rows only, and every write verb 405s app-wide — so a wallboard viewer can build a local layout or show a published one, and can never save either to the server.
The choice is pinned per browser and restored at boot. A 5-minute poll re-reads it and re-renders only when it has actually changed. A dashboard deleted or unpublished under a live wallboard falls back to the local layout with a notice.
Publishing a dashboard for it
Build the layout on the normal Dashboard, save it, and set its visibility to
public — which needs savedDashboards:write.
That level is the escalated one on purpose: publishing reaches every operator and an unauthenticated wallboard.