Assets - rogers-group-inc/polaris GitHub Wiki
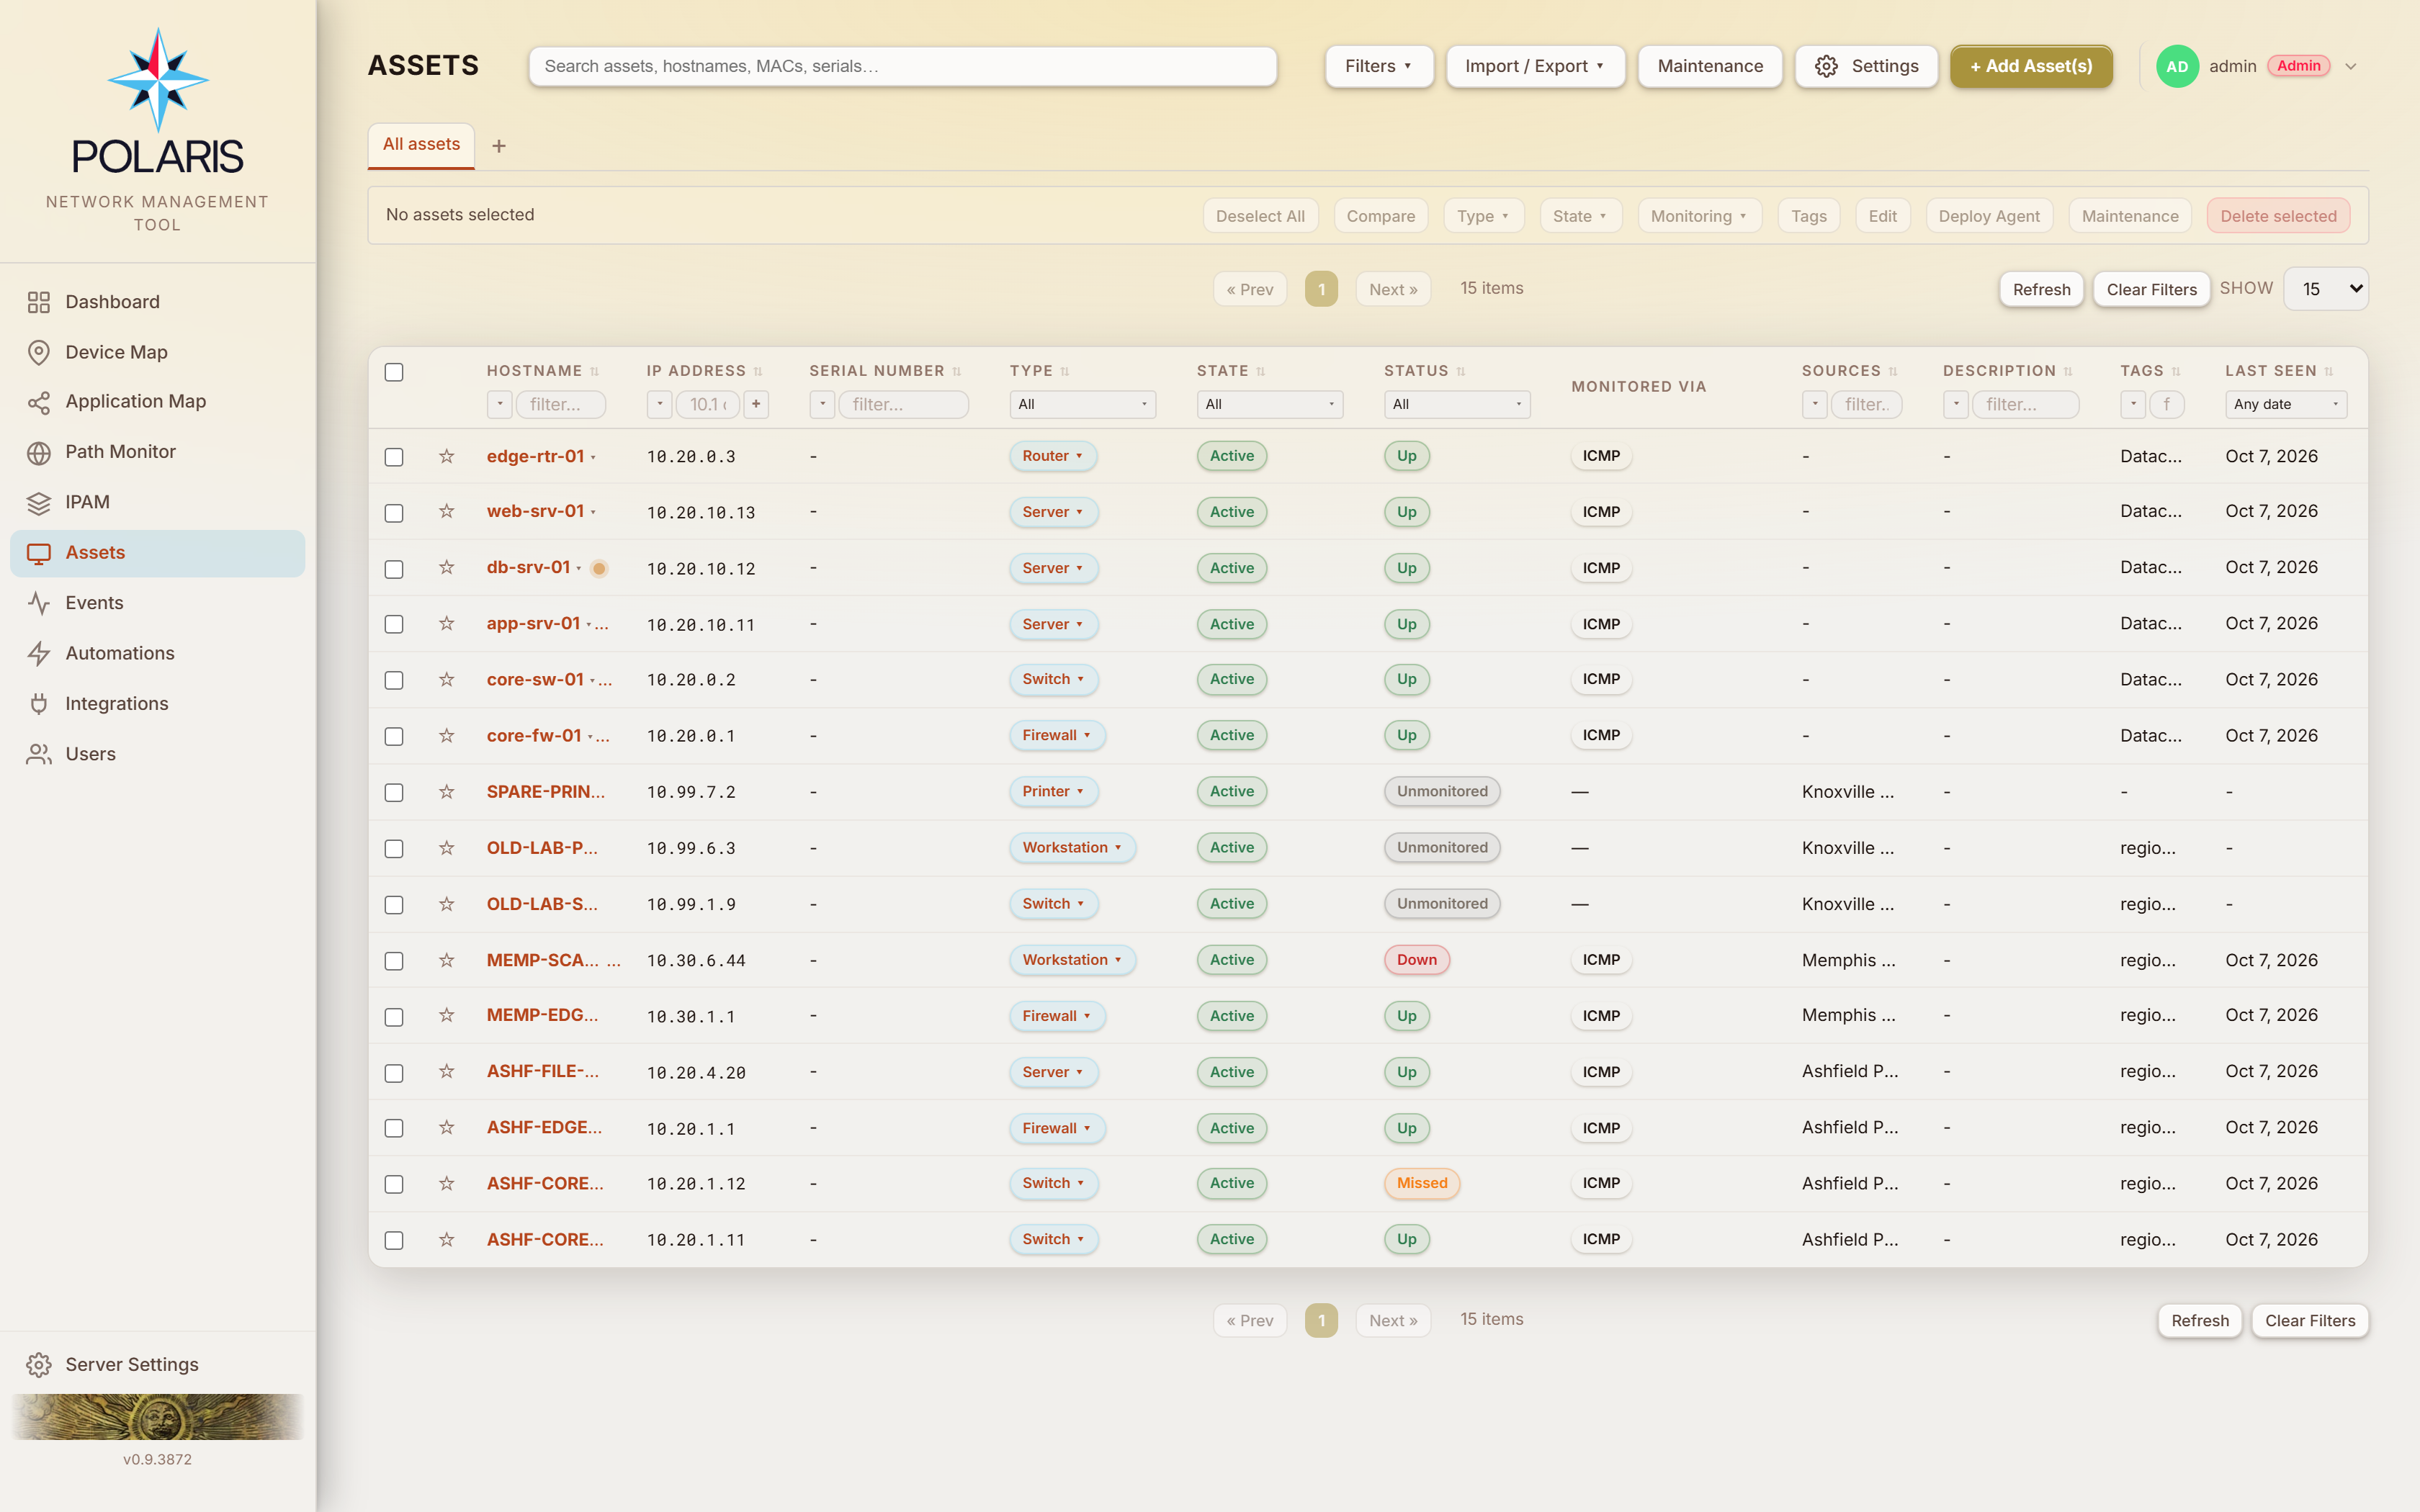
The device inventory, and the page most operators live on. Everything Polaris knows about a device is reachable from here.
| Gate | Grants |
|---|---|
assets:read |
see the page |
assets:write |
add and edit rows, the bulk Type / State / Monitoring / Tags / Delete actions, mass-pin, start / stop / restart / update an Unraid or TrueNAS workload |
assets:fullwrite |
deploy the Polaris Agent (install / retry / reinstall / upgrade / uninstall), delete others' saved filters |
Agent deployment sits at fullwrite on purpose (rule 43):
it runs an installer on someone else's host over a stored credential and leaves
a service behind. That is not the act assets:write — fix a hostname, retype a
serial — describes.
Columns: Hostname · IP Address · Network · Serial Number · Type · State · Status · Monitored Via · Sources · Description · Tags · Asset Tag · Manufacturer · Model · OS / Firmware · MAC Address · Assigned To · Purchase Order · DNS Name · Latitude · Longitude · Last Seen.
Columns are sortable, inline-filterable, resizable and hideable. Column order is per view tab; widths and visibility are per screen. Network, Asset Tag, Manufacturer, Model, OS / Firmware, MAC Address, Assigned To, Purchase Order, DNS Name, Latitude and Longitude start hidden.
The star left of Hostname marks a favourite. Favourites pin to the top of the list, and each view tab keeps its own set.
Monitored Via names the polling method actually in use — ICMP, SNMP,
REST API, Agent, vCenter, FortiManager, Unraid, TrueNAS, Proxmox and so on —
resolved per stream as Polling methods describes. An asset
whose streams use more than one reads Multiple, with the list in the
tooltip; an unmonitored asset reads —.
IP Address filters by network, not by text. Type the first one, two or
three octets (10, 10.1, 10.1.2) to see every device in that range —
10.1 never matches 10.10.x.x — or a network in CIDR form (10.1.16.0/20,
192.168.5.128/25) to see just the devices inside it. A full address matches
that one device. The + beside the box adds another box, as many as you
like, and a device shows when it is in any of them; × removes one. A
box that isn't a valid prefix or CIDR is outlined red and ignored. The ▾
menu still offers Is empty / Is not empty. The filter looks at each
device's primary IP.
Network (hidden by default — turn it on from the column gear) names the
IPAM network the device's primary IP sits in: the most specific
non-deprecated network that contains it, the same one View Lease opens.
Hover it for the CIDR; a device whose IP is in no recorded network shows -.
Tags lists the asset's tags. Click its filter box to open Filter by
tags: the same coloured tag chips as the asset's Edit form, grouped by
category and all shown at once. Tags mirrored from Azure by the Azure Arc
integration appear too, under Azure Tags in the colours Server Settings →
Tags gives them, though you can't add them in the Edit form. An Other tags in
use group lists tags that are on assets but not in the tag list (ones added by
discovery, for example). Discovery's prev-entra: and prev-ad: bookkeeping
tags are left out. Click chips to select as many as you like, then click OK.
Nothing changes until you click OK; Cancel, Escape or the × leaves the
filter as it was, and Clear deselects everything. Any (the default)
shows assets carrying at least one selected tag; All shows only assets
carrying every one of them. Include untagged assets adds assets with no
tags (with Any only). Tags match exactly, so selecting Production does
not also show Production-DR. Once applied, the box reads the tag's name when
one is selected and "N selected" when several are; hover it to see the full
list. A saved view from before this dialog existed keeps its old text filter
(the box shows it in quotes) until you pick tags and click OK. Sorting orders
by each asset's alphabetically-first tag, and untagged assets sit at the
bottom whichever way you sort.
State is the asset's lifecycle: active, maintenance, decommissioned,
storage, disabled, quarantined.
Four of those cannot be monitored at all — decommissioned, disabled,
storage, quarantined (rule 10). Staging one of
them forces monitored = false and resets the failure counter, in every write
path. The two operator-facing paths (the edit form and bulk-monitor) refuse
with a reason rather than leaning on the silent clamp — a form that saves and
comes back unticked reads as a bug.
quarantined parks the flag so releasing a quarantine restores status and
monitoring together; otherwise releasing would hand the device back to the
network with nobody watching it. Flipping a status back to active does not
auto-resume monitoring — re-enabling is deliberate.
maintenance is deliberately not on that list: a window pauses polling
while monitored keeps your intent, so it survives the window.
Status is the monitor pill, and it has six values — see
Monitor states, which also lists the
overlays (Dep. Down, Maintenance, Standby…) that can replace them. With
assets:write, click it to toggle monitoring. An unmonitored pill instead
opens the edit modal on the Monitoring tab, so you set the polling method before
enabling; the disable direction confirms inline, and for a
maintenanceManagement holder the same popover offers enter maintenance mode
until… a time you pick. A Maintenance pill offers to end the window early.
A device with a live alert carries a strobing dot to the right of its hostname, coloured by the worst active alert. It stops moving once everything on it is acknowledged — motion means unhandled, not "bad".
prefers-reduced-motion drops it to a steady rendering, and the title text
carries the whole message: neither colour nor motion reaches every reader.
A strip on the table's top-left edge, below the bulk bar, sharing its row with Filters, Refresh (the circular-arrows icon), Clear and the page size (25 / page …) (the page buttons are below the page card). Each tab holds its own filter and sort state, saved to your account so it follows you between browsers. Click switches, double-click or F2 renames, ✕ closes (never the last one), + adds.
Filters ▾ saves the current column filters + sort as a named preset, loads
one back into the current tab or a new one, and deletes them. Presets are
server-side. Private is the default; publishing needs assets:write, deleting
someone else's needs assets:fullwrite.
Each row's menu carries Open and, with assets:write, Edit…; then
Open HTTPS, Open RDP and Open SSH where the device has that
management surface (the same verbs as the slide-over header — a Fortinet device
offers what its allowaccess permits, a server RDP and SSH); Quarantine… or
Release quarantine for an assetsQuarantine holder when quarantine push is
on for some integration; and Delete.
Select rows to raise the bulk bar:
| Action | Needs | Does |
|---|---|---|
| Compare | assets:read |
overlays telemetry charts for two to ten devices, after a metric picker; with more than ten selected the button greys out in yellow |
| Merge | Assets full read-write (the button appears for the admin role), exactly two selected | opens the merge modal with the target pre-selected |
| Type ▾ / State ▾ | assets:write |
sets the asset type or lifecycle state on every selected row. A state that cannot carry monitoring turns monitoring off (rule 10) |
| Monitoring ▾ | assets:write |
Enable or Disable monitoring on the selection. Assets in a state that cannot be monitored are refused with a reason |
| Tags | assets:write |
pick tags, then Add them (each asset keeps its own tags), Remove them (from the assets that have them), or Replace all tags (each asset ends up with exactly the picked set) |
| Edit |
assets:write, exactly one selected |
opens the edit modal |
| Deploy Agent | assets:fullwrite |
one modal collects SSH + WinRM credentials and arch; OS and transport are resolved server-side, an asset whose last install failed is retried, and other ineligible assets come back as skips with reasons |
| Maintenance | maintenanceManagement |
opens the schedules modal with the selection pinned as explicit asset ids |
| Upgrade |
assets:write, FortiGates / FortiSwitches / FortiAPs under one FortiGate |
schedules a group firmware upgrade in dependency order — see Group firmware upgrades. Turns red when the selection spans more than one FortiGate; clicking it then explains why |
| Quarantine selected / Release Quarantine | assetsQuarantine:write |
pushes or lifts the MAC block on every FortiGate that has seen each asset |
| Delete selected | assets:write |
deletes the selection after a confirmation — see Deleting an asset |
Replace keeps two kinds of tag on every asset: Device Map region: tags
and the discovery breadcrumbs prev-entra: / prev-ad:. Wiping region tags
across a large selection would silently drop those devices out of every
region-scoped user's and alert rule's view. To take a region tag off, pick it
and use Remove. Replace with nothing picked clears every other tag, and asks
first.
A selection past the 500-id cap is refused with the count, rather than 400-ing after you have filled in the form.
Upgrade on the bulk bar books one firmware upgrade for a FortiGate and the FortiSwitches and FortiAPs behind it, and runs them in dependency order (rule 122). It uses the same images, device logins and checks as a single-device upgrade from the Firmware card.
One FortiGate at a time. Every selected device must sit under the same FortiGate and come from the same integration. The button is:
- grey with nothing selected, or when a selected asset is not a FortiGate, FortiSwitch or FortiAP;
- red when the selection spans more than one FortiGate, or includes a device Polaris cannot place under one. Clicking it lists each FortiGate with the devices selected under it, and Keep only these narrows the selection to that one;
- normal when it is one FortiGate's devices. Clicking it opens the booking dialog.
Only one group upgrade can be scheduled or running per FortiGate. Cancel the existing one first.
The booking dialog shows:
- the upgrade order, by stage: access points first, then the switches above them, then the FortiGate;
- the devices dropped from this schedule, with why: already on the newest image, no image for its platform in the Repository, an HA cluster member, no address, or no device login bound;
- any devices that already have their own upgrade scheduled. Booking the group cancels those, and you must tick a box to confirm it;
- Run at (your local time), At once (how many devices on separate branches may upgrade at the same time, 1 to 10), and who gets the summary email.
How it runs.
- A device never upgrades while a device above it, below it or paired with it (MCLAG) is upgrading.
- A device only upgrades once everything behind it finished cleanly.
- If a device fails or comes back unverified, every device above it is skipped and nothing is sent to them. The other branches carry on.
- Each device's health is checked just before it starts. One that is down, warning, recovering, behind a parent that is down, or not monitorable is skipped, and the next device starts. A device skipped for health does not stop the devices above it.
- A device that was upgraded some other way since the booking is recorded as already current.
- If a newer image was made primary since the booking, the device is dropped rather than given an image nobody approved.
While a group is scheduled or running, a device in it cannot be scheduled on its own. While the group is running, it cannot be upgraded on its own either. Its Firmware card says Part of a group upgrade and links to the group.
The group's progress opens after you book it, from the device's Firmware card, or from its item on Events → Calendar. It shows every device's state, why it was skipped or dropped, and the stage of a running upgrade. Cancel group upgrade (before it starts) sends nothing. Stop group upgrade (while it runs) lets the devices already upgrading finish and starts nothing else.
One summary email goes out when the group finishes, or when it was stopped or missed. It lists, in order:
- the devices that failed (with the stage they stopped at) or came back unverified;
- the devices skipped for health, with what was wrong;
- the devices skipped because a device behind them did not finish cleanly, naming that device;
- then what was upgraded (from → to), already current, and dropped.
FortiAPs managed by a FortiGate often have their own web interface turned off, and the upgrade talks to each device directly. The dialog warns on every FortiAP that has never been upgraded successfully: if it fails, the switch and FortiGate above it are skipped.
Click a row. Tabs, in order, each shown only where it applies: General · System · Wireless · SD-WAN · IPsec · Paths · MAC Table · ARP Table · Services · Software · Quarantine · Events · Alerts · Custom MIB · SNMP Walk · Sources. General, System and Sources are always there.
Three are device-type specific: Wireless on a monitored access point, MAC Table on a switch, ARP Table on a firewall.
The rest are conditional:
- SD-WAN — on a FortiGate that has reported SD-WAN data.
- IPsec — on a FortiGate that has reported IPsec tunnels or connected peers.
- Paths — on a host that runs at least one path check.
-
Services and Software — only when something is actually pulling
that information in for this asset: Services when the Polaris Agent
reports its services or processes, or agentless process polling does;
Software when the agent, Intune or Azure Arc reports installed software.
A host none of them cover has neither tab. Never on Fortinet infrastructure
(firewall / switch / access point) or the
othercatch-all. -
Quarantine — for an
assetsQuarantineholder, on an asset with a MAC when quarantine push is turned on for some integration, and always on an asset that is already quarantined, so Release stays reachable. -
Events — with
events:read. Alerts — withalerts:read. - Custom MIB — when the asset's manufacturer profile defines custom widgets (Server Settings → Credentials → Manufacturer Profiles).
- SNMP Walk — with the Asset Probes permission, and only when at least one monitoring stream actually resolves to SNMP for this asset.
The header also carries Copy and Screenshot (below), Open HTTPS /
Open RDP / Open SSH where the device has them, and Edit for
assets:write. Edit opens the edit modal (General · Monitoring, plus
Maintenance where it applies) over the panel and returns you to it.
Right of the device's name, on every tab, are its two verbs:
Discover Now and Reboot.
The slide-over header carries Copy and Screenshot, and both act on the tab you are reading — not on the whole asset.
Copy writes the tab out as plain text: labelled values, tables as rows, headings kept. It is the form to paste into a ticket, a change record or a chat.
Screenshot opens a picker first. Every section of the tab gets an include checkbox (your choices are remembered per tab), chart sections get a time-range choice that starts on whatever range the chart is currently showing, and the Interfaces section can be told to include the interfaces it is hiding. On Capture, Polaris renders the tab at a fixed width — so the image looks the same whether your window is wide or narrow, or the panel has been dragged to a new size — and copies it to the clipboard as a PNG. Charts, badges, colours and your theme all come across as they appear on screen. On the Events tab the button gives way to an Export dropdown instead (CSV or PDF, this page or every event for the asset).
Individual tables and charts have their own camera buttons: for a table, beside its column-chooser gear, and for a chart, in its corner. A table's camera captures just that table exactly as it is drawn for you — the columns you have visible, in the order and widths you have set, with the status dots, health-check chips and coloured per-scrape strips intact — titled with the table name and the device. Rows hidden underneath a collapsed parent are left out, and the image says how many, so it cannot be mistaken for the full list: expand them first if you want them in.
Copying to the clipboard needs a browser clipboard permission, and on most
browsers an HTTPS page (or localhost). On a plain-HTTP install the
capture still runs but the copy is refused, and the toast says so.
These four are not charts. Each is a picture of what the device answered the last time Polaris asked — connected clients, a forwarding database, a neighbour cache, the peers on its VPN tunnels — and every one of them changes on its own between reads. So all four carry the same heading row:
-
How often it is re-read (
every 10m), resolved for this device, not a fleet-wide figure. -
How old the reading is (
updated 3m ago). It turns amber with a ⚠ once the reading is older than one poll cadence — a poll is overdue. That is a lower bar than the amber Last successful update banner elsewhere in the slide-over, which waits for three; overdue and abandoned are different things. - Poll — re-reads this device now, rather than waiting for the next scheduled pass. It needs the Asset Probes permission, and it is hidden if you do not have it.
Read the pair together. An empty client list beside "updated 30s ago" means nobody is connected; the same empty list beside an amber "updated 2 days ago" means nobody has asked.
The SD-WAN tab's sections carry the same source and age pair, without a Poll button.
Poll dials the device and re-reads its current state. (The Refresh button at the top of the slide-over is different: it only reloads what Polaris already has stored, and never contacts the device.) It does not run a response-time probe, so it cannot mark an asset up or down, and it will not disturb an in-progress outage count. If it reports nothing to poll, this device does not deliver current-state data on its present polling method — monitoring is off, the Interfaces stream is set to Disabled, or a Polaris Agent on the host pushes on its own schedule instead.
Poll is also refused for a device your integration's device filter excludes. A filter you set to keep Polaris off a host keeps this button off it too.
Identity, location, coordinates, description, notes, tags, and the upstream rows: Last Seen Switch, Last Seen AP, Last Seen Firewall. Each resolves the display string discovery stored back to the Asset row behind it, so the row carries verbs — open the device, open its HTTPS UI, SSH to it — instead of being text you re-find by hand. When several switches share the stored name (a per-site "IDF-1"), the row links the one this device actually sits behind — by its MAC table, then by the FortiGate that last saw the device — and stays plain text when nothing settles it (rule 91).
The tag picker in the edit form shows every tag the asset carries except its
azure: tags, which it leaves out. Tags with no
entry in the tag list (Server Settings → Identification), such as the ones
discovery adds (auto-discovered, azurearc, fortiswitch…), appear ticked
under Not in tag list and are kept when you save. Untick one to remove it;
a discovery tag comes back on the next run. azure: tags are never offered in
the picker and are kept on every save, because the Azure Arc integration owns them
(Azure tags on devices).
Resolution never matches a FortiGate by hostname. fortinetTopology.controllerFortigate
holds FortiManager's device name, which diverges from the gate's configured
hostname on real fleets; matching on it fails silently across dependency
suppression, Device Map membership, region tags and auto-monitor. An unresolved
name comes back as the name with no asset — a legitimate state, not an error.
Where the firewall row comes from, in order: the freshest FortiGate sighting → failing that, the gate that owns the containing network. The second is an inference, tagged as such, and it deliberately carries no timestamp — a row headed "Last Seen" must never print one for a device nothing has seen (rule 55).
For a device with an IP and no MAC, switch and AP placement is derived along
one chain (rule 45): IP → the containing network's
owning gate → that gate's ARP table → MAC → the learned switch port with the
fewest MACs, and the wireless station carrying that MAC. Four refusals keep it
honest — another gate's ARP row never counts, two MACs at one address is
ambiguous rather than a pick, a stale address claim is skipped, and evidence
older than 24 hours is not evidence.
Address shows the address monitoring probes. Under it, two pills hold everything else the device has been seen with: hover N IPs for every IP address, each with the network card (MAC) it is on, and N MACs for every MAC with the addresses bound to it. Click any IP or MAC in either list to copy it. The primary pair is first and carries ★ Primary; from the IPs list any other address can be set as primary, and from the MACs list a MAC can be removed (×). The addresses come from a lease or reservation the device is holding, the address a FortiGate sees it using, ARP entries (a card's secondary addresses), the interface table of a monitored device, the interfaces the device's own Polaris Agent reports (source Agent), and anything typed by hand. Each address names where it came from, the gate that reported it, wired or wireless when known, and when it was last seen. A FortiGate's addresses for a card leave the list once that gate stops reporting them (rule 102). Opening the details also checks the DHCP leases and reservations against IPAM: an address IPAM has released, or now gives to a different MAC, is removed from the list, and a lease IPAM records as a reservation is shown as one. Addresses IPAM has no subnet for are left as they are.
A MAC labelled Not on MAC list appears only because addresses name it — an interface of a monitored device, or an address typed by hand — so it has no ×. A MAC with many addresses names its first three in the MACs list; the IPs list has them all.
The primary pair carries ★ Primary. Polaris chooses it from what the gates report (rule 101); with Assets set to Write or higher, Set as primary on any other address pins that pair instead. The pin shows as pinned with an Unpin button, and:
- discovery never changes a pinned address — if the device stops answering on it, the asset shows down and the address is flagged not seen since;
- if that card renumbers to a single new address, the pin follows it after a
day (recorded as
asset.primary_address.followed); - pinning replaces an address typed in Edit, and typing or clearing the IP in Edit releases the pin;
- once the network backs the pinned address better than any other (its
confidence from discovery alone reaches 50 and beats
the rest), the pin is released and discovery manages the address again,
recorded as
asset.primary_address.released. This never happens while discovery is still reporting a different address for the device: the pin stays until three days pass without discovery trying to change it; - Unpin moves the device to the listed address with the highest confidence on the network's evidence, never to an address that is not on the list (unless the list is empty).
FortiGates, FortiSwitches and FortiAPs are monitored on their management IP and offer no pin. A device's port MACs from its interface table are collapsed into one N port MACs pill and are never a primary.
Every address carries a confidence score from 0 to 100, shown as a small chip beside it. The chip is green for high (80 and over), grey for medium, amber for low (20–49) and red for very low. Hover the chip in the asset panel to see what the score is made of (inside the IPs list, hovering the chip shows just the score): each source that reports the address, how recently, how long Polaris has polled it successfully as the primary, and anything counting against it. On the asset list, the IP address and each address in its hover carry the same chip, and hovering the chip shows the score.
Before Set as primary, and before saving a changed IP address in Edit, Polaris checks the address. If the evidence alone scores under 50, it asks first and says what it has seen. A typed address is also pinged once from the Polaris server. You can always go ahead. The weights and the rest of the scoring are in rule 103.
The MAC list names every address Polaris has seen this device advertise, newest first, each labelled with the source that reported it and when. Docks, dongles, randomised Wi-Fi addresses and ZTNA-relayed identities all show up here, which is why the list occasionally names a MAC that belongs to some other device — a shared dock moves between laptops, and a merge can bring a neighbour's history with it.
With Assets set to Write or higher (the built-in assetsadmin role, and
admin) each entry carries a ×. It removes that MAC and the addresses
discovery recorded under it from this asset, releases a pin on it, and makes
the best surviving MAC the asset's identity MAC, preferring the device's real
NICs, as reported by the Polaris Agent, Intune or vCenter, over anything a gate
merely saw. The same × is on the MAC column's hover tooltip on the list,
but the slide-over is the only place it appears for an asset carrying a single
MAC. Every removal is audited as asset.mac_removed.
Removal is a correction, not a block (rule 79). Nothing is suppressed: if the network reports that address against this asset again, the next discovery run adds it back. When a MAC keeps returning, the association is live rather than historical — find what is actually transmitting it (usually a shared dock) instead of deleting the row repeatedly.
One entry can cover many addresses. An interface scrape folds a device's
sequentially-allocated port MACs into a single AA:…:00 – AA:…:2F range row, so
removing it removes the whole block — the confirmation says how many. A range is
a port block rather than an identity, so it is never promoted to primary; an
asset whose only remaining entries are ranges correctly shows no primary MAC.
An asset discovered by an Unraid or TrueNAS SCALE integration gets a section named for the platform. On the host: platform and version, CPU threads, memory, workload counts, a Pools table and a Workloads table linking each VM and container (App on TrueNAS) to its own asset with its state and monitor status. On a VM or container: its host, state, image and version, an Updates line (Update available, Up to date or Not checked), ports and autostart.
With assets:write, a VM or container carries an action bar: Start,
Stop (with a Keep monitoring while stopped box), Restart, and on a
container Update (when one is available) and Check for updates. Every
verb confirms first. Restart and Update hold the workload in maintenance for
their duration; Stop pauses its monitoring unless you keep it, and a Start from
Polaris resumes it (rule 94). Details are on
Unraid → Workload actions.
An asset discovered by a Proxmox VE integration gets a Proxmox VE section. On a node: platform and version, a Cluster row (Node online or Node offline, at last discovery — the live up/down is the monitor status), CPU threads, memory and workload counts; the node's VMs and containers are on its VMs & Containers tab. On a VM or container: its node, state, vCPUs and memory (VMs), network and autostart.
Live telemetry and history: response time, CPU, memory, temperature, interfaces, storage. A FortiGate's IPsec tunnels are on the IPsec tab.
At the top sits the Status row — on a monitored firewall, switch or
access point Simulate Down for assetMonitorSettings:fullwrite
(testing dependency suppression), then the
pill — then
the Last 30 min strip, one cell per probe coloured by the state it left
the device in, and Uptime where the transport reports it.
Each section header says how fresh its data is. Beside the polling-method badge, updated X ago is the last poll that returned data — a failed poll never moves it (rule 118). When the CPU & Memory or Interfaces stream is failing, its header reads ⚠ last poll failed X ago in amber instead; hover it for when the failures started, the last successful poll and the error the device returned. Once the data is older than three polling intervals, an amber banner above the chart or table says Last successful update X ago and adds that error; a stream that has never succeeded shows No successful poll yet with the error straight away. To be told about it, alert on CPU & memory polls failing (minutes) or Interface polls failing (minutes) (Automation triggers).
The Response time chart also draws packet loss. A dashed purple line reads
against a second axis on the right. That axis tops out at the worst loss in
the window (4 %, 8 %, 12 %, 20 %, 40 %, 60 %, 80 % or 100 %), so small loss
stays readable instead of hugging the bottom. Check the scale before comparing
two charts. It counts packets from every probe
Polaris sends the device — the response-time poll and the ICMP packet-loss
sweep — so on a device the sweep reaches it is much finer than the missed polls
on the response-time line. Each point covers a short bucket (two minutes on a
one-hour view, longer on longer ranges; the tooltip names it), and the line
breaks where nothing was probed rather than dropping to 0 %. The Packet
loss figure above the chart is the same measurement over the whole window.
Hovering a response-time point still says whether that poll was missed.
An Unraid, TrueNAS or Proxmox VE workload with no address of its own charts its
response time at 0 ms: its up/down is the platform's state read, which has
no latency (Polling methods,
the proxmox method).
IPsec tunnels are on the IPsec tab, not in the Interfaces table. A FortiGate's IPsec tunnels (site-to-site, dial-up, ADVPN hub and spoke overlays) are listed, pinned and charted on the IPsec tab, and a line above the Interfaces table says how many there are and links to it. Their configured addresses are still tied to the firewall like any other interface IP. GRE and VXLAN tunnels have no IPsec state: on a FortiGate polled over the REST API they appear under Other Interfaces with their configured address, and since FortiOS reports no link state or counters for them there, the status and traffic columns stay empty.
Nested rows: members pin through their aggregate, VLANs pin on their own. The Interfaces table nests an aggregate's member ports and an interface's VLAN sub-interfaces under their parent. A member port has no Poll 1m box of its own, because pinning the aggregate covers the link. Its empty cell names the aggregate to pin instead. A member keeps its box when it is already pinned, or when its aggregate is missing from the table (a FortiLink trunk that is down). A VLAN sub-interface always has its own box: it is a separate segment with its own traffic, and pinning the parent does not cover it. The header checkbox pins or unpins every listed row that has a box, VLAN sub-interfaces included.
An interface name opens the interface — or the network its address is in. Click a name in the Interfaces table to open that interface's history panel. When the interface's address sits inside a network Polaris knows, the click offers Open interface or Open network instead; Open network slides that network's address table in over the asset, scrolled to the address. The choice appears only for roles that can read networks, and only when a network actually contains the address.
CPU & Memory is one chart, or two, depending on what is collecting it. Three sources report CPU per core and memory in bytes, and on those the section splits into a CPU chart and a Memory chart. A Proxmox VE node splits too, for its memory bands, though its CPU chart has a single line:
| Source | CPU chart | Memory chart |
|---|---|---|
| Polaris Agent | one line per logical core | processes / buffers / cache against installed RAM |
| vCenter — VM | one line per vCPU | private / shared / ballooned / host-swapped / compressed against configured RAM |
| vCenter — ESXi host | one line per physical core | consumed / ballooned / host-swapped against installed RAM |
| Unraid / TrueNAS — host | one line per core | used against installed RAM (one band) |
| Proxmox VE — node | one line for the whole node (Proxmox publishes no per-core figures) | Used / ZFS ARC / free against installed RAM |
A percentage and a byte scale cannot share an axis, but they are two readings of the same sample, so the two charts keep one range selector — picking a range, or dragging a window on either, moves both.
Every other transport — FortiGate REST, SNMP, WinRM, SSH — reports one CPU figure and one memory figure per sample, and keeps the single combined chart: both series on one 0–100% axis, with a memory reading in bytes shown as a percentage of the total. There is nothing a second chart could add.
The two memory vocabularies are not translations of each other and never appear in one stack. The agent reports how the guest's own OS is spending its RAM; vCenter reports how the hypervisor is backing it. Ballooning and host swap are invisible from inside a guest, which is why an agent on the same VM cannot show them — and why, on a VM that is being squeezed, the vCenter chart is the one that says so.
Click a legend chip to switch that series off, on either chart — a memory band, the swap line, a CPU core, or the cross-core average. A switched-off chip stays in the legend with a line through it; click it again to bring the series back. On the CPU chart, double-click a core to show only that one, and a Show all link appears whenever anything is hidden.
The two charts remember your choice differently, on purpose. Memory bands are saved to your account and follow you between hosts and browsers — the bands mean the same thing everywhere, so which of them you want to see is a setting. Hidden CPU cores last only as long as the panel is open: core 5 of one server has nothing to do with core 5 of another, so carrying the choice across would hide a different core each time.
On an agent host the Cache band is hidden until you turn it on, and the legend says so.
Page cache is memory the OS has filled with recently-read files because the RAM was otherwise idle — it is handed straight back the moment a program wants it. Counted in the stack it makes a perfectly healthy machine look nearly full, which is the most common way this chart gets misread. With it off, the stack answers how much memory is actually spoken for, and the gap above it is headroom you can rely on.
Turn it on when you want the whole picture. While any band is hidden the legend reminds you that the gap above the stack includes it, and the tooltip keeps reporting every figure the host actually measured, hidden ones marked — so nothing is lost, only undrawn.
Below the response-time section sits the Polaris Agent card: the installed
agent's version, platform, last heartbeat, WebSocket state and privilege tier,
with Upgrade / Uninstall. On a server or workstation with no agent yet
the card is the deploy surface — an Install Agent button that pushes the
agent over a stored SSH or WinRM credential
(Polaris Agent). Deploying needs
assets:fullwrite; at assets:read the card still shows what is installed,
without the buttons. Its Reboots row says whether Polaris may reboot the
host, with Enable… / Disable (Polaris Agent).
Reboot in the panel header, right of Discover Now, restarts the device, now or at a time you pick (rule 115). It is there for a FortiGate, a FortiSwitch, a FortiAP and a host running the Polaris Agent, and pressing it needs Read-Write on Assets. Whether the device can be rebooted is decided elsewhere, by an opt-in at the place that holds the power to do it:
| Device | Rebooted by | Allowed by |
|---|---|---|
| FortiGate | its own REST API or SSH command line | a stored credential on the asset — an SSH login, a REST API token, or a device admin login — with Allow reboots ticked (Allow reboots), or the FortiManager / FortiGate integration's Allow reboots (Fortinet) |
| FortiSwitch / FortiAP managed by a FortiGate | its FortiGate (restart managed FortiSwitch / FortiAP) | the same, on the FortiGate it is managed by |
| FortiSwitch / FortiAP with no controlling FortiGate | its own SSH command line | an SSH credential on the asset with Allow reboots |
| Server or workstation | the Polaris Agent | the host's own opt-in on the agent card (Polaris Agent) |
When a stored credential and the integration could both do it, the stored credential is used. When nothing allows it the button is greyed out and its tooltip says what is missing. A FortiGate in an HA cluster cannot be rebooted from Polaris — rebooting one member fails the cluster over — but the switches and access points it manages can.
The dialog names the device, how the reboot will be sent, what signs it, and the last reboot; says what goes down with it; and needs I understand this device will go down ticked before Reboot now. Polaris holds the device's alerts while it reboots and records every reboot as an Event on the asset. The device stays in maintenance until monitoring has recorded the reboot (or, for a device whose monitoring reads no uptime, until monitoring answers again), at most 10 minutes after it is back — so a reboot you asked for does not set off the Device recently rebooted automation. Once the reboot is sent, Polaris watches for proof that the device restarted — its boot time changing, its FortiGate seeing it drop and reconnect, the agent reporting a new boot, or monitoring seeing its uptime reset. The run ends:
- succeeded — the device went down and came back;
- unverified — the device accepted the reboot but was never seen to go down — check it;
- failed — the device refused (the message says why, for example a token without System read-write), it did not come back within 15 minutes, or an agent did not pick the reboot up within about two and a half minutes (the reboot is then withdrawn, so it never fires later).
Before rebooting a FortiGate directly, Polaris checks that the device answering reports the asset's serial number and is not in an HA cluster, and refuses otherwise.
Scheduling a reboot. Tick Schedule for later in the same dialog and give a time (your browser's time zone) and who gets the results email, exactly as for a scheduled firmware upgrade. While it waits, a Reboot scheduled … chip sits beside the button; click it to change the time or recipients, or to Cancel scheduled reboot. When the time comes every check is taken again; a reboot first reached more than 15 minutes late is not sent, and the recipients hear the outcome either way. A device that cannot be rebooted right now — an agent host that is offline, say — can still be booked: the dialog opens with Schedule for later already ticked.
A device has one booked reboot at a time. A booking is also made by an
automation's reboot action; it shows in the same
chip and can be changed or cancelled the same way. A booked reboot is
cancelled automatically when the device is rebooted before it fires —
by a Reboot now that succeeds, or by monitoring seeing the device's uptime
reset (a crash, a power cut, a firmware upgrade, a reboot from its own
console) — so the device is not taken down a second time for nothing. The
cancellation is an asset.reboot_schedule_cancelled Event on the asset that
says why; no email is sent for it. A Reboot now that fails leaves the
booking in place.
Every booked and past reboot, across the fleet, is on Events → Calendar, coloured by how it went; clicking one opens this device's System tab — a pending booking straight into the Reboot dialog to change or cancel it, a reboot that ran into its log.
Under the agent card, a switch, access point or firewall gets a Firmware card (rule 87) — the answer to whether the Repository holds something newer for this device. It is one of:
- Not supported — no upgrade engine for this manufacturer (Fortinet only, over HTTPS straight to the device). Images can still be stored. A FortiGate in an HA cluster also reads Not supported, with the cluster mode and role: upgrade HA clusters outside Polaris.
- No image — nothing in the repository for this device's platform, with a link to the Repository.
- Current — nothing newer than what it runs.
- No login bound — an image is available but no device login is bound at the model, device-type or manufacturer level (on a FortiGate: no login or API token, or the bound integration API token is missing on the integration that discovered the gate).
- Blocked — an image is available but the device is down, warning, recovering, behind a parent that is down, or has no address. Unless the address is what is missing, it can still be scheduled for later (below).
- Upgrade available — the running version, the image on offer (its version, platform and which model node it came from), the login that will be used and where it is inherited from.
A device that is part of a scheduled or running group firmware upgrade shows Part of a group upgrade with a link to the group. The group schedules it, so it cannot be scheduled on its own here.
Upgrade firmware to … needs Read-Write on Assets: whoever may edit an asset may upgrade it. The card itself shows to anyone who can open the asset; below Read-Write the facts stay and the button is withheld. Access to the Repository is not needed to upgrade a device, and Repository Read-Write alone does not allow it. It opens an approval dialog naming the device (host, serial, running version, login) and the exact image — version, build, platform, file name, SHA-256, where it is filed, who uploaded it — and, when the model's backup image is also newer than the device, lets you choose that instead. Nothing is pushed until you tick that you checked the version and platform and click Approve and upgrade.
On a FortiGate the dialog warns that every network, tunnel and device behind the gate goes down with it for several minutes, and that Polaris does not check Fortinet's supported upgrade path — only that the image is newer and fits the gate's platform — so choosing an image that is a supported step from the running version is up to you. FortiGate upgrades have only been run on lab gates so far; see the warning on Server Settings → Repository before using one on a production gate. The upgrade signs in to the gate itself (its own admin login, a REST API token, or the API token of the integration that discovered it), checks the gate's serial and that it is standalone (not HA) before sending anything, sends the image over the FortiOS REST API — never through FortiManager — then waits for the reboot and reads the new version back.
While it runs the card shows the stage and, on a switch, the erase / write / verify percentages, then Rebooting, Verifying new version and Waiting for monitoring to answer. The device is in a maintenance window for the duration (Maintenance Windows), so everything behind a switch or gate is suppressed with it. The last stage is the window staying open after the device has confirmed its new version: its web interface, which the upgrade uses, usually answers before the SNMP agent Polaris monitors it with. The run finishes when monitoring gets its first answer, or after 10 minutes if it never does. A failed run ends the window straight away.
How the version is confirmed. The upgrade never takes the device's word from before the reboot. It waits for the device's old web session to be refused (a FortiGate: for the gate to stop answering and answer again), which only happens once it has restarted, then signs in afresh and reads the running version. That can succeed while the device's monitoring still shows missed polls; the two use different services on the device. Polaris does not offer a cancel — a flash mid-write must finish — and you must not power-cycle the device while it is writing.
A run ends succeeded (the device came back reporting the image's version), unverified (it came back but Polaris could not confirm the version — check it on the device) or failed (the transcript says at which stage). The asset's OS/firmware field is not rewritten by the run. It catches up from what the device itself reports to monitoring: within about a minute for a FortiSwitch or FortiAP (read from its FortiGate's controller table), on the next poll for a FortiGate polled over its REST API, and otherwise at the next discovery. Until it does the card says Flashed. The same reading picks up a firmware change made outside Polaris, so the card stops offering an upgrade the device already took. Run history lists every attempt with a View log.
While the asset is open the card re-reads its status every 10 minutes on its own, and redraws only when something changed, so an expanded Run history stays open. Refresh in the panel footer re-reads it at once. On the phone the upgrade lives in the asset's OS row instead — see Mobile and Dash.
Scheduling an upgrade for later (rule 93). There is one button, Upgrade firmware to …; its dialog — the device, the exact image, the backup choice, the tick box — has a Schedule for later box under the warning. Leave it clear to upgrade now; tick it and the dialog asks for a time and who gets the results, and its button becomes Schedule upgrade to …. On a Blocked card (the device is down or behind a down parent right now) the same button opens the dialog with Schedule for later already ticked and locked — it cannot be upgraded now, but a device that is down this afternoon may be fine at 2 am. It needs the same Read-Write on Assets. Ticking Schedule for later adds:
- Run at — a date and time in your browser's time zone (the dialog names it). It must be at least a minute ahead and within a year.
- Email the results to — filled in with your own profile email; add more addresses separated by commas. At least one is required.
- If the device is blocked right now, the dialog says why, and that it will be checked again when the upgrade is due.
You approve the image when you book, and Polaris pushes that image — if a newer image is made the model's primary before the booked time, the scheduled upgrade is not started (it does not switch to the newer one), and the recipients are told. Everything else — the device's health, the login, other upgrades running nearby — is checked again when the time comes, exactly as for an upgrade started by hand. A device has at most one scheduled upgrade at a time.
While it is waiting the card shows the version, the time (in your clock, with "in N h"), who gets the results and who booked it, with Change… (a new time, new recipients, or the other offered image) and Cancel scheduled upgrade (nothing is sent to the device and no email goes out). Once it has started it can no longer be changed or cancelled.
When the time comes:
- It starts within about a minute, and from there it is an ordinary upgrade: the card shows the progress and Run history lists it.
- If an upgrade is still running on the same device, on a device above or below it, or on its MCLAG peer, it waits — the card says what it is waiting for — and tries again every minute for up to 2 hours past the booked time, then gives up. So several switches booked for the same minute upgrade one after another rather than all but one being turned away.
- If Polaris was not running at the booked time and only gets to it more than 15 minutes late, it is not started: an upgrade hours outside the time you chose is not the one you approved. Book it again.
- If any other check fails at that moment — the device is down, no login is bound, the image is no longer offered or was deleted — it is not started and is not retried.
The results email. Every recipient gets one email when there is an outcome: the upgrade succeeded, came back unverified, failed (with the end of the run log), or was not started and why (including missed for a late start, or a restart of Polaris during the upgrade). Each recipient who has a Polaris account sees the times in their own time zone; other addresses see the server's. It is sent through the oldest enabled email channel (Delivery channels); with no email channel configured, nothing is sent and an Event on the asset says so. The device name links to the asset when Polaris knows its own public address.
Booking, changing, cancelling, and a scheduled upgrade that was not started or whose email could not be sent, each write an Event on the asset. The phone books, changes and cancels the same way, from the asset's OS row — see Mobile and Dash.
Managed by names the integration that owns this asset's monitoring
configuration — whose class settings and stored credential it inherits, whose
discovery sweep can decommission it — with the parent FortiGate appended for a
managed FortiSwitch or FortiAP (FortiManager: FMG-CORE → PLANT-FG-01), since
that is the device that actually answers polls for it. An asset nobody
discovered reads Manual.
It is one integration, not a list, and it is not the answer to "where did this asset come from". A device can be reported by several systems at once — a laptop in Active Directory and Entra and Intune and Azure Arc — and every one of those is a row under Sources. For those, the first system to claim the asset keeps it, so a later integration finding the same device adds a source without taking over the monitoring configuration. Fortinet-managed switches and APs are the exception: they are always claimed by the integration that manages their controller, because that is where their polling comes from.
Charts carry:
- Maintenance bands — labelled translucent overlays over window gaps.
- Severity shading — the line and dots fade through warning / serious / critical wherever the reading enters a tier of an automation watching that metric on that asset, with dashed labelled reference lines at each in-range threshold. The ladder is computed server-side from the engine's own resolver, so the shading cannot disagree with what actually fires.
- Grey, not red, for a suppressed miss — a failure the upstream explains is drawn grey (rule 38b). Same dive, no accusation.
- Outages on CPU / memory / storage / interface charts — those streams record nothing for a missed poll, so the chart borrows the response-time probe's record: wherever every probe failed, the line dives to the baseline and climbs back out, at every range from 1h to 30d. A hole in the line with no probe failure behind it — the device answered pings but a CPU poll failed — is bridged, not dived: Polaris has no evidence of an outage there. A window the series kept reporting through (a Polaris Agent host that pushed readings while the probe could not reach it) is not dived either.
The colour of Down is not fixed: it is drawn in the covering automation's
own severity (rule 36). Red is what critical looks
like, and critical is merely the default severity of a seeded down automation.
A merged unit and process inventory — systemd units / Windows services with state, and (with Include processes ticked) the per-program process inventory in the same table.
CPU % and Memory on a service row come from the agent (0.22.0+ for CPU, and for memory on Windows):
- CPU % is the mean since the agent's previous inventory scrape, five minutes by default. 100 means one full core, the same scale the process rows use, so a busy service on a multi-core host can read above 100. It stays — until the agent's second scrape after it starts, after the service restarts, and while the service is stopped.
- Memory is the unit's cgroup on Linux and the service process's working set on Windows.
- A process row's CPU % is measured the same way (agent 0.22.1+): the mean since the previous scrape. An older agent reports each process's average since it started, so a long-running process that has just started spinning reads low.
- On Windows several services can share one
svchost.exe. Each of them then shows that whole process's figures, marked shared. Hover the tag for the process and how many services it holds. Polaris does not split the figure between them.
Two pin columns:
- Monitor — a service's log, or a process's CPU/RAM history and logs. On Linux a service's log is its journal. On Windows it is the service's Event Log entries (agent 0.22.0+): the Service Control Manager entries that name it in System (started, stopped, crashed, failed to start, startup type changed), plus anything it logs under its own name in System or Application. Ticking it on Windows brings in the newest 50 entries from each log, then new ones as they happen.
- Map — include it on the Application Map.
A pinned process can also be given a log path — a glob such as
/var/log/app/*.log — for agent log collection. It must be an absolute local
path (no network share, device path or ..), and setting one needs
Assets Full Read-Write, because the agent reads it with the service's
privileges. Read-Write can still change the log source or clear the path
(rule 107).
From agent 0.27.0 a matching file that is a symbolic link, a junction or a hard link is skipped, and so is a link in a folder the wildcard matched, so nobody who can write the log folder can point the agent at a file they could not read themselves. A link in the part of the path you typed is followed. The agent's own log names each skipped file. A rotated log is read from the start of the new file (rule 119).
Click a service's name to open its detail panel. It shows the display name, the description (Windows), state, startup type in the Services console's wording (Automatic (Delayed Start), Manual, …; the enablement state on Linux), main process, CPU, memory, the other services sharing its process, its ports and connections, and its log.
Mapping implies monitoring, one way. Alerting on a service belongs to Automations.
The programs installed on the host, with their version, publisher, install date and size. Up to three places can supply the list, and the tab shows one at a time:
| Source | Where it comes from | How fresh |
|---|---|---|
| Polaris Agent | Read on the host itself: the Apps & features list on Windows (both the 64-bit and 32-bit registry views), the dpkg or rpm package database on Linux | Every six hours |
| Intune | Intune's detected apps for the device, read during an Entra ID / Intune discovery run when Read installed software is ticked on the integration (Integration-Directory) | Each discovery run, for devices that have checked in since the last read |
| Azure Arc | Azure Change Tracking & Inventory, read from Log Analytics during an Azure Arc discovery run when Installed Software is on (Integration-Azure-Arc) | Each discovery run; an uninstalled program can stay listed for up to three days |
When more than one source has a list, a picker beside Refresh chooses between them; the agent's list is shown first because it reads the host directly. Beside the Installed software heading you see how many programs the source reported and when it was last read (with a single source, its name too); a short note under it explains a source's limits.
Things to know:
- The sources are never merged. The same program reported by the agent and by Intune appears in both lists, and the two can disagree — Intune's detected apps include things the agent does not see and vice versa.
- Intune lists unmanaged apps only on corporate-owned devices. On a personal (BYOD) device it reports the apps Intune deployed and nothing else. That is Microsoft's privacy rule, not a failed read.
- Per-user installs are not on the agent's Windows list — a program installed for one user only (into their profile) is invisible to a service reading the machine-wide registry.
- Two versions, or the 32- and 64-bit builds, of one program are two rows.
- Arch and Size start hidden; turn them on from the column chooser.
- With no list at all the tab says how to get one: install the agent, or turn the read on in an Entra ID or Azure Arc integration.
The audit history about this asset — its own Events, plus each of its alerts firing and clearing — newest first. The header's Screenshot gives way to an Export dropdown here (CSV or PDF, this page or every event for the asset).
This asset's active alerts, above the automations that can trigger for it.
That list leaves out any automation a more-specific one over the same trigger
has carved this device out of (rule 18, see
Automations) — with High CPU utilization on all assets and
Server High CPU utilization on servers, a server lists only the second,
because the first never evaluates it. The Scope column spells out a
condition-built scope (Device type equals server) rather than showing —.
The tab itself strobes in the colour of the worst of them, so the operator
who opened the panel from a strobing row can see which tab it was about.
The active table is [select] · Time · Severity · Detail · Message · Actions.
Detail is the dimension — the interface, sensor or mount the alert was
raised for — and it is what makes the list readable: a per-interface automation
on a switch that loses its uplink raises one alert per pinned port, same minute,
same message. Without that column you get two dozen rows that differ in nothing.
Equal timestamps order by dimension numerically, so port2 precedes
port10.
Actions carries Acknowledge (alerts:write) and Clear
(alerts:fullwrite), individually or over a multi-select in one request each.
Clearing ends the alert, stops escalation and runs the automation's reset
actions, so it is confirmed.
A purple MAINT badge beside the severity means the alert is paused for planned work: this device is in a maintenance window, or sits behind one that is. It stays listed but sends no reminders or escalation until the window ends (see Dashboard for the full behaviour). A Dep. Down alert with no MAINT badge is also paused, but by the upstream outage rather than by maintenance: its reminders and escalation resume once the upstream device is back (see rule 78).
A grouped alert (one alert covering several components of this device)
wears a GROUP pill beside its severity, and its message is a link. Click
it and choose Show alerts in this group… to list every component the
alert covers. Ones still affected come first, worst first. Ones that have
recovered stay on the list, greyed, with the time they came back. This works
for anyone who can see the tab; it needs no alerts permission.
The note prompt is a Polaris modal, never window.prompt — the browser box is
unstyled, dead in an installed PWA, suppressed outright by some browsers, and
cannot mark a field required, which a note-requiring automation needs. The
question is a placeholder, never a value, so an untouched box submits as no
note at all.
The second table lists matching automations: Name · Trigger · Scope, where
Trigger is the automation's plain-English sentence — every severity tier
included. The name opens the
automation in the wizard in place, for automationManagement:write.
Shown when the asset's manufacturer profile defines custom widgets (Server Settings → Credentials → Manufacturer Profiles). One card per widget, drawn as its type says — a gauge with its threshold ranges, a line over the last 60 samples, a table, or a pass/fail state. Widgets are collected on their own cadence (60 seconds by default); the tab shows the freshest sample and says so when none has arrived yet, or when the asset's polling is disabled.
Radios → the SSIDs each one broadcasts → the clients connected to each, as one expandable tree. A radio row carries its channel, width and transmit power; transmit power is shown as the source reported it — a percentage of the radio's ceiling from the controller, and the AP's own MIB integers with no unit, because that MIB publishes none.
Clients Polaris could not file under any broadcast SSID are listed at the bottom under Not matched to a broadcast SSID rather than dropped — usually radios and stations scraped a cycle apart.
A filter box above the tree matches a client's MAC, IP, SSID, BSSID or matched hostname. A radio or SSID that matches by name keeps everything under it; otherwise only the clients that match are shown, under their own radio and SSID, with every radio the filter kept opened even if you had collapsed it. The filter stays put across Poll.
An AP whose radio inventory has not arrived yet falls back to a flat client table, so the tab never reads as empty while discovery fills it in. Radios and their SSIDs come from the discovery run against the controlling FortiGate; connected clients come from an SNMP walk, which needs the AP's Interfaces stream set to SNMP.
Carries the cadence · freshness · Poll row described above, with the
AP's profile (Profile: <name>) after the heading — the controller's AP
profile that decides these radios, SSIDs and power, the same value as the
General tab's AP Profile row. It appears once a discovery run against the
controlling FortiGate has recorded it.
The switch's layer-2 forwarding database, grouped interface-first — the
question is "what is on port 32", not "where is this MAC". Each port is one
expandable row carrying its MAC count and the reading that count supports: one
learned address is an access port, many are an uplink or trunk. Only learned
entries count toward that; the bridge's own address and static entries render
but say nothing about what is reachable through the port.
Entries on ports Polaris could not resolve to an interface are hidden behind a count and a Show link, not dropped. On a FortiSwitch these are the trunk/LAG pseudo-ports, which publish no port-to-interface mapping, so every address behind a trunk lands there unattributable and would swamp the real per-port rows.
A filter box, like the ARP Table's, matches a MAC, interface name, VLAN, status or matched hostname, and the count in the heading becomes N of M entries. It filters whatever is shown, so the unresolved-port entries are only searched once you have clicked Show. The filter stays put across Poll.
This is collected over SNMP on the system-info cadence. A switch polled through its parent FortiGate reports none — the empty state says so, and tells you when the last pass ran, so "scraped and genuinely empty" stays distinct from "never scraped".
Carries the cadence · freshness · Poll row described above. An unmonitored switch shows no cadence at all: nothing refreshes a forwarding database except the system-info pass, and discovery does not fill in for it.
The gate's layer-3 neighbour cache, grouped interface-first. Headed by the cadence · freshness · Poll row described above, plus:
- A range selector — Current / 1h / 12h / 24h / 7d / 30d. Current is only what the most recent read found; an entry the gate has since aged out appears under the time ranges, not here. An option past your configured retention is disabled rather than hidden, so you can see it exists and is not being kept.
- A filter over IP / MAC / interface / matched hostname — what brings an operator here is a lookup, not a survey.
- A disclaimer that each read is a snapshot of a cache the gate ages out in roughly 1–5 minutes. Short-lived entries can be missing entirely, and an absent address was not necessarily absent from the network.
Unlike the other two, this table has a second writer: discovery reads it on every cycle. So an unmonitored gate still shows a cadence — its integration's poll interval, typically 12 hours rather than the 10 minutes a monitored one gets. The stated figure is always the one that actually applies to this device.
A historical range adds a Last seen column; Current omits it because every row shares one instant.
The gate's IPsec tunnels and who is connected through them. Headed by the cadence · freshness · Poll row described above, and the same snapshot disclaimer: ADVPN shortcuts form on demand and tear down when idle, and remote users come and go, so a peer missing here may simply not have been connected when the gate was last read.
Tunnels & peers lists every configured phase-1 tunnel — site-to-site tunnels and dial-up templates — with its status, remote gateway, the interface it rides (with the tunnel interface's own address under it) and its byte counters. A site-to-site tunnel's Device column links to the gate at its far end when Polaris knows an asset at that remote gateway. Under each tunnel, marked with the tree line, are the peers connected through it:
- On an ADVPN hub, each spoke dialled into the hub's template, shown as ADVPN spoke. A dial-up template's status reads dynamic (it is working as configured whether or not anyone is on it) and its second line says how many peers are connected.
- On an ADVPN spoke, each on-demand shortcut to another spoke, shown as ADVPN shortcut. A quiet spoke has none, which is normal.
- A site dialled into a dial-up template that is not ADVPN shows as Dial-up peer.
Each peer row carries its remote gateway (the peer's public / underlay address), its tunnel IP (its overlay or assigned address), how long it has been up, and its traffic. The Device column links to the peer's own asset when Polaris knows an asset at either address — the remote gateway is tried first, then the tunnel IP, against each asset's primary address and the interface addresses Polaris has recorded for it. Otherwise it shows the IKE identity the peer presented, which is usually its own name. A peer behind NAT links only when its public address is one Polaris has recorded on that asset.
Every column sorts and filters, as in the other asset tables, and your sort and filters are remembered. With a sort or a filter active the tree flattens, and each peer's second line names the tunnel it is connected through. The Tunnel / peer filter matches a row's name, its kind (ADVPN spoke, Site-to-site…), the tunnel a peer hangs off and the peer's IKE identity.
Pinning and history. The 1m checkbox on a tunnel row polls that tunnel every minute and keeps its history — what an IPsec tunnel automation reads. It is also checked when the tunnel's interface is pinned; clearing it stops both. Peers are not pinnable: they come and go with traffic. Click a tunnel's name for its status and throughput charts.
Remote access lists FortiClient users: those on an IPsec dial-up tunnel (one using XAuth or EAP, or built by the FortiClient wizard) and, on firmware that still offers it, those on SSL-VPN. Each row shows the user, the connection type, the tunnel, the address they connected from, the address they were assigned, how long they have been connected, and their traffic. It sorts and filters the same way.
The tab works the same for a gate managed through FortiManager and a standalone FortiGate integration. It needs the gate to be monitored with FortiOS REST API access — the IPsec read runs over the REST API even when the gate's interfaces are polled over SNMP — and it is refreshed on the gate's system-info cadence. The REST credential needs read access to VPN monitoring; SSL-VPN sessions are read separately, so a credential that can see one and not the other still fills in the half it can see.
Shown on a monitored FortiGate that reported SD-WAN data, with the SD-WAN toggle on its integration. Three sections: SD-WAN Members (the WAN members and overlays, grouped by zone, with per-health-check state), SD-WAN Rules (the service rules in the gate's own priority order, selected member highlighted) and Performance SLA (latency, jitter and packet-loss charts per health check). One member legend above the Performance SLA charts drives all three: click a member to hide or show it, double-click to show only that member, and Show all brings everything back.
Each member's Health Check Status strip covers the last 30 minutes, one segment per SD-WAN poll. Each segment is one colour:
- Red — a health check reported the member dead at that poll, or the member was alive but its latency, jitter or loss was above that health check's own SLA target.
- A severity colour — the member was alive and within its SLA targets, but the reading crosses a severity level of one of your SD-WAN automations. The colour is that severity's. Automations filtered to other health checks or members do not colour it.
- Green — alive, within its SLA targets, and no automation level crossed.
Hover a segment for its time and state: down, out of SLA, or up — warning by automation. A poll that never ran leaves no segment.
A member's Link column is its interface's link state, except for an IPsec overlay: a tunnel has no physical link, so an overlay shows its IPsec tunnel status instead — tunnel up, tunnel down, partial (some phase-2 selectors down) or dial-up (a hub's dial-up tunnel, which has no single state). It reads the tunnel's newest status from the last 24 hours, and shows — when there is none, for example on a gate polled only over SNMP.
Each section states where its data came from and how old it is — the polling
method, transport and cadence, then updated 8m ago, amber with a ⚠ once the
reading is older than one cadence, exactly as on the snapshot tabs above. Each
states its own age rather than the device's last poll: the rules table and
the health-check metrics are separate reads on the same pass, and one can land
while the other fails. A failed rules read keeps the rules table as it was
rather than emptying it. A section that has never been collected says so
instead of showing nothing.
SD-WAN has its own polling pass, separate from interfaces: every 60 seconds by
default, set per integration by the SD-WAN tab's Polling Interval (see
Integration-Fortinet). The only way to re-read SD-WAN on
demand is POST /assets/:id/probe-now over the API, which runs it along
with the probe. Nothing in the UI does: the snapshot tabs' Poll re-reads
system info only, and the mobile asset sheet's refresh just reloads what
Polaris already has stored.
The tab is labelled Paths. Shown on a host that runs at least one path check. A table lists every check the host runs; click one to see its Latency (with optional DNS / Connect / TLS / TTFB lines and any automation SLA shaded), Availability, HTTP status, the Latest result (body fingerprint and size, TLS issuer and days to expiry, error text, and a body excerpt when one was kept) and the Path — the traceroute, each hop linked to the device Polaris monitors at that address, with changed hops marked against the previous trace. These results describe the path from this host; they never change the host's own Up / Down. The path graph has an Export menu (screenshot, PDF or Visio) — see Exporting the path graph.
Every AssetSource row — one per system that reported this device — with what
each one said, side by side. This is where you go when a field looks wrong: the
projection shows the highest-priority source's answer, and this tab shows all of
them.
It also hosts the merge flow. Per-field winners are pre-selected from the
Sources priority order, with the winning column badged higher-ranked source
and one line naming which two sources decided it. Two rules outrank the order:
an empty value never overwrites a filled one, and for Type the other
catch-all counts as empty — so a specific type on either side wins, and no merge
path writes other over a real type.
The inverse is Split, shown to the admin role on each non-manual source card of an asset with more than one source: it detaches that source onto a new asset that starts clean, while monitoring, IP history, sightings and quarantine stay on the original — the recovery for a bad merge.
Discover Now sits in the panel header, right of the device's name (on the
phone, in the menu the name opens). POST /assets/:id/rediscover narrows a
discovery run to one device. For a FortiSwitch or FortiAP it scopes to the
controller gate.
A scoped run never stamps the integration's last-discovery time, never feeds the duration baseline, and skips all four asset-only post-sync passes — agent auto-deploy, interface/storage auto-monitor, presence verification and directory sync — which read the database fleet-wide. Auto-deploy in particular would start agent installs across the whole fleet from one click.
On an Unraid or TrueNAS SCALE VM or container, and on any Proxmox VE node, VM or container, Discover Now is disabled: the integration's own Discover reads the whole host or cluster in one call, so there is nothing cheaper to scope to.
+ Add Asset(s) opens a menu: Single asset (assets:write) is the
hand-typed form below; New discovery and Saved discoveries run an active
scan of IP ranges (Network Discovery, networkScan). An
entry your role cannot use is left out of the menu.
In the Single asset form, as you type the IP, a panel underneath cross-references it and reports, in this order:
- Any asset that already carries it as a primary IP, in the warning colour — that is a duplicate you are about to create.
- The containing network.
- The gate the address sits behind, and why that gate is believed — its ARP table resolved it / it serves the network's DHCP / a device was sighted behind it.
- The lease or reservation already on it, phrased from
sourceTypeanddhcpBindingtogether: "In use by a managed FortiAP … the gate leases it dynamically." - The switch port its MAC was learned on, and the AP a wireless station on it is associated to.
Use these details fills MAC, hostname, location and coordinates — but only into fields you left blank, and coordinates only as a complete pair. The panel reports; it never writes.
A section your role cannot read says "Not shown", never "none found".
Saving an asset with an IP — on create, or when you change the IP in the edit form — first checks whether another network-present asset already records that address. If one does, a dialog names it (type, status, when its address was last confirmed, whether it is pinned) and asks how to proceed:
- Save & submit for conflict review saves your record and raises a Duplicate IP conflict immediately, so it is in the queue — and alerting — without waiting for the ten-minute sweep.
- Save & review merge with … appears only if you hold Assets full read-write and exactly one other asset currently holds the address. It saves, then opens the merge review between the two records — for when the "other asset" is the same device recorded twice.
- Cancel writes nothing.
A record whose address claim has gone stale is listed for information but does not count as a collision. Re-saving an asset without changing its IP asks nothing.
The IP Address field in the edit form overrides what discovery reports.
| You | Then |
|---|---|
| type a different address | it is pinned (overridden on the details page). Discovery reporting the same address releases the pin; a different one raises an IP override conflict |
| clear the field on an asset that has an address | the asset has no address and stays that way (cleared on the details page). Discovery cannot put one back; an address it reports raises the same conflict, where Accept takes it and Reject keeps the asset blank |
| click Revert to discovered IP (shown under a pinned or cleared field) | the pin is released and the asset takes whatever discovery reports, on save |
Each of the three also releases a pinned primary address. To monitor a device on one of the addresses it already has, use Set as primary in its IPs list instead.
Saving the form while the field is already empty changes nothing, so editing another field on an asset with no address never pins it blank.
Three ways in, all assets:write and all the same act:
- the row menu's Delete, on the list;
- Delete Asset, at the bottom-left of the edit modal — so a device you opened to fix, and then decided should not exist, does not have to be found again in the list; or
- Delete selected on the bulk bar, for many at once.
The first two ask you to confirm by hostname first, over the top of whatever you had open; cancelling leaves the edit modal and anything you had typed in it exactly as it was. Confirming closes the modal, closes the detail panel if it was showing that device, and removes the record. The bulk delete confirms once, with the count.
There is no undo. The asset's history goes with it — samples, alerts,
sightings. If the device is simply gone from the network rather than gone from
the business, set its State to decommissioned instead: that stops polling
and keeps the record. A device a source still discovers will also come back on
the next discovery run, as a new record with no history.
Two things the delete does for you, and one it refuses:
- a managed switch or AP gives its infrastructure reservation back first, while the address is still readable off the record;
- the deletion is written to Events as
asset.deleted, named; - a quarantined asset is refused outright — release the quarantine first, or the MAC block stays on the firewalls with nothing left in Polaris that remembers how to lift it.
Settings on the toolbar — shown to the admin role — one modal of stacked sections:
Two fields:
-
Auto-Decommission Threshold (months) — an asset whose Last Seen is
older than this is moved to
decommissioned. A daily job;0turns it off, and an asset in a maintenance window is never auto-decommissioned. -
IP History Retention (days) — IP address history older than this is
removed.
0keeps it indefinitely.
The drag-to-reorder learned-location priority list (rule 22). Contributors come from the server catalogue, each with a "what this contributes" hint, so a new source kind needs no client change. Two kinds exist: field contributors carry a real location string; label contributors contribute their own name.
The same order decides the merge modal's per-field defaults. An unranked kind ranks last there, never first.
One invariant is worth knowing because its failure mode is silent: a source blob may never be built from the projection's own output. Doing so launders one source's value into another's — an AD OU path lands in a FortiGate-sourced field and gains another prefix every cycle.
The polling-method tier for orphan assets — ones with no integration behind
them. Accepts every method except fortimanager (an orphan has no FortiManager
to ask), since it must cover any source.
Per-(source kind, asset class) polling and credential overrides, one tier above the integration's own settings. See Polling methods.
The manual way to pin and unpin interfaces, IPsec tunnels and storage mounts across many devices at once. It is the subtractive counterpart to the integrations' auto-monitor pass, which is additive only by design.
It mounts the shared condition builder over the automations device vocabulary, lists the matched assets' inventory aggregated by name with tri-state checkboxes (checked = pinned on every reporting device, partial = some), expandable to per-device checkboxes, and stages edits until one Apply.
The aggregate-row click cycle is explicit, because an indeterminate checkbox
reports checked === false: not-all-pinned → pin on all; fully checked → unpin
on all.
A matched set over 1000 answers overCap instead of truncating — "pinned on all
matched devices" is only honest over the complete set.
Why pinning matters: an unpinned interface, tunnel or mount never alerts, however much sample data exists for it (rule 57). The pin is the statement of what may alert. Un-pinning is how alerting stops, and a firing alert whose pin is gone clears — even on a tick where the device produced no readings at all.
One Import / Export ▾ dropdown. Exports run to PDF and CSV at page,
filtered, or whole-list scope. Import entries are gated on assets:write.