Plotting functions - red-data-tools/GR.rb GitHub Wiki
GR::Plot - A simple, matlab-style API
plot
step
plot3
polar
scatter
scatter3
stem
barplot
histogram
polarhistogram
hexbin
contour
contourf
tricont
surface
trisurf
wireframe
volume
heatmap
polarheatmap
shade
imshow
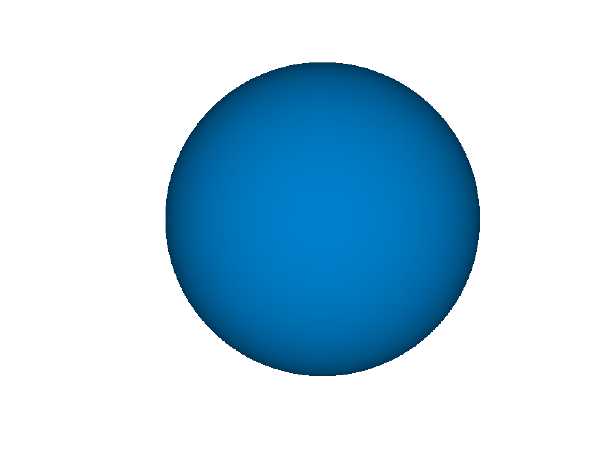
isosurface
Getting ready
you'll need the ruby-gr, numo-narray gems.
require 'gr/plot'
require 'numo/narray'
Line Plots
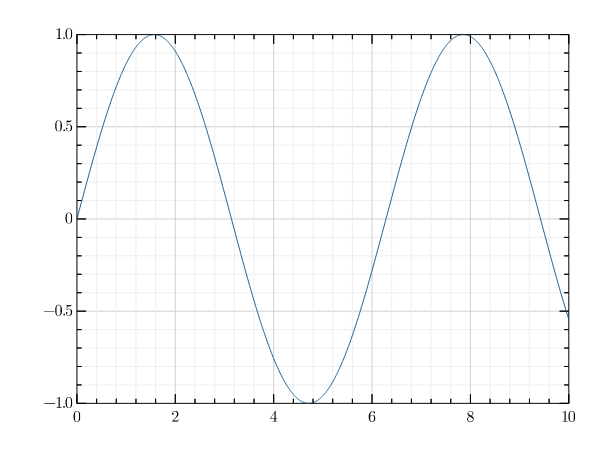
plot
Draw one or more line plots.
x = Numo::DFloat.linspace(0, 10, 1001)
y = Numo::NMath.sin(x)

GR.plot(x, y)
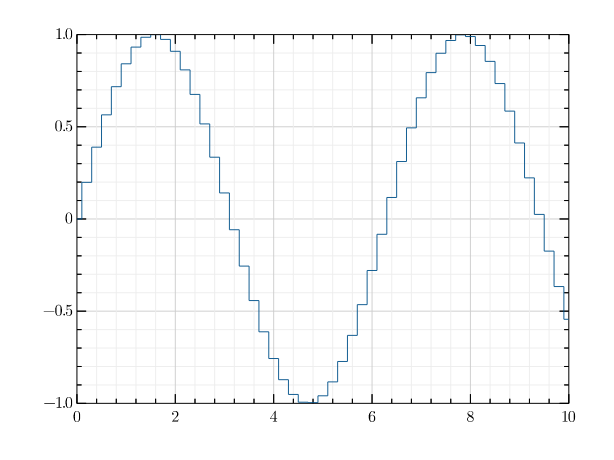
step
Draw one or more staircase or step plots.
- where: mid pre post
x = Numo::DFloat.linspace(0, 10, 51)
y = Numo::NMath.sin(x)

GR.step(x, y)
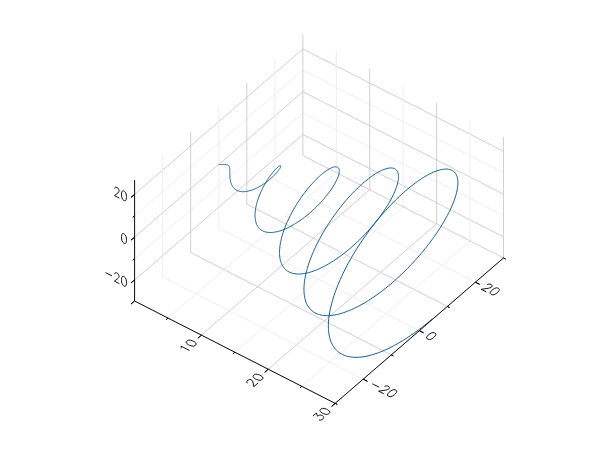
plot3
Draw one or more three-dimensional line plots.
x = Numo::DFloat.linspace(0, 30, 1000)
y = Numo::NMath.cos(x) * x
z = Numo::NMath.sin(x) * x

GR.plot3(x, y, z)
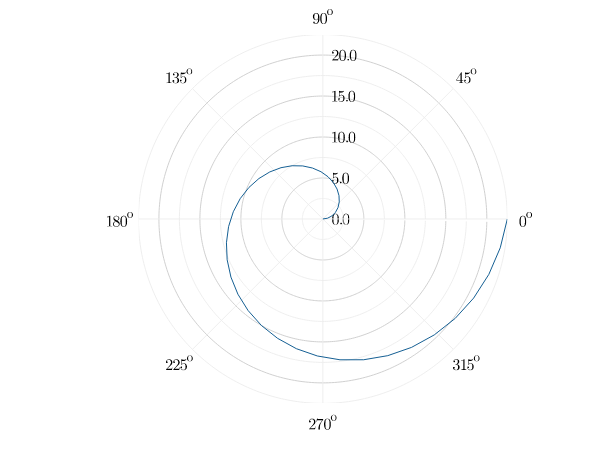
polar
Draw one or more polar plots.
angles = Numo::DFloat.linspace(0, 2 * Math::PI, 40)
radii = Numo::DFloat.linspace(0, 20, 40)

GR.polar(angles, radii)
Scatter Plots
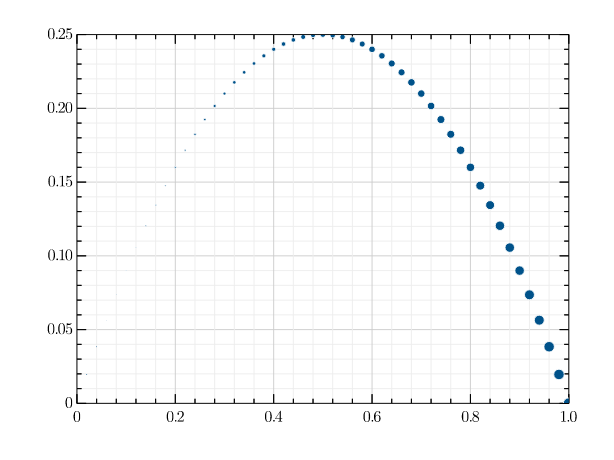
scatter
Draw a scatter plot.
x = Numo::DFloat.linspace(0, 1, 51)
y = x - x**2
s = x * 200

GR.scatter(x, y, s)
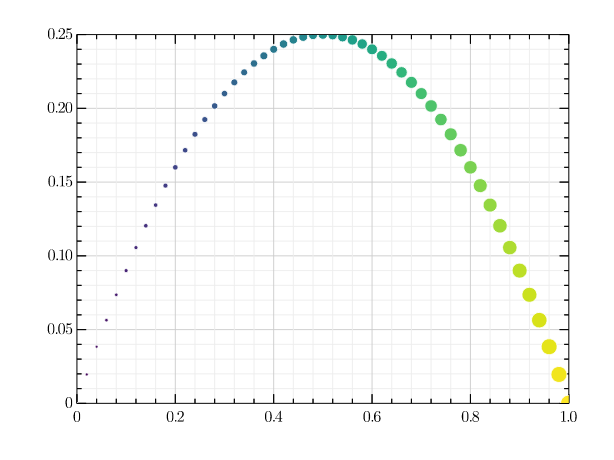
x = Numo::DFloat.linspace(0, 1, 51)
y = x - x**2
s = Numo::DFloat.linspace(50, 300, x.size)
c = Numo::DFloat.linspace(0, 255, x.size)

GR.scatter(x, y, s, c)
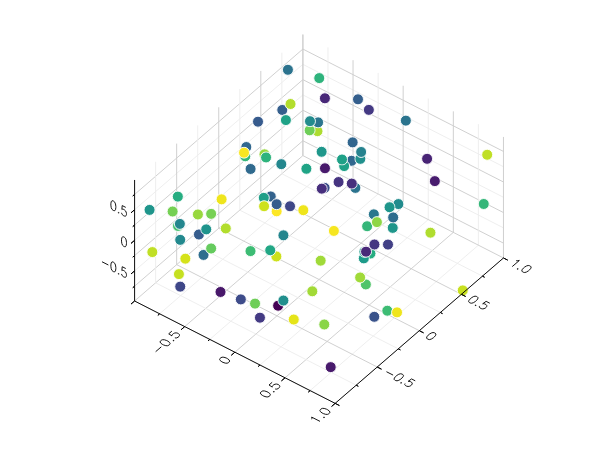
scatter3
Draw a three-dimensional scatter plot.
x = 2 * Numo::DFloat.new(100).rand - 1
y = 2 * Numo::DFloat.new(100).rand - 1
z = 2 * Numo::DFloat.new(100).rand - 1
c = 999 * Numo::DFloat.new(100).rand + 1

GR.scatter3(x, y, z, c)
Stem Plots
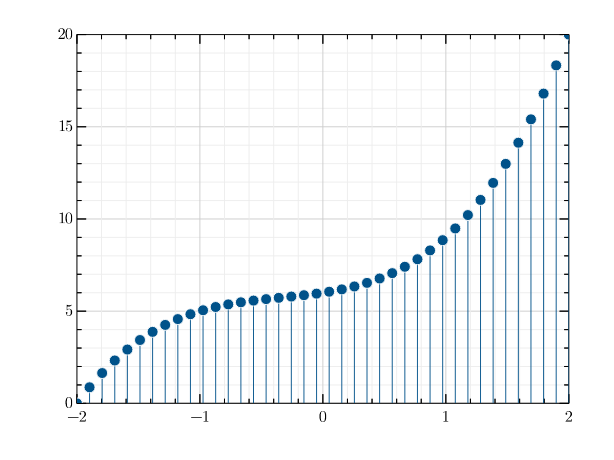
stem
Draw a stem plot.
x = Numo::DFloat.linspace(-2, 2, 40)
y = x ** 3 + x ** 2 + x + 6

GR.stem(x, y)
Bar Plots
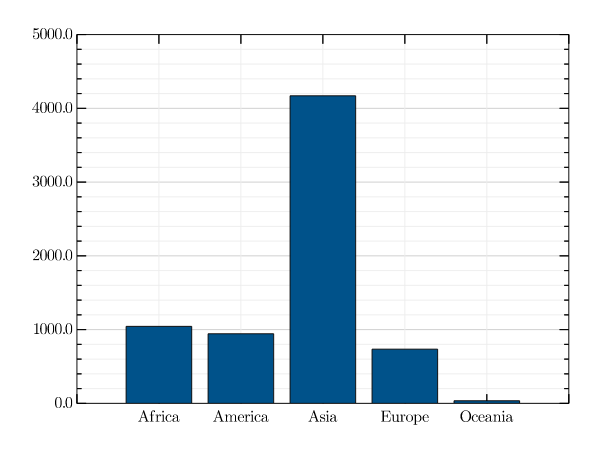
barplot
Draw a bar plot.
- horizontal: true false
continents = ["Africa", "America", "Asia", "Europe", "Oceania"]
population_2010 = [1044, 944, 4170, 735, 36]

GR.barplot(continents, population_2010)
Histograms
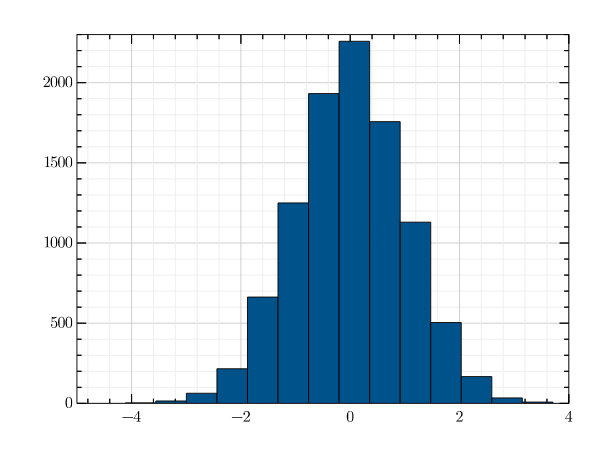
histogram
Draw a histogram of data.
- nbins: Integer
x = Numo::DFloat.new(10_000).rand_norm

GR.histogram(x)
polarhistogram
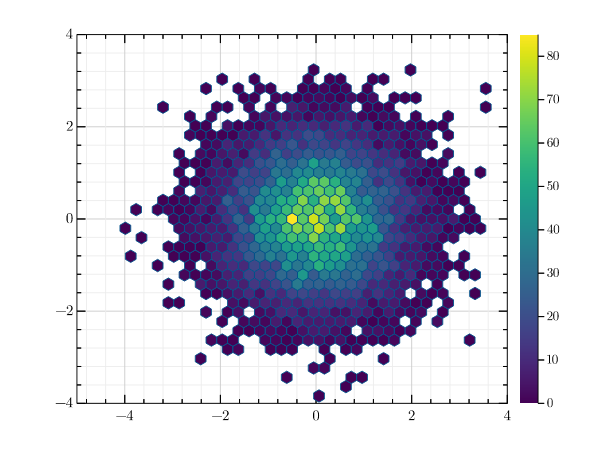
hexbin
Draw a hexagon binning plot.
- nbins: Integer
x = Numo::DFloat.new(10_000).rand_norm
y = Numo::DFloat.new(10_000).rand_norm

GR.hexbin(x, y)
Contour Plots
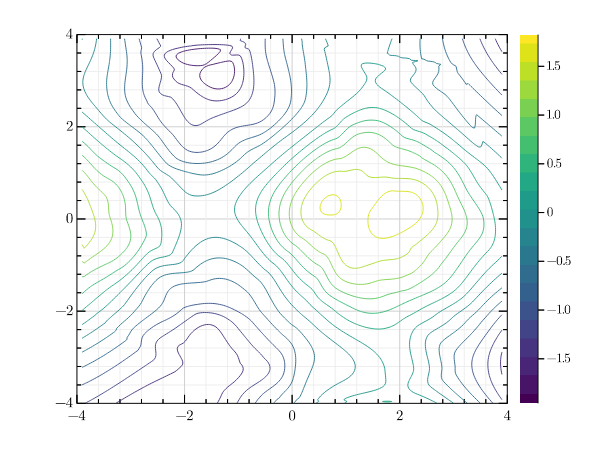
contour
Draw a contour plot.
- levels: Integer
x = 8 * Numo::DFloat.new(60).rand - 4
y = 8 * Numo::DFloat.new(60).rand - 4
z = Numo::NMath.sin(x) + Numo::NMath.cos(y)

GR.contour(x, y, z)
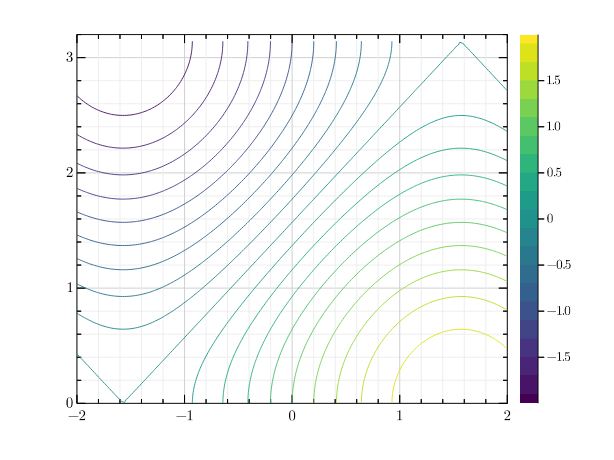
_x = Numo::DFloat.linspace(-2, 2, 40)
_y = Numo::DFloat.linspace(0, Math::PI, 20)
x = (_x.expand_dims(0) * Numo::DFloat.ones(_y.size, 1)).flatten
y = (_y.expand_dims(1) * Numo::DFloat.ones(1, _x.size)).flatten
z = (Numo::NMath.sin(x) + Numo::NMath.cos(y)).flatten

GR.contour(x, y, z)
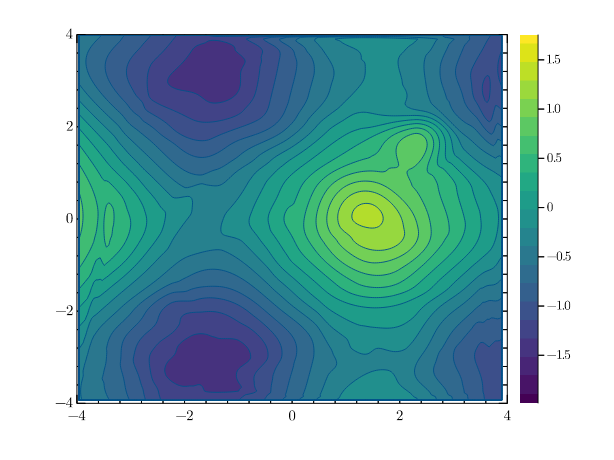
contourf
Draw a filled contour plot.
- levels: Integer
x = 8 * Numo::DFloat.new(100).rand - 4
y = 8 * Numo::DFloat.new(100).rand - 4
z = Numo::NMath.sin(x) + Numo::NMath.cos(y)

GR.contourf(x, y, z)
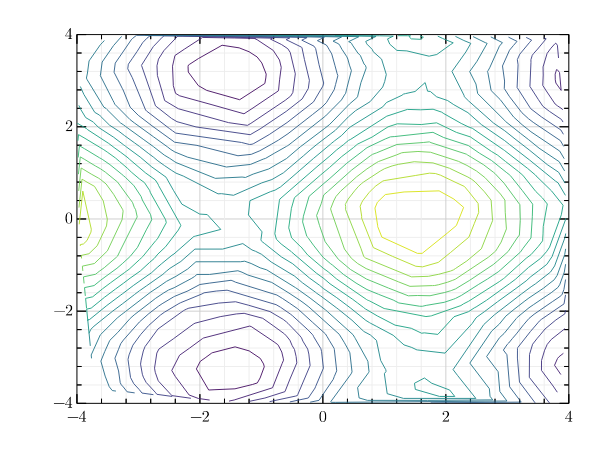
tricont
Draw a triangular contour plot.
x = 8 * Numo::DFloat.new(300).rand - 4
y = 8 * Numo::DFloat.new(300).rand - 4
z = Numo::NMath.sin(x) + Numo::NMath.cos(y)

GR.tricont(x, y, z)
Surface Plots
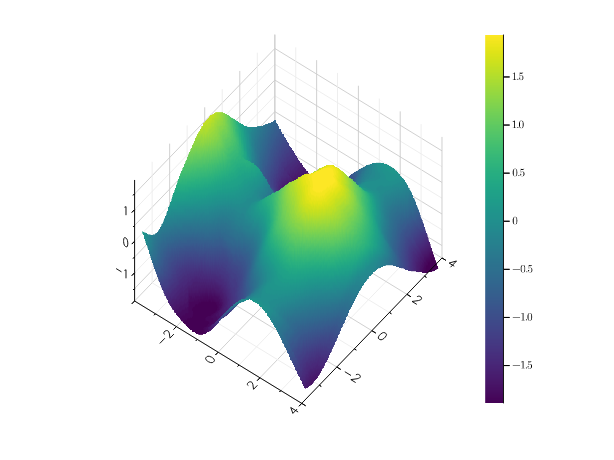
surface
Draw a three-dimensional surface plot.
- accelerate true false
x = 8 * Numo::DFloat.new(100).rand - 4
y = 8 * Numo::DFloat.new(100).rand - 4
z = Numo::NMath.sin(x) + Numo::NMath.cos(y)

GR.surface(x, y, z)
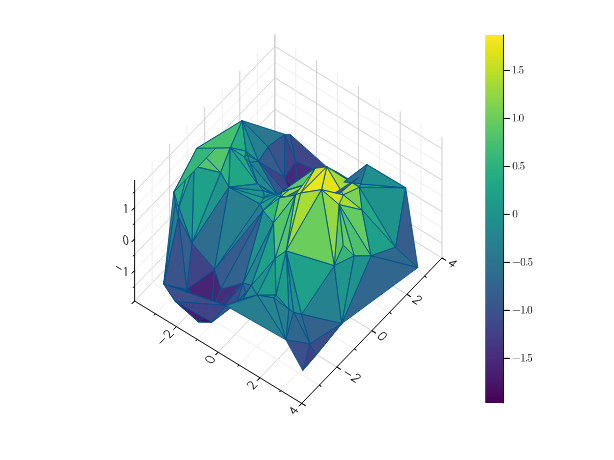
trisurf
Draw a triangular surface plot.
x = 8 * Numo::DFloat.new(100).rand - 4
y = 8 * Numo::DFloat.new(100).rand - 4
z = Numo::NMath.sin(x) + Numo::NMath.cos(y)

GR.trisurf(x, y, z)
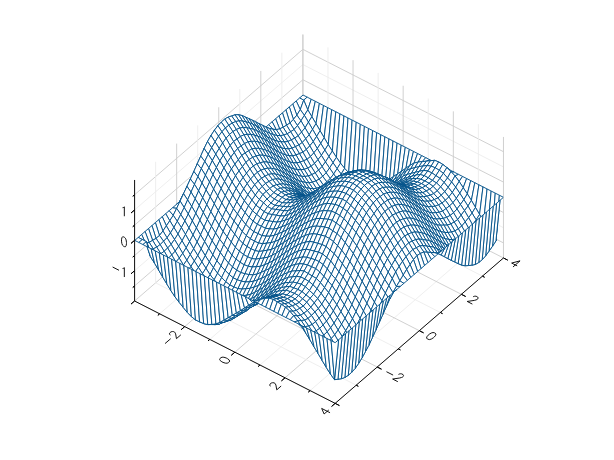
wireframe
Draw a three-dimensional wireframe plot.
x = 8 * Numo::DFloat.new(1000).rand - 4
y = 8 * Numo::DFloat.new(1000).rand - 4
z = Numo::NMath.sin(x) + Numo::NMath.cos(y)

GR.wireframe(x, y, z)
Volume Rendering
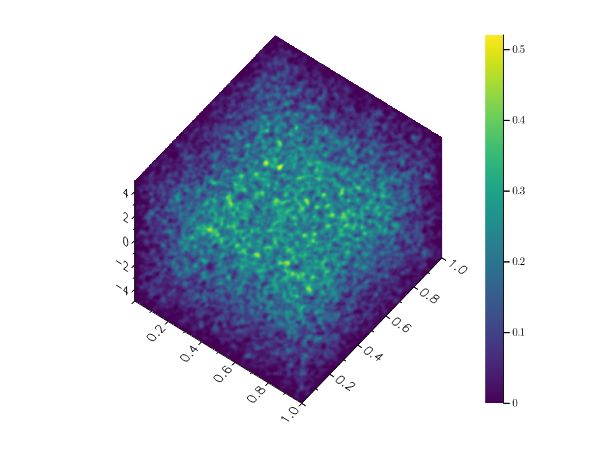
volume
Draw a the three-dimensional array v, using volume rendering.
- algorithm: 0 1 2
z = Numo::DFloat.new(50, 50, 50).rand_norm

GR.volume(z)
Heatmaps
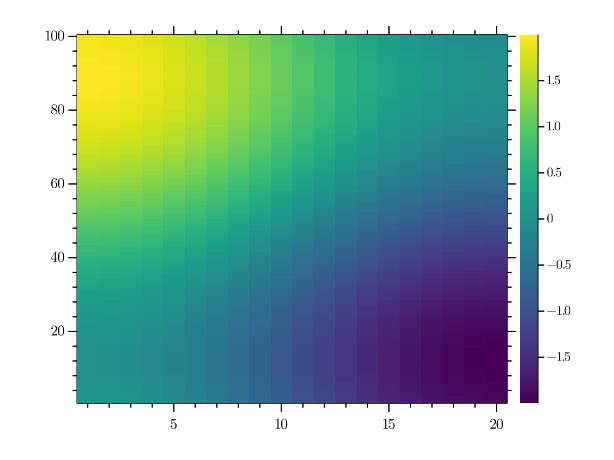
heatmap
Draw a heatmap.
x = Numo::DFloat.linspace(-2, 2, 40)
y = Numo::DFloat.linspace(0, Math::PI, 20)
z = Numo::NMath.sin(x).expand_dims(0).transpose + Numo::NMath.cos(y)

GR.heatmap(z)
polarheatmap
Draw a polar heatmap.
angle = Numo::DFloat.linspace(0, 2*Math::PI, 40)
radius = Numo::DFloat.linspace(0, 10, 20)
z = Numo::NMath.sin(angle.expand_dims(0).transpose) * Numo::NMath.cos(radius)

GR.polarheatmap(z)

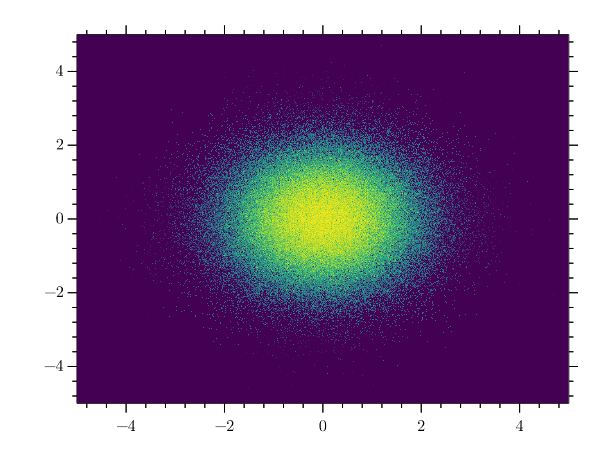
shade
Draw a point- or line-based heatmap.
- xform 0 1 2 3 4 5
n = 1_000_000
x = Numo::DFloat.new(n).rand_norm
y = Numo::DFloat.new(n).rand_norm

GR.shade(x, y)
Images
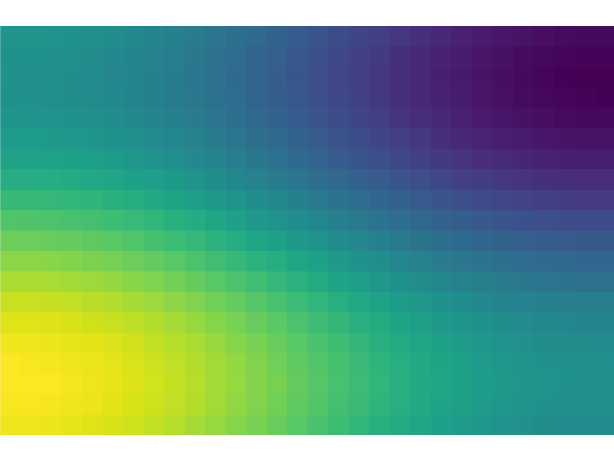
imshow
Draw an image.
x = Numo::DFloat.linspace(-1, 1, 20)
y = Numo::DFloat.linspace(0, Math::PI, 30)
z = Numo::NMath.sin(x).expand_dims(0).transpose + Numo::NMath.cos(y)

GR.imshow(z)
Isosurfaces
isosurface
Draw an isosurface.
require 'gr3'
s = Numo::DFloat.linspace(-0.6, 0.6, 50)
v = 1 - ((s**2 +  (s**2).expand_dims(0).transpose).expand_dims(2) + s.reshape(1, 1, true)**2)**0.5

GR.isosurface(v)