Terminal Dashboard - ptweezy/cronstable GitHub Wiki
cronstable tui lets you monitor and control jobs from a terminal,
including over SSH or in tmux. The terminal user interface (TUI) uses
the same HTTP control API as the
web dashboard, with no additional daemon configuration.
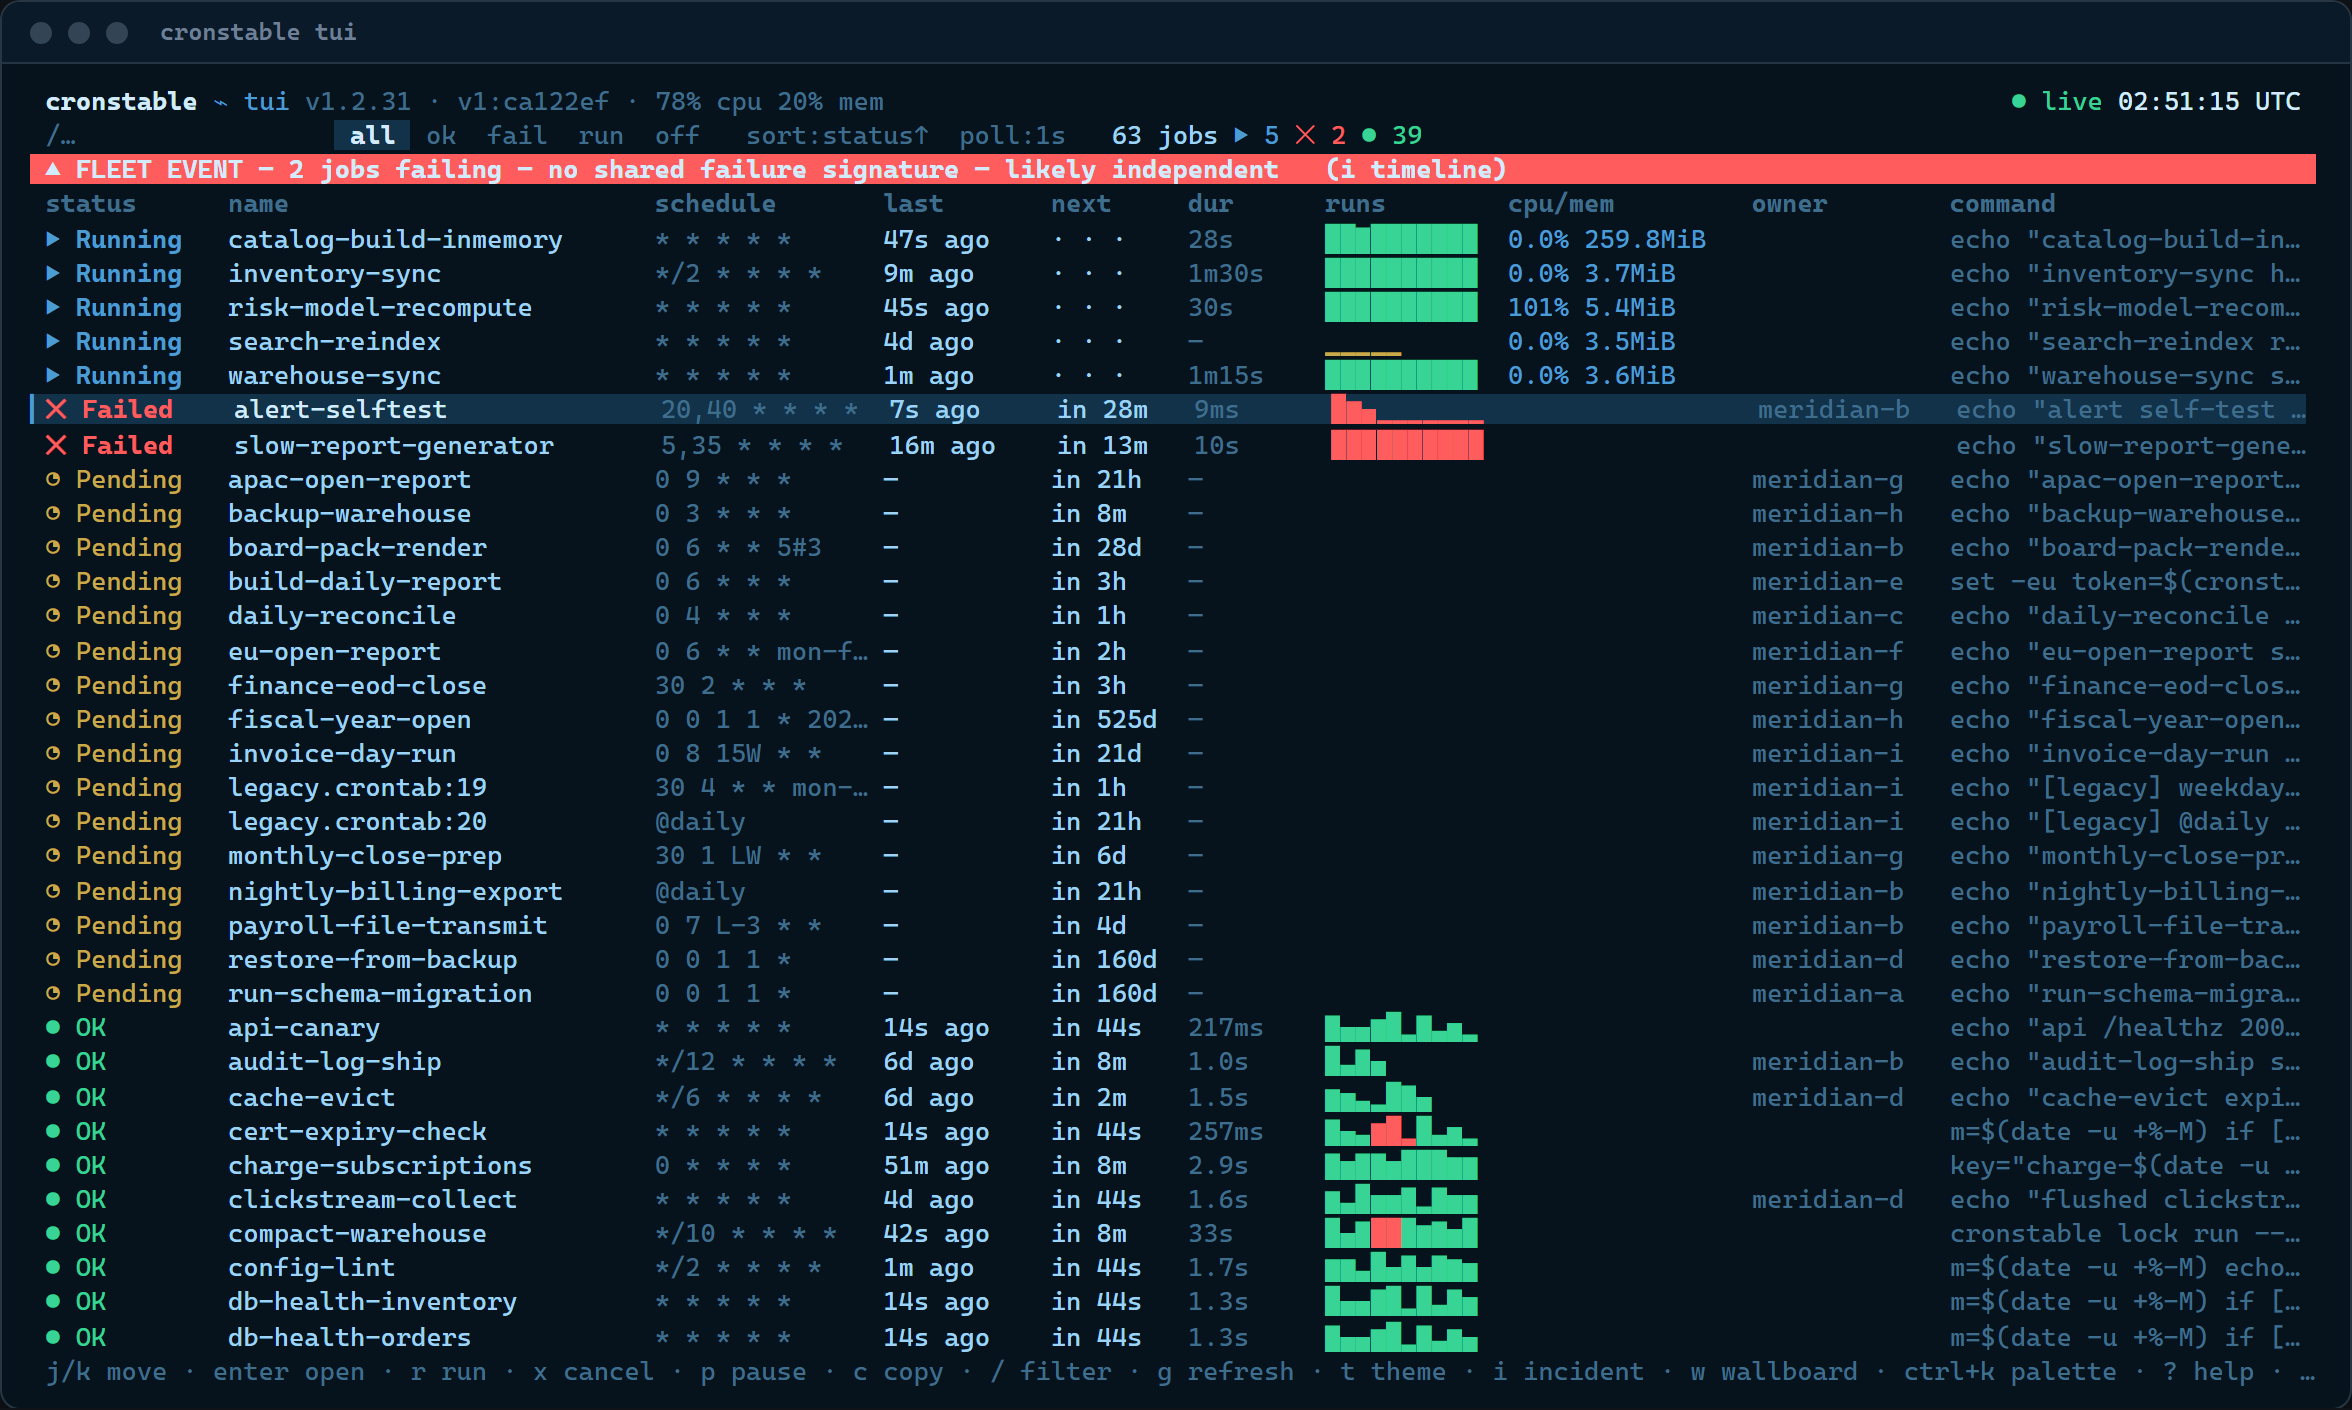
This screenshot and the gallery below show the TUI connected to the running grand tour fleet, which also appears in the web dashboard screenshots.
cronstable tui                              # local daemon on :8080
cronstable tui --url http://prod-node:8080  # a remote daemon
cronstable tui --tv                         # straight to the wallboard
cronstable tui --job nightly-backup         # deep-link a job's drawer
The TUI works on Linux, macOS, and Windows. It ships with the daemon and requires no additional dependencies.
The TUI requires an interactive terminal. If stdin or stdout is not a tty
(for example, when piped or redirected), it prints cronstable tui needs an interactive terminal (stdin/stdout are not a tty) to stderr
and exiting with code 2. On Windows it turns on the console's ANSI/VT
processing itself, so a stock Command Prompt or PowerShell window works.
It reads key events from the console, so a character outside the Basic
Multilingual Plane, such as an emoji, and a character composed with
Alt and the numeric keypad each arrive as one character. A control
character entered with Alt and the keypad acts as its key, so 013
is Enter. The TUI restores the console's input mode when it exits,
including after an error. A TUI process that is ended with Ctrl-Break
or killed leaves the console in raw input mode. For fonts missing the
status glyphs, use --ascii.
| Flag | Meaning |
|---|---|
--url URL |
Daemon web listener (default http://127.0.0.1:8080). |
--token TOKEN |
Bearer token for web.authToken-protected daemons. |
--token-env VAR |
Environment variable to read the token from when --token is absent (default CRONSTABLE_WEB_TOKEN). |
--cacert PATH |
Verify the server certificate with this CA file instead of the system trust store (default CRONSTABLE_WEB_CACERT if set). |
--client-cert PATH |
Client certificate for a listener that requires one through web.tls.clientCa (default CRONSTABLE_WEB_CLIENT_CERT if set). |
--client-key PATH |
Private key for --client-cert (default CRONSTABLE_WEB_CLIENT_KEY if set). |
--insecure |
Disable TLS certificate verification, which can expose the bearer token to an untrusted server (same as CRONSTABLE_WEB_INSECURE=1). |
--theme NAME |
Start on a theme (standard, carolina, amber, green, modern, each also as NAME-light). The choice persists (default: remembered, else standard). |
--tv |
Start on the wallboard, like opening the page at #tv. |
--job NAME |
Open a job's drawer at startup, like #job/NAME. With --tv, the drawer opens beside the wallboard. |
--poll SECONDS |
Refresh interval. 0 pauses (default: remembered, else 3). |
--boot / --no-boot
|
Force or skip the boot self-test. |
--ascii |
Plain-ASCII status glyphs for limited fonts and terminals. |
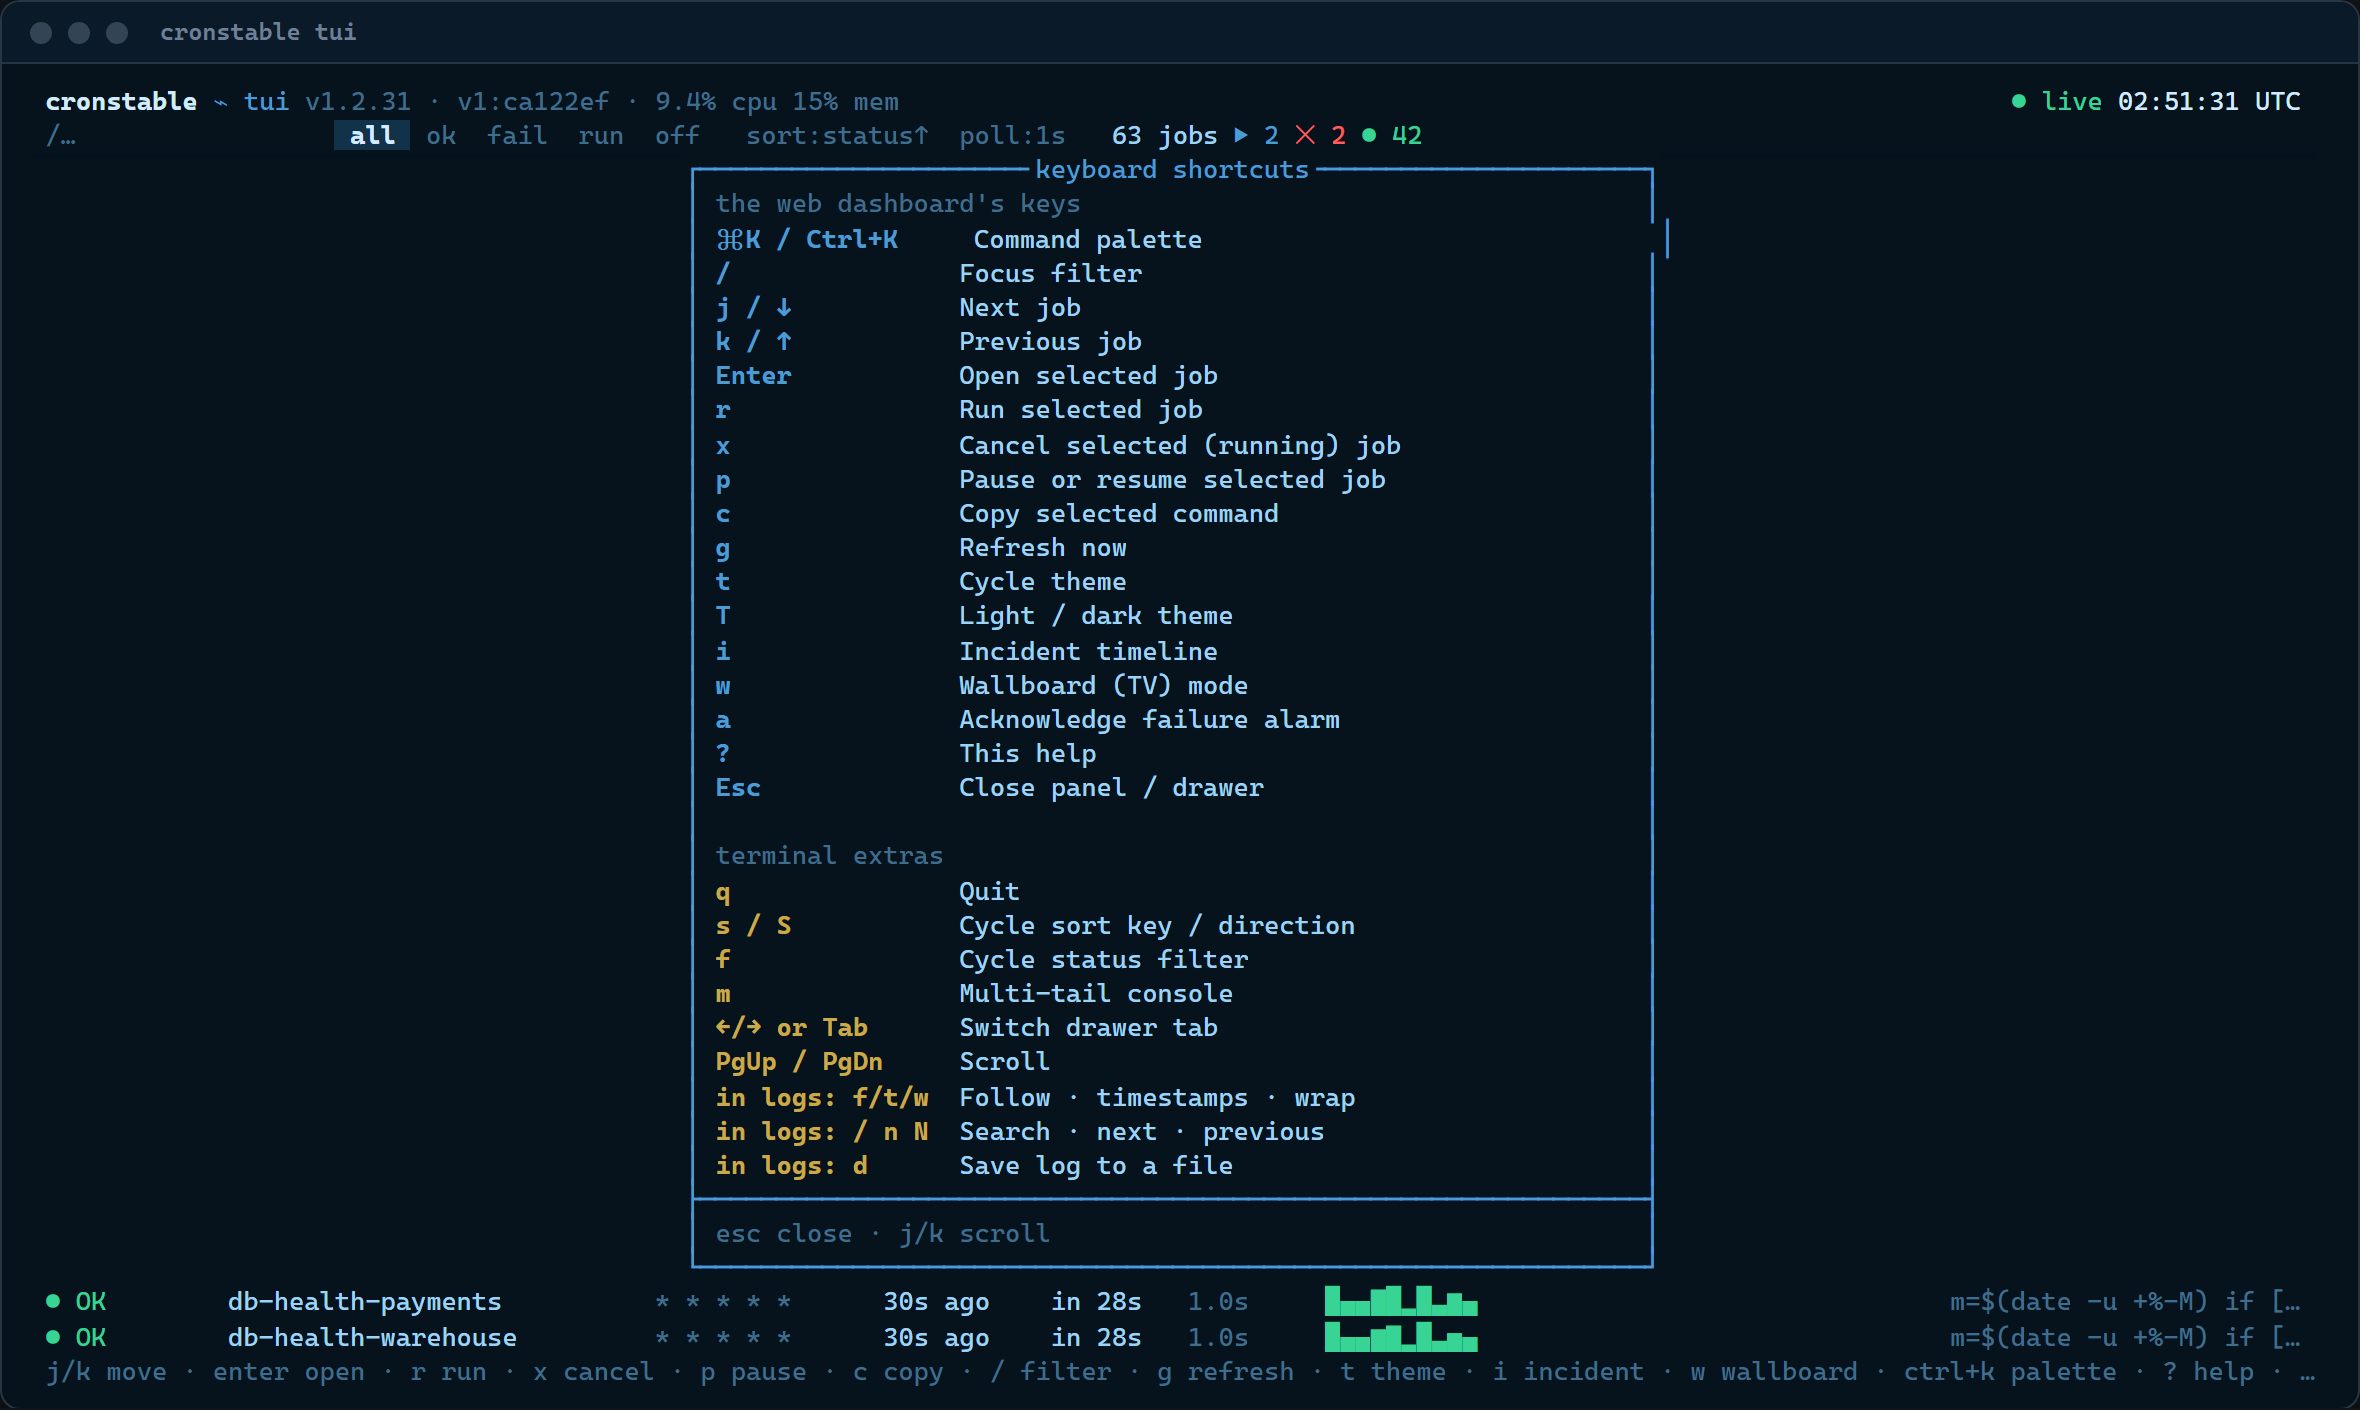
The web page's shortcut table applies verbatim to both frontends. Press
? at any time for the overlay.
| Key | Action |
|---|---|
Ctrl-K / Ctrl-P
|
Open the command palette |
/ |
Focus the filter |
j / ↓, k / ↑
|
Select the next / previous job |
Enter |
Open the selected job |
r / x
|
Run / cancel the selected job |
p |
Pause or resume the selected job |
c |
Copy the selected job's command |
g |
Refresh now |
t / T
|
Cycle theme / flip dark ↔ paper |
i |
Incident timeline |
w |
Wallboard (TV) mode |
a |
Acknowledge the failure alarm |
? |
The shortcut overlay |
Esc |
Close the open panel or drawer |
Terminal-only extras are grouped separately in the ? overlay. q
quits, s/S cycle the sort key/direction, f cycles the status
filter, m opens the live logs panel, ←/→ (or Tab and
Shift-Tab) switch drawer tabs, and PgUp/PgDn scroll.
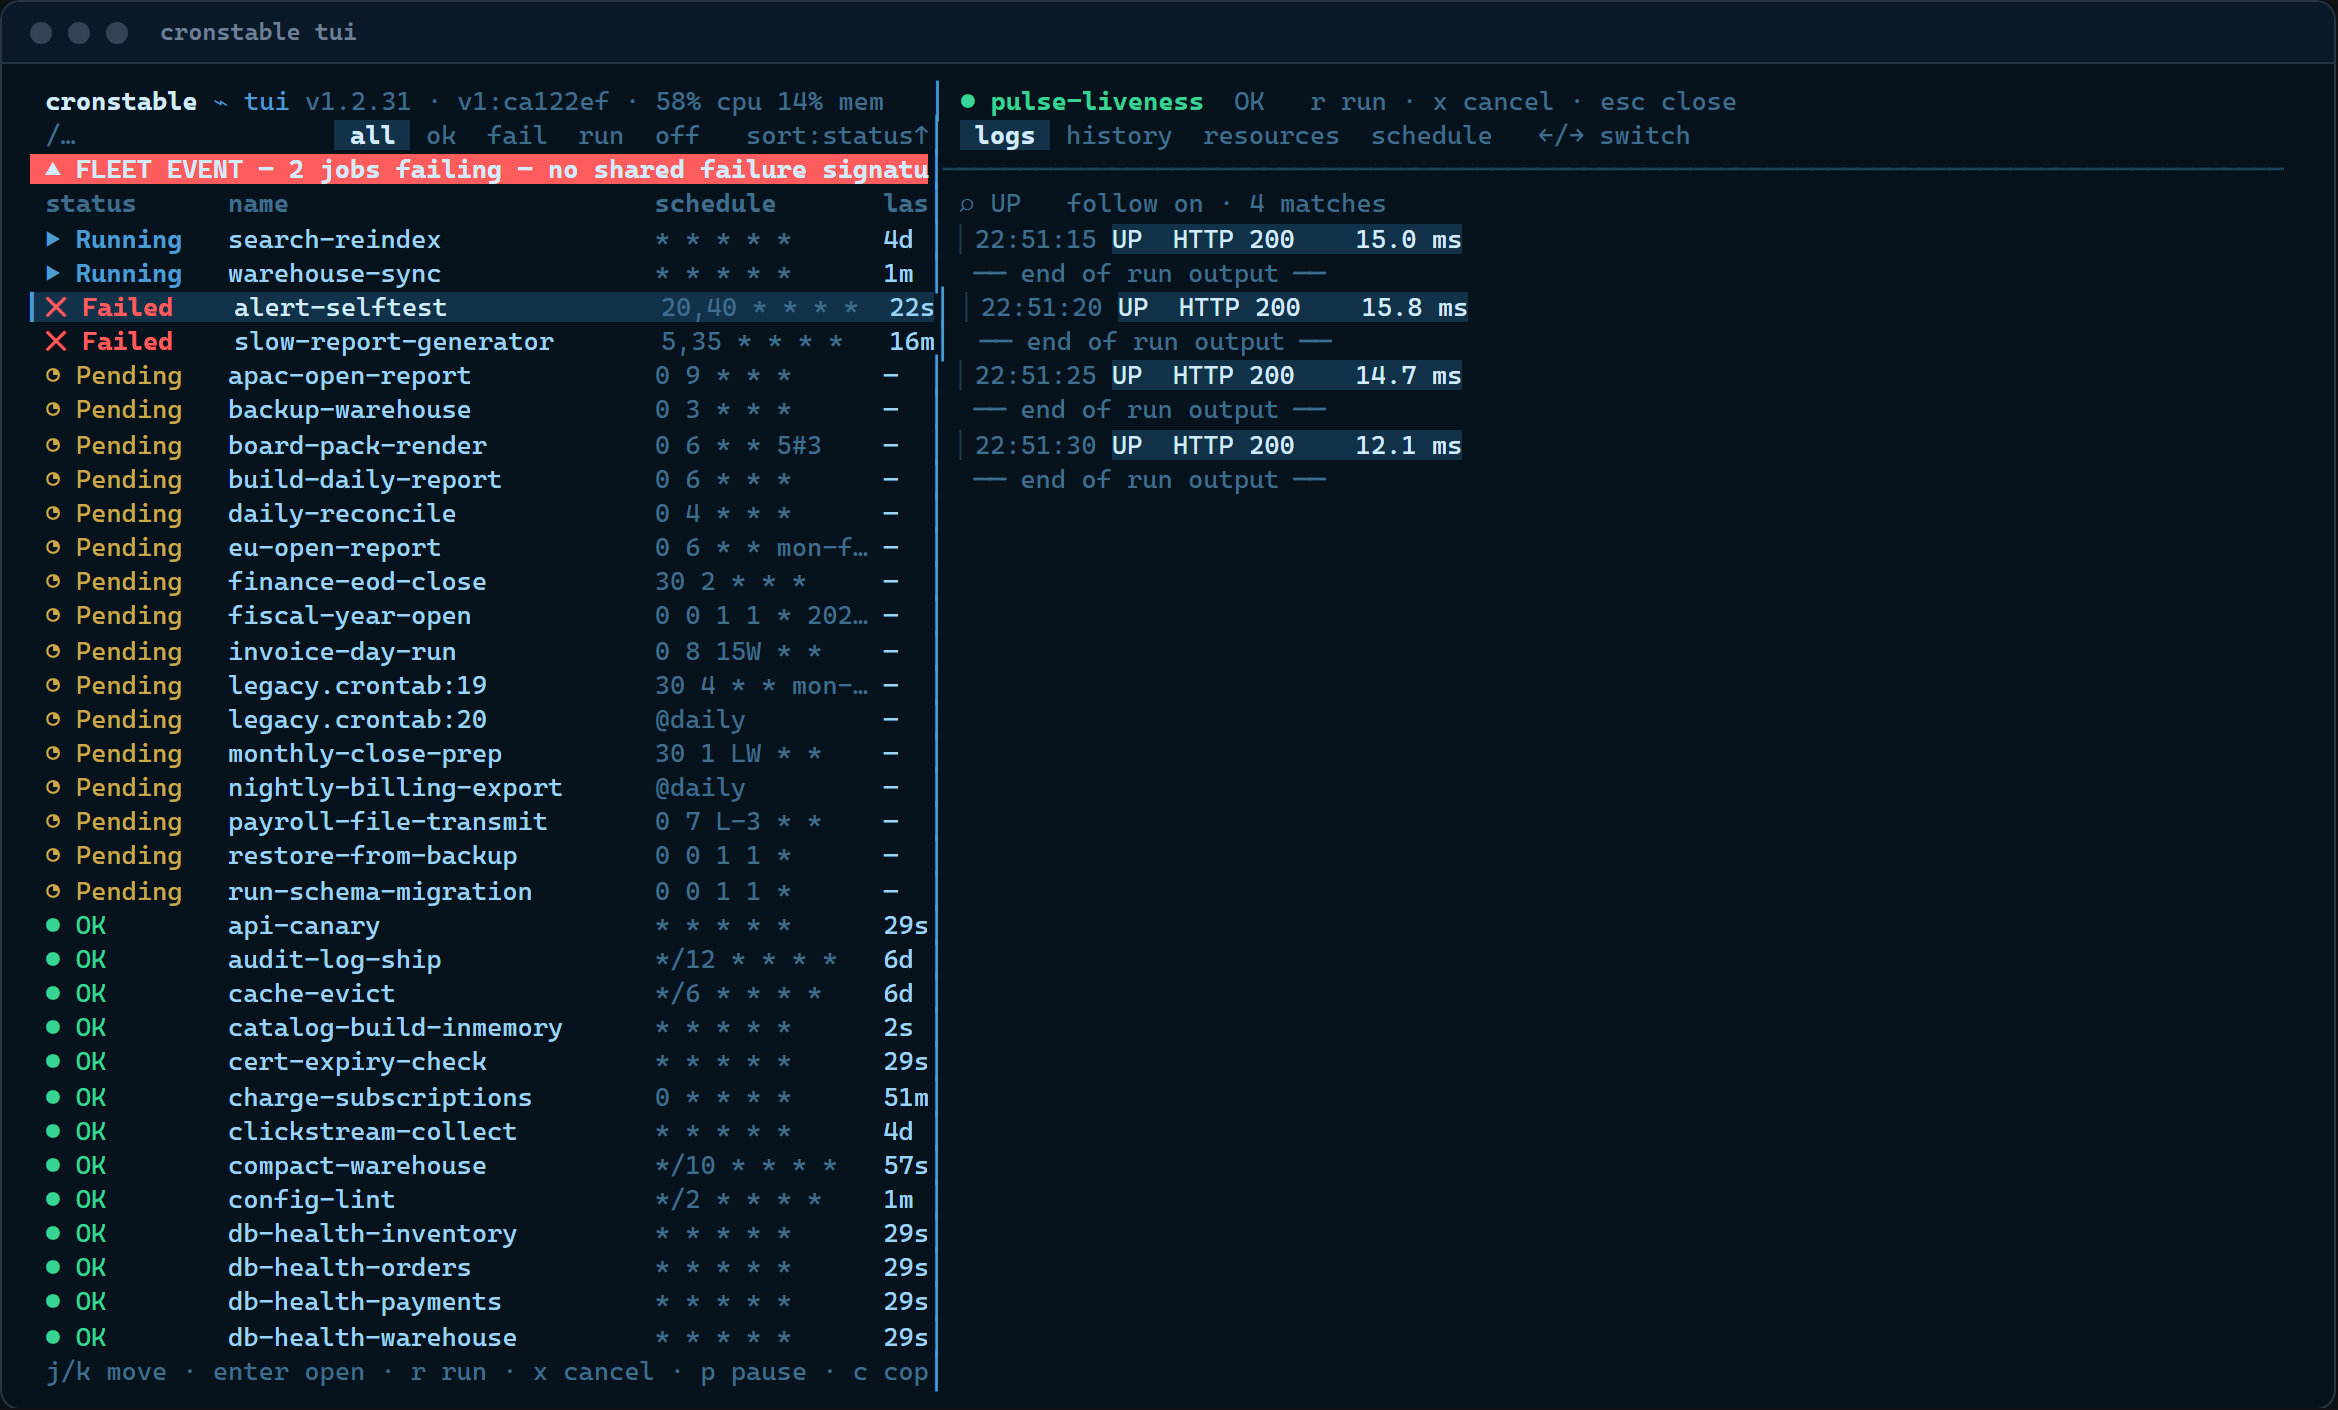
Inside the Logs tab, f/t/w toggle follow/timestamps/wrap;
/ searches, with n/N for next/previous match; and d saves the
log to your home directory as
cronstable-<job>-<YYYYmmdd-HHMMSS>.log (a toast confirms the exact
path).
On every platform except Windows, Esc is also the first byte of each
navigation key that the terminal sends, so the TUI takes an Esc on
its own as the key once 30 ms pass with no more input. Two Esc
presses that arrive within that gap both act as Esc when it passes.
Each closes one layer, the panel or drawer on top first.
Some terminals send Alt as an Esc ahead of the key's own sequence,
such as ESC ESC [ A for Alt with ↑. The TUI reads a navigation
key with that prefix as the plain key. In CSI form it reads the arrows,
Home, End, PgUp, PgDn, Insert, and Delete, with or without
a modifier parameter, and Shift-Tab without one. In SS3 (application
cursor) form it reads the arrows, Home, and End, without a
parameter. The key acts in the open panel or drawer as it does without
Alt, and the panel or drawer stays open, as it does for the xterm
form ESC [ 1;3 A. A key with the prefix that the TUI does not bind,
such as a function key, does nothing.
The TUI includes:
- The jobs board: status glyphs, next-fire countdowns, last-run
ages, duration sparklines, live CPU/memory chips for monitored jobs,
the owner column under a spread cluster, filtering, sorting, and the
status segments. The filter matches job names and commands, and text
pasted into it rebuilds the board once (see
pasting text). A paused job
shows the
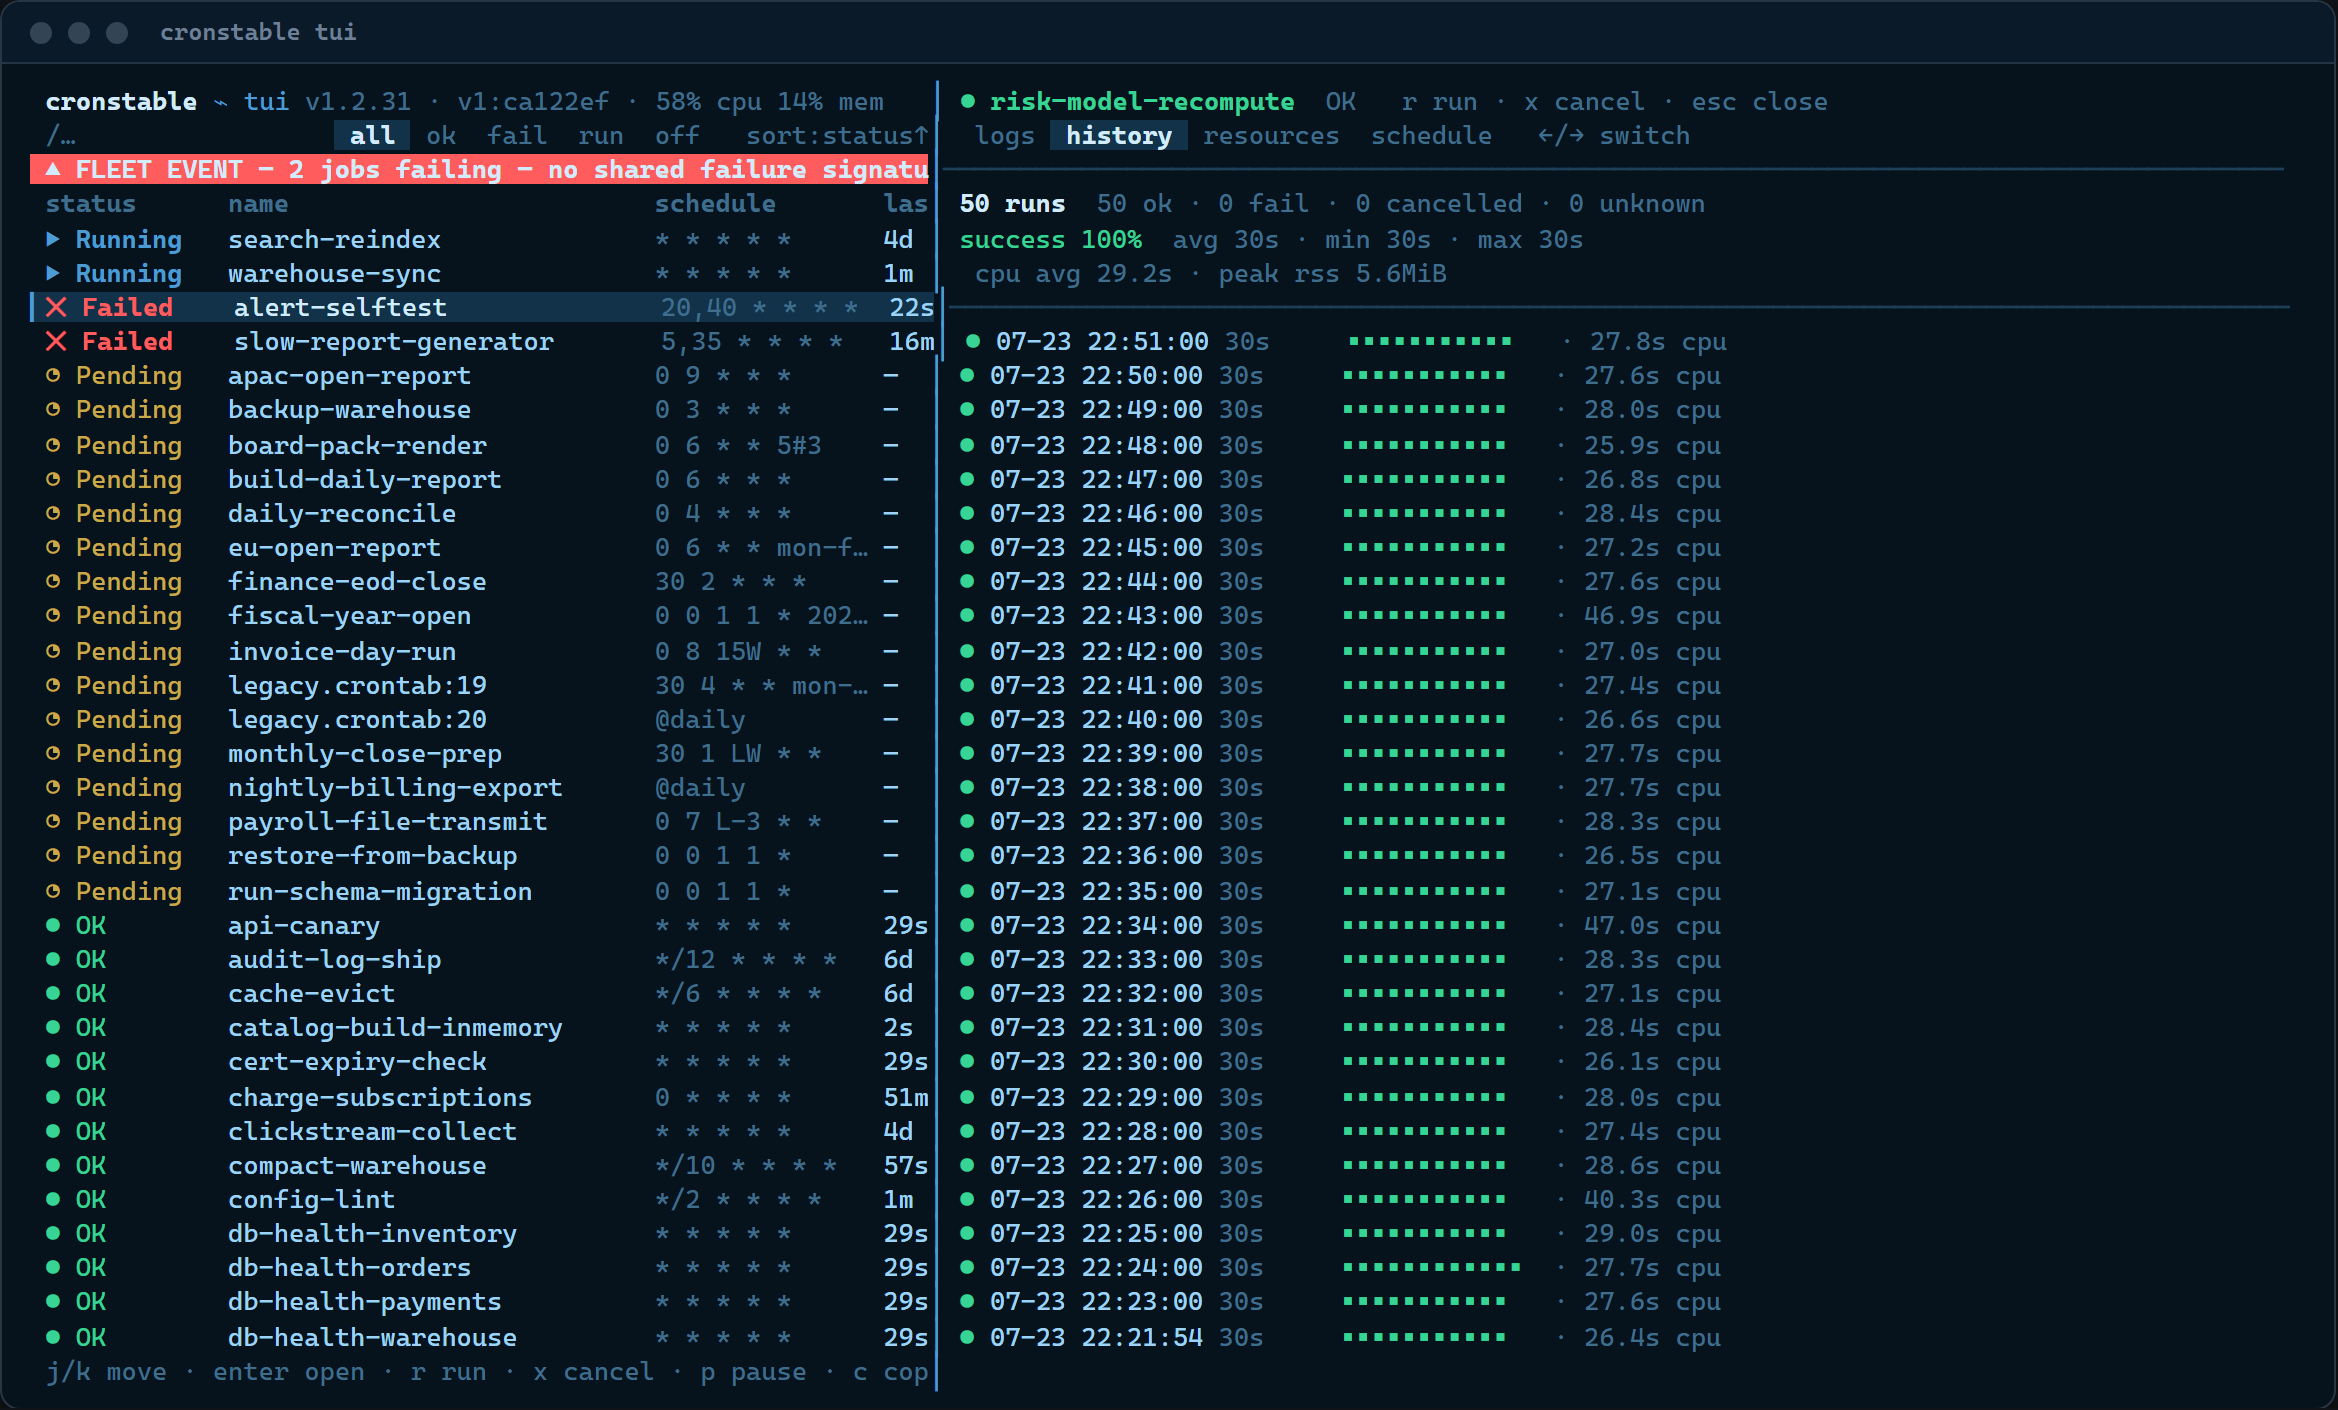
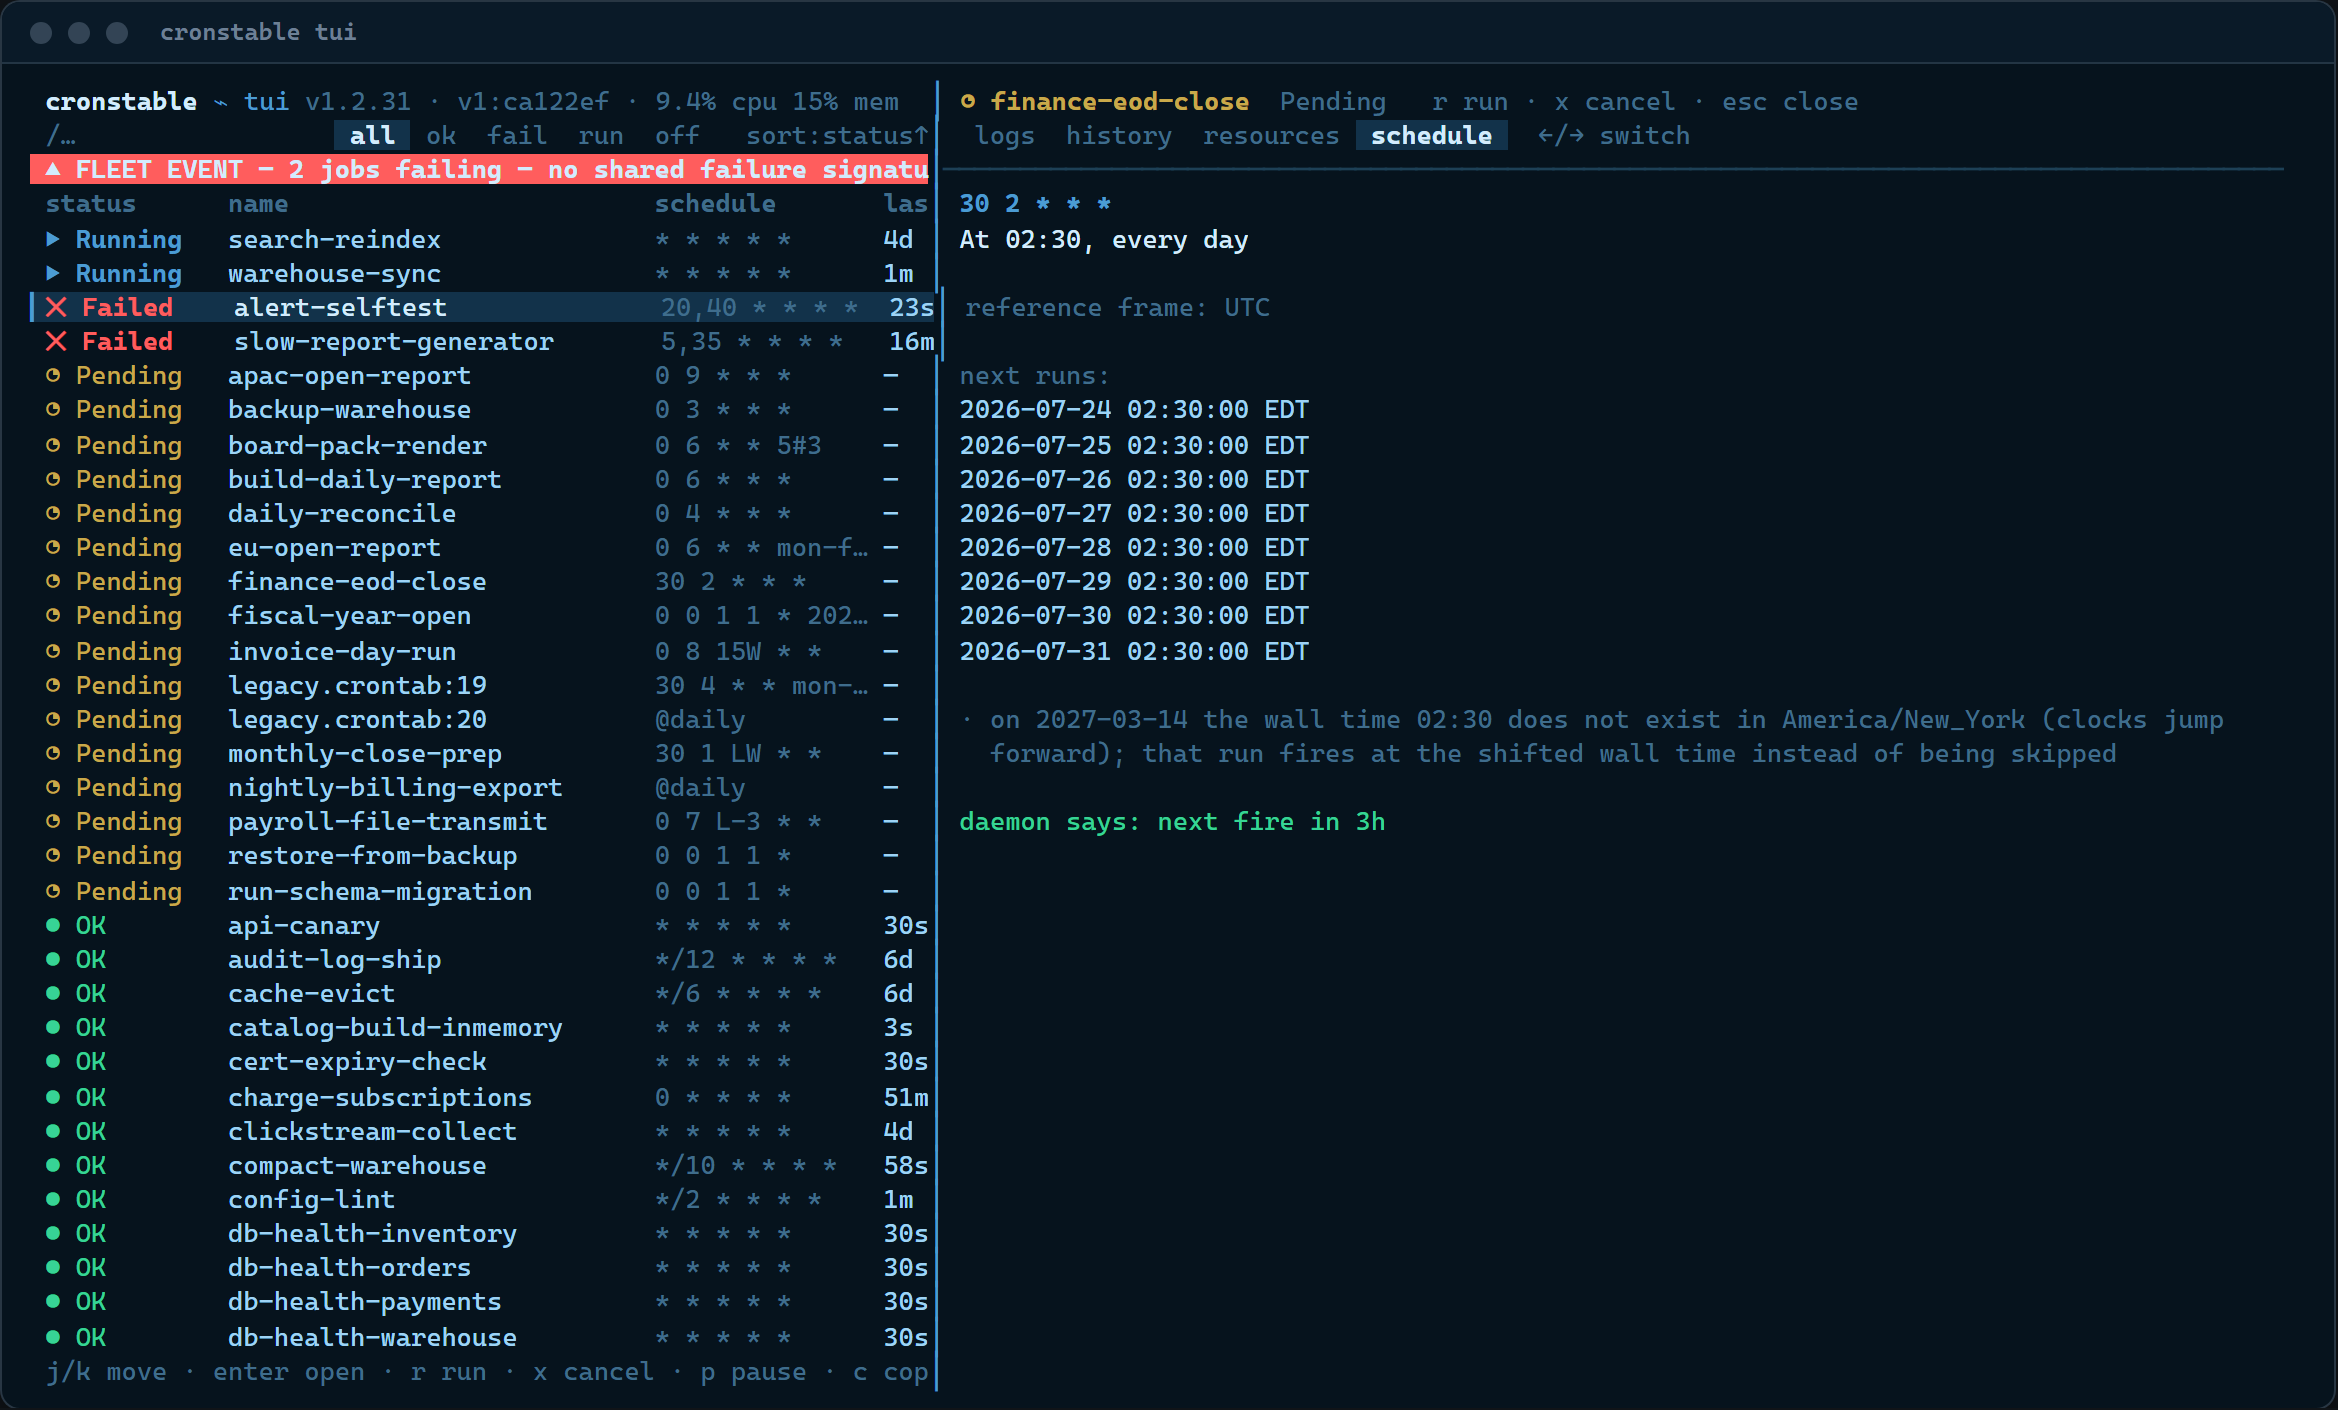
⏸glyph (pin--asciimode) with⏸ til HH:MMin the next-fire column, andptoggles pause/resume (also in the palette). A job late on a service level agreement (SLA) check carries an OVERDUE suffix in its status cell and wallboard tile. - The job drawer: the live Server-Sent-Events (SSE) log tail (ANSI colors adapted to the theme, search, follow, wrap, timestamps, save-to-file), run history with success rate and per-run bars, resources for monitored and capped jobs (see the Resources tab), and the schedule tab, whose plain-English text and next-fire preview come from the daemon's own cron engine.
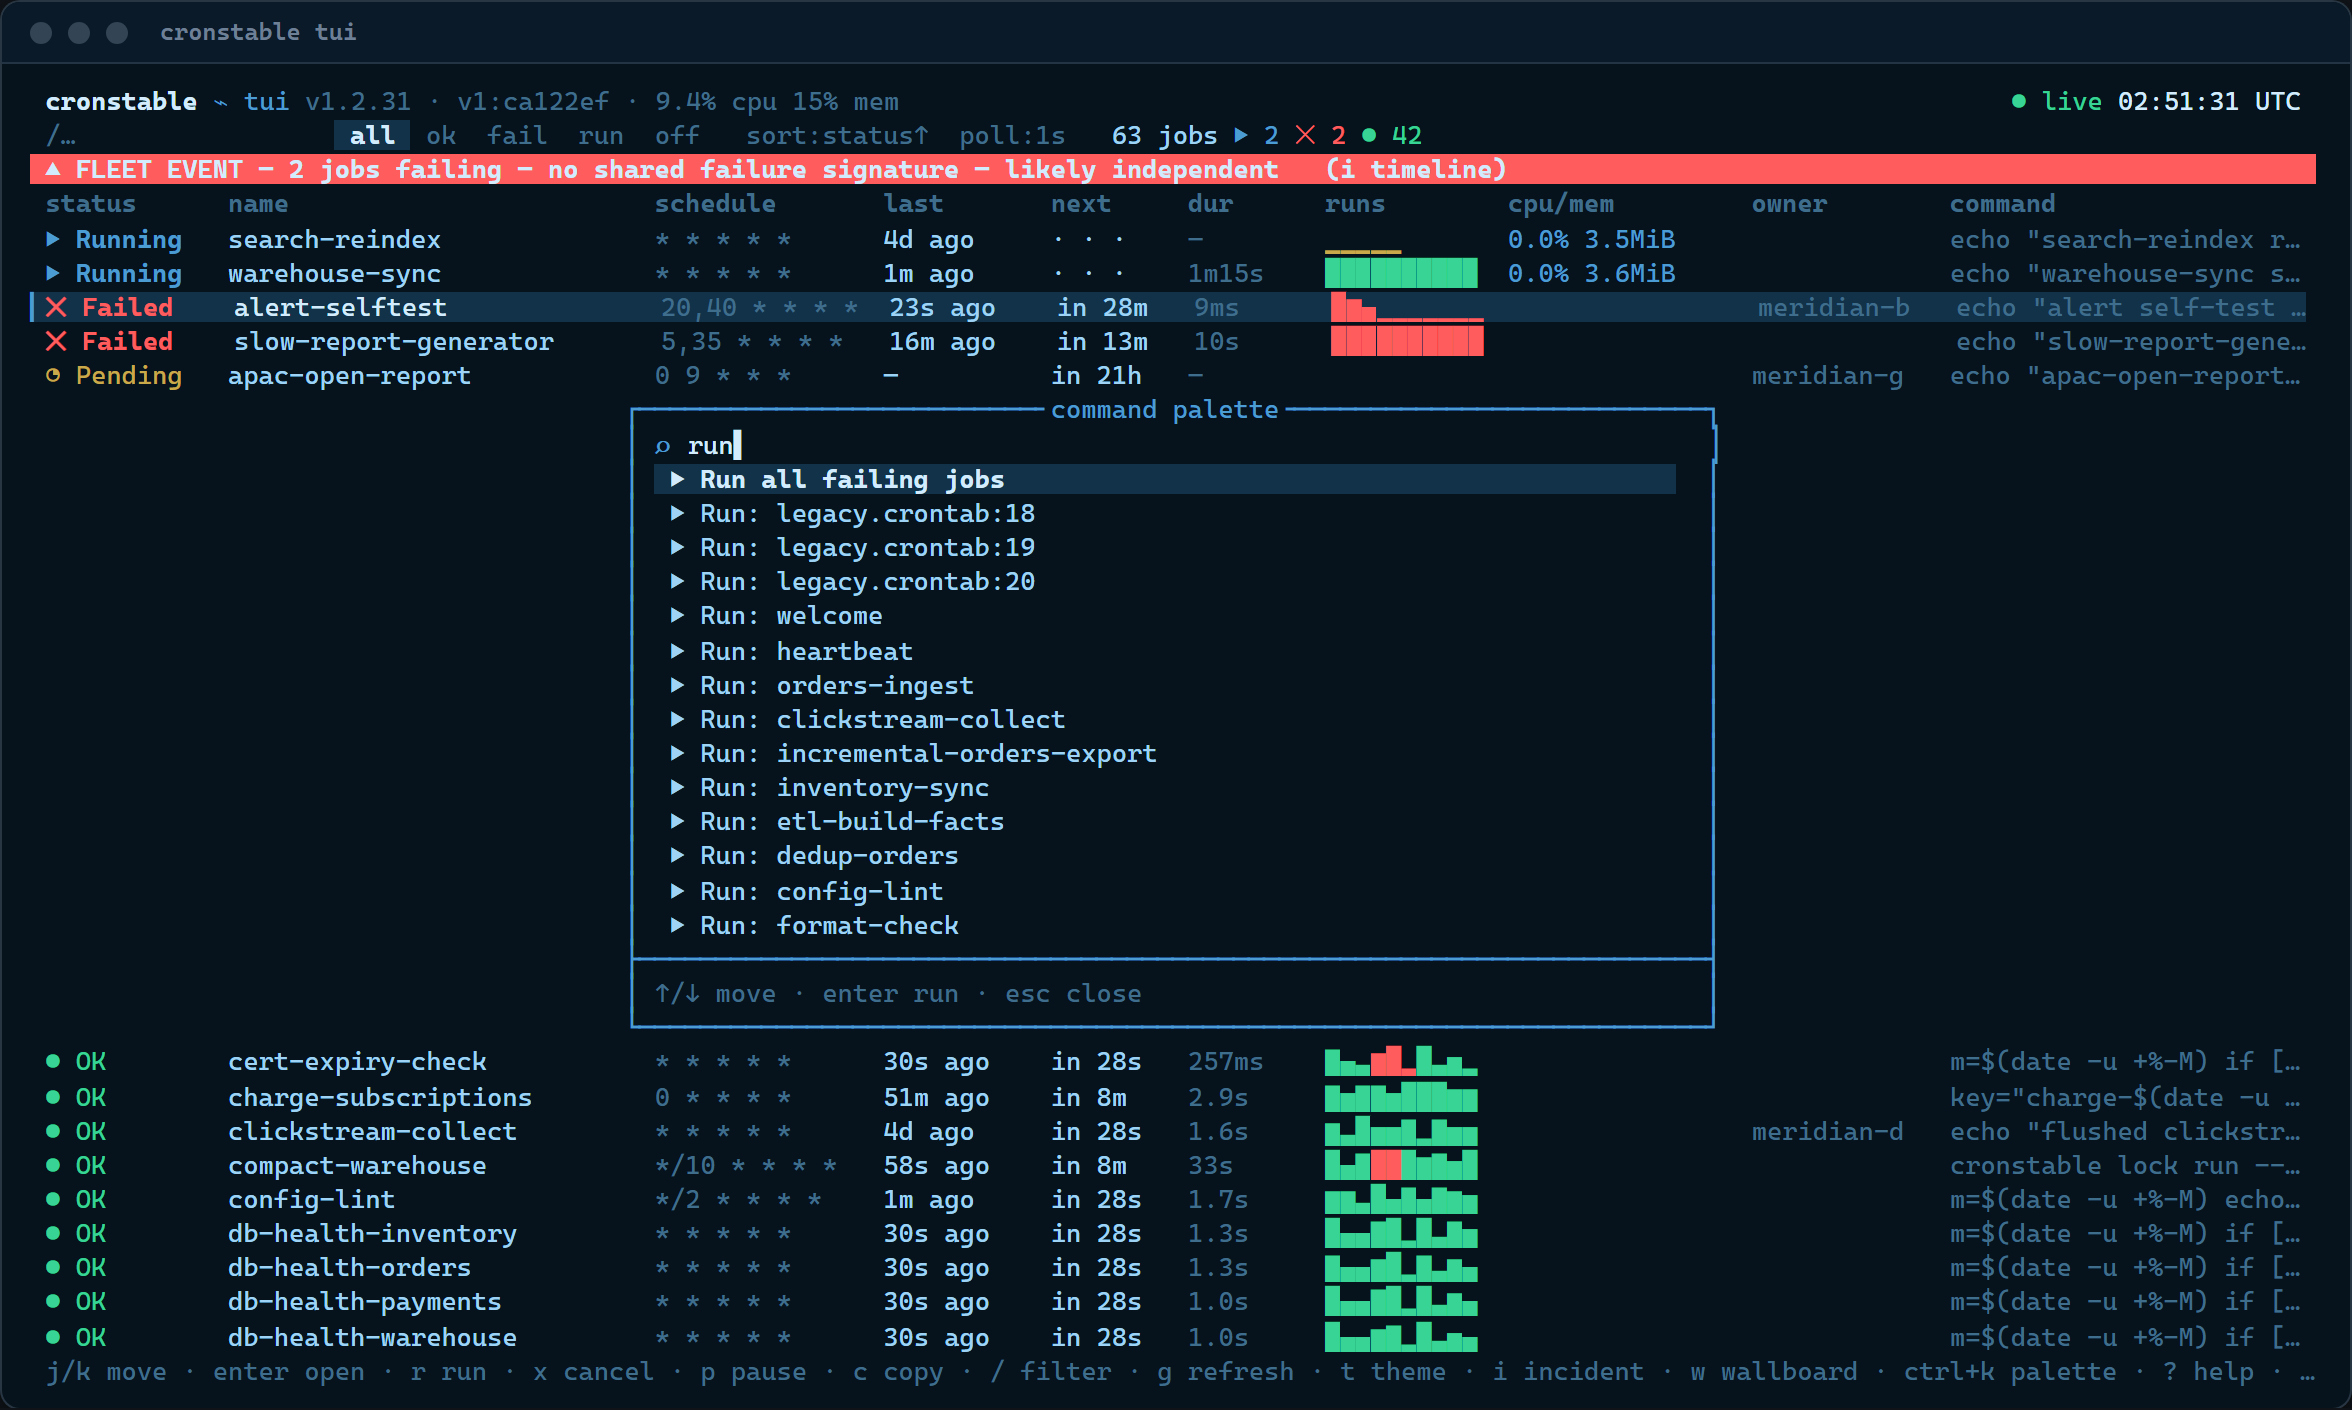
- The fuzzy command palette, with the same global, per-job, and per-DAG (directed acyclic graph) actions.
- The verdict bar and incident timeline, with the same
failure-correlation logic ("×4 share exit code 69 — may share a cause").
The job actions panel has staggered bulk start/cancel, stop sending,
and a Markdown incident writeup, copied to the clipboard and saved
to
~/cronstable-incident-<YYYYmmdd-HHMMSS>.md. If the file write fails, the clipboard copy still stands. - The live logs panel: up to four jobs' live logs merged with identity-colored prefixes.
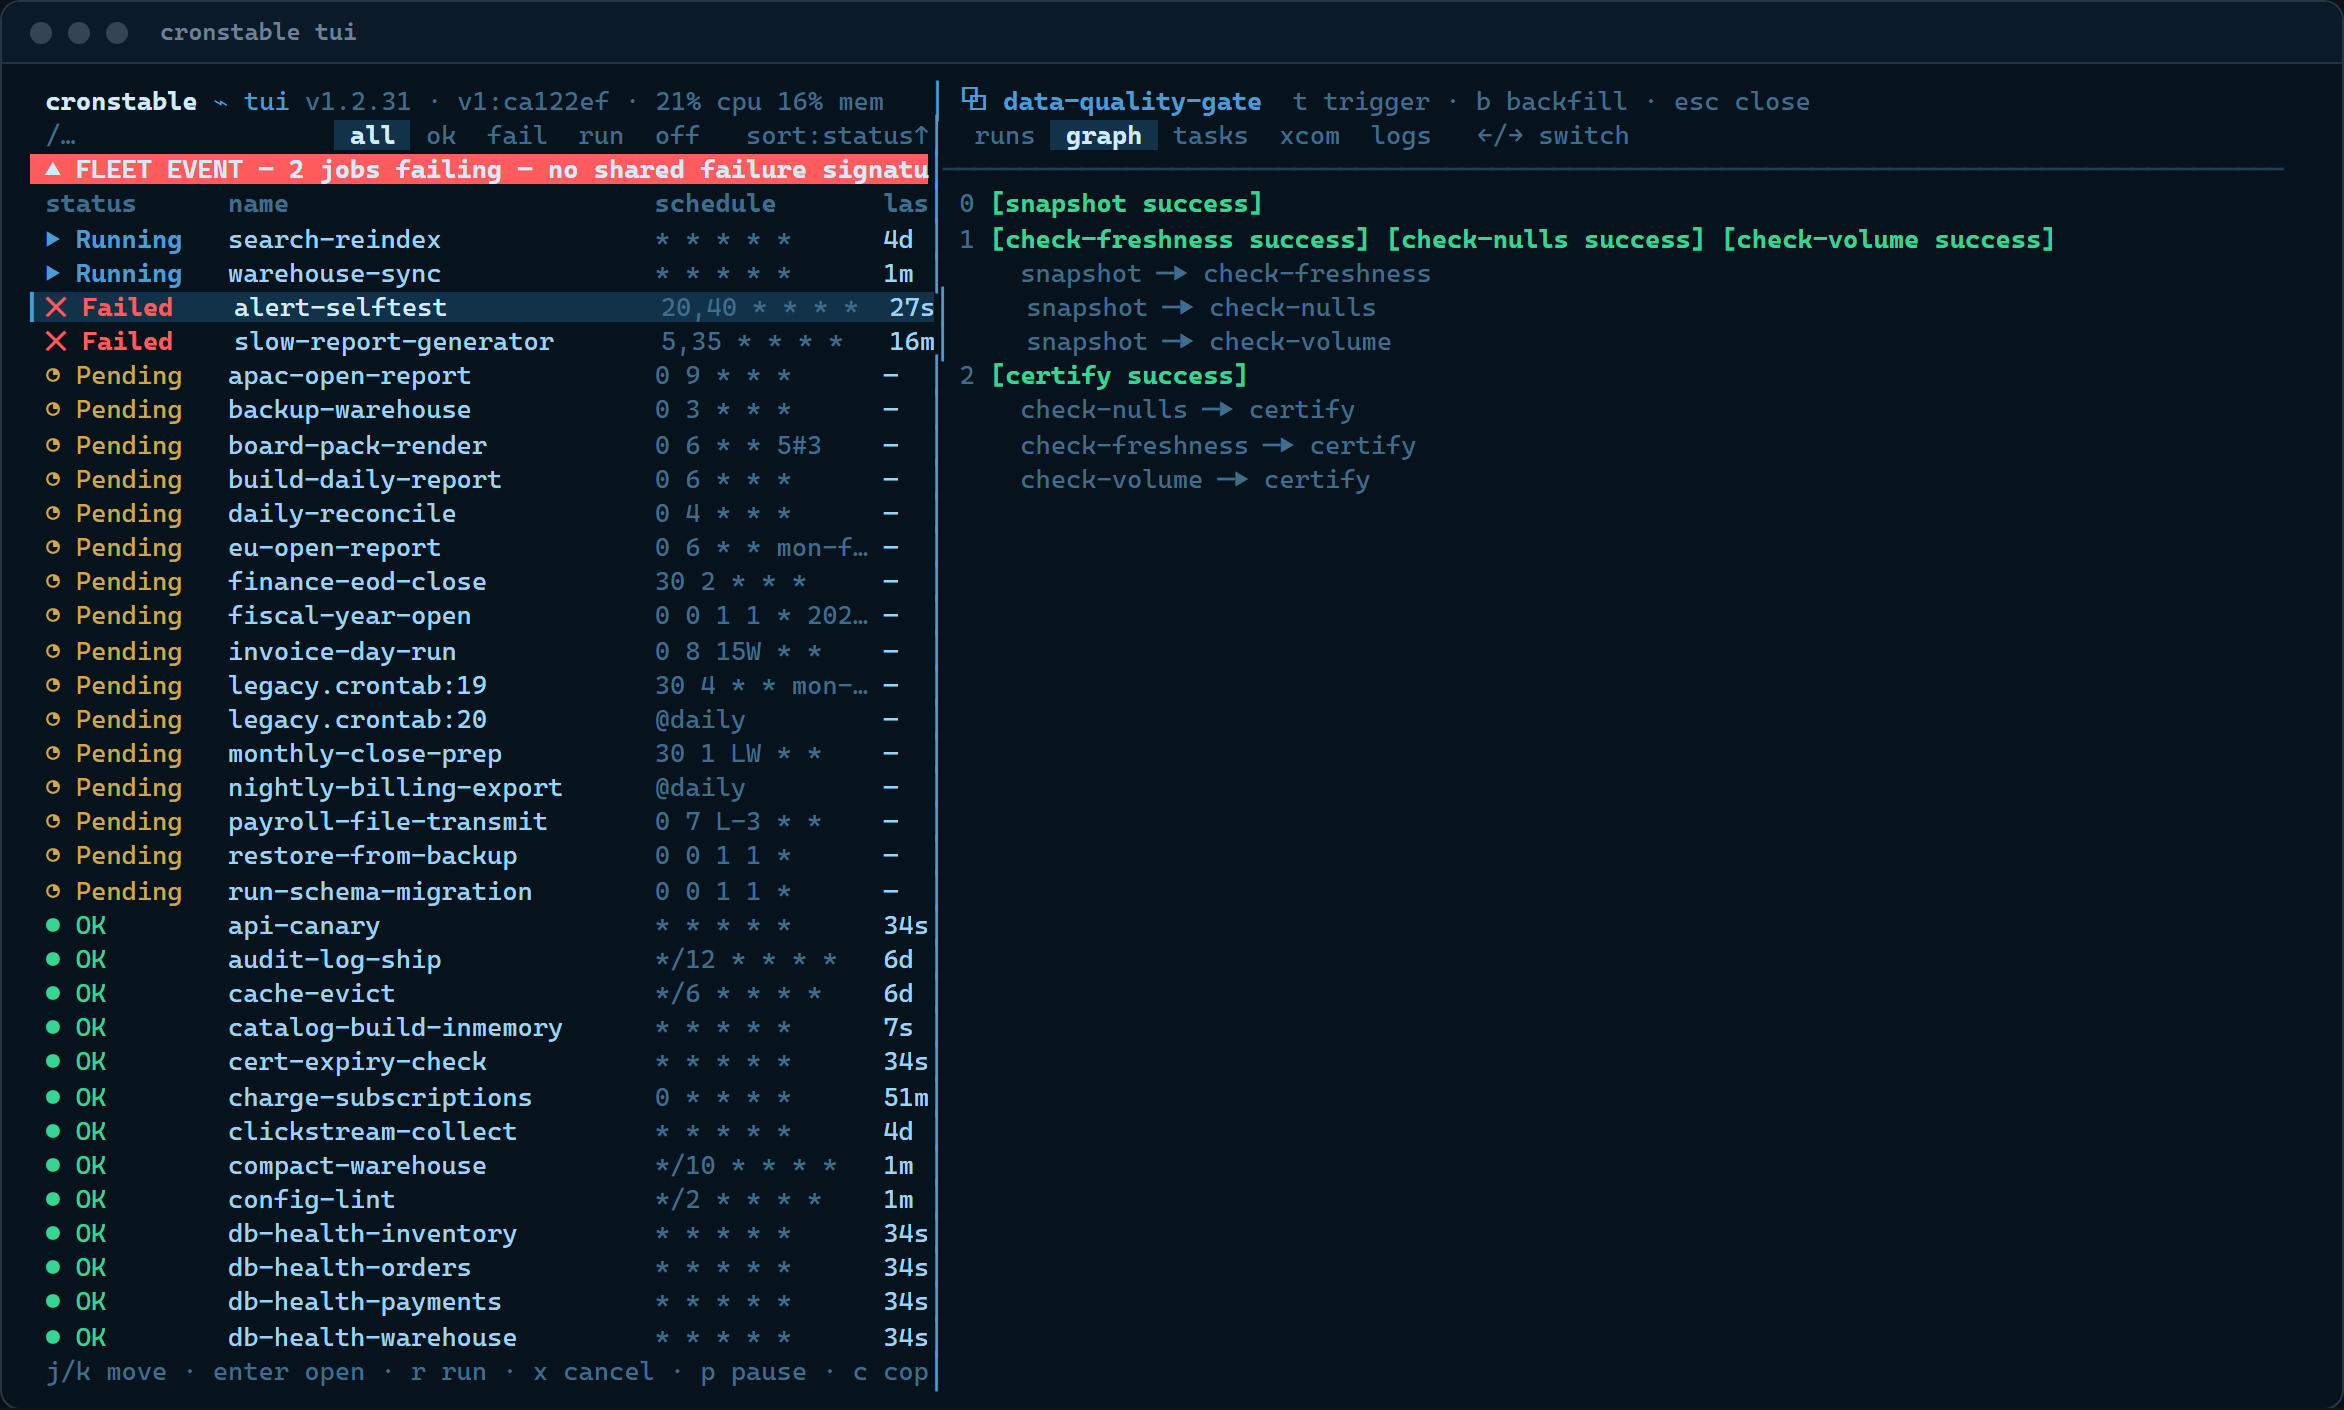
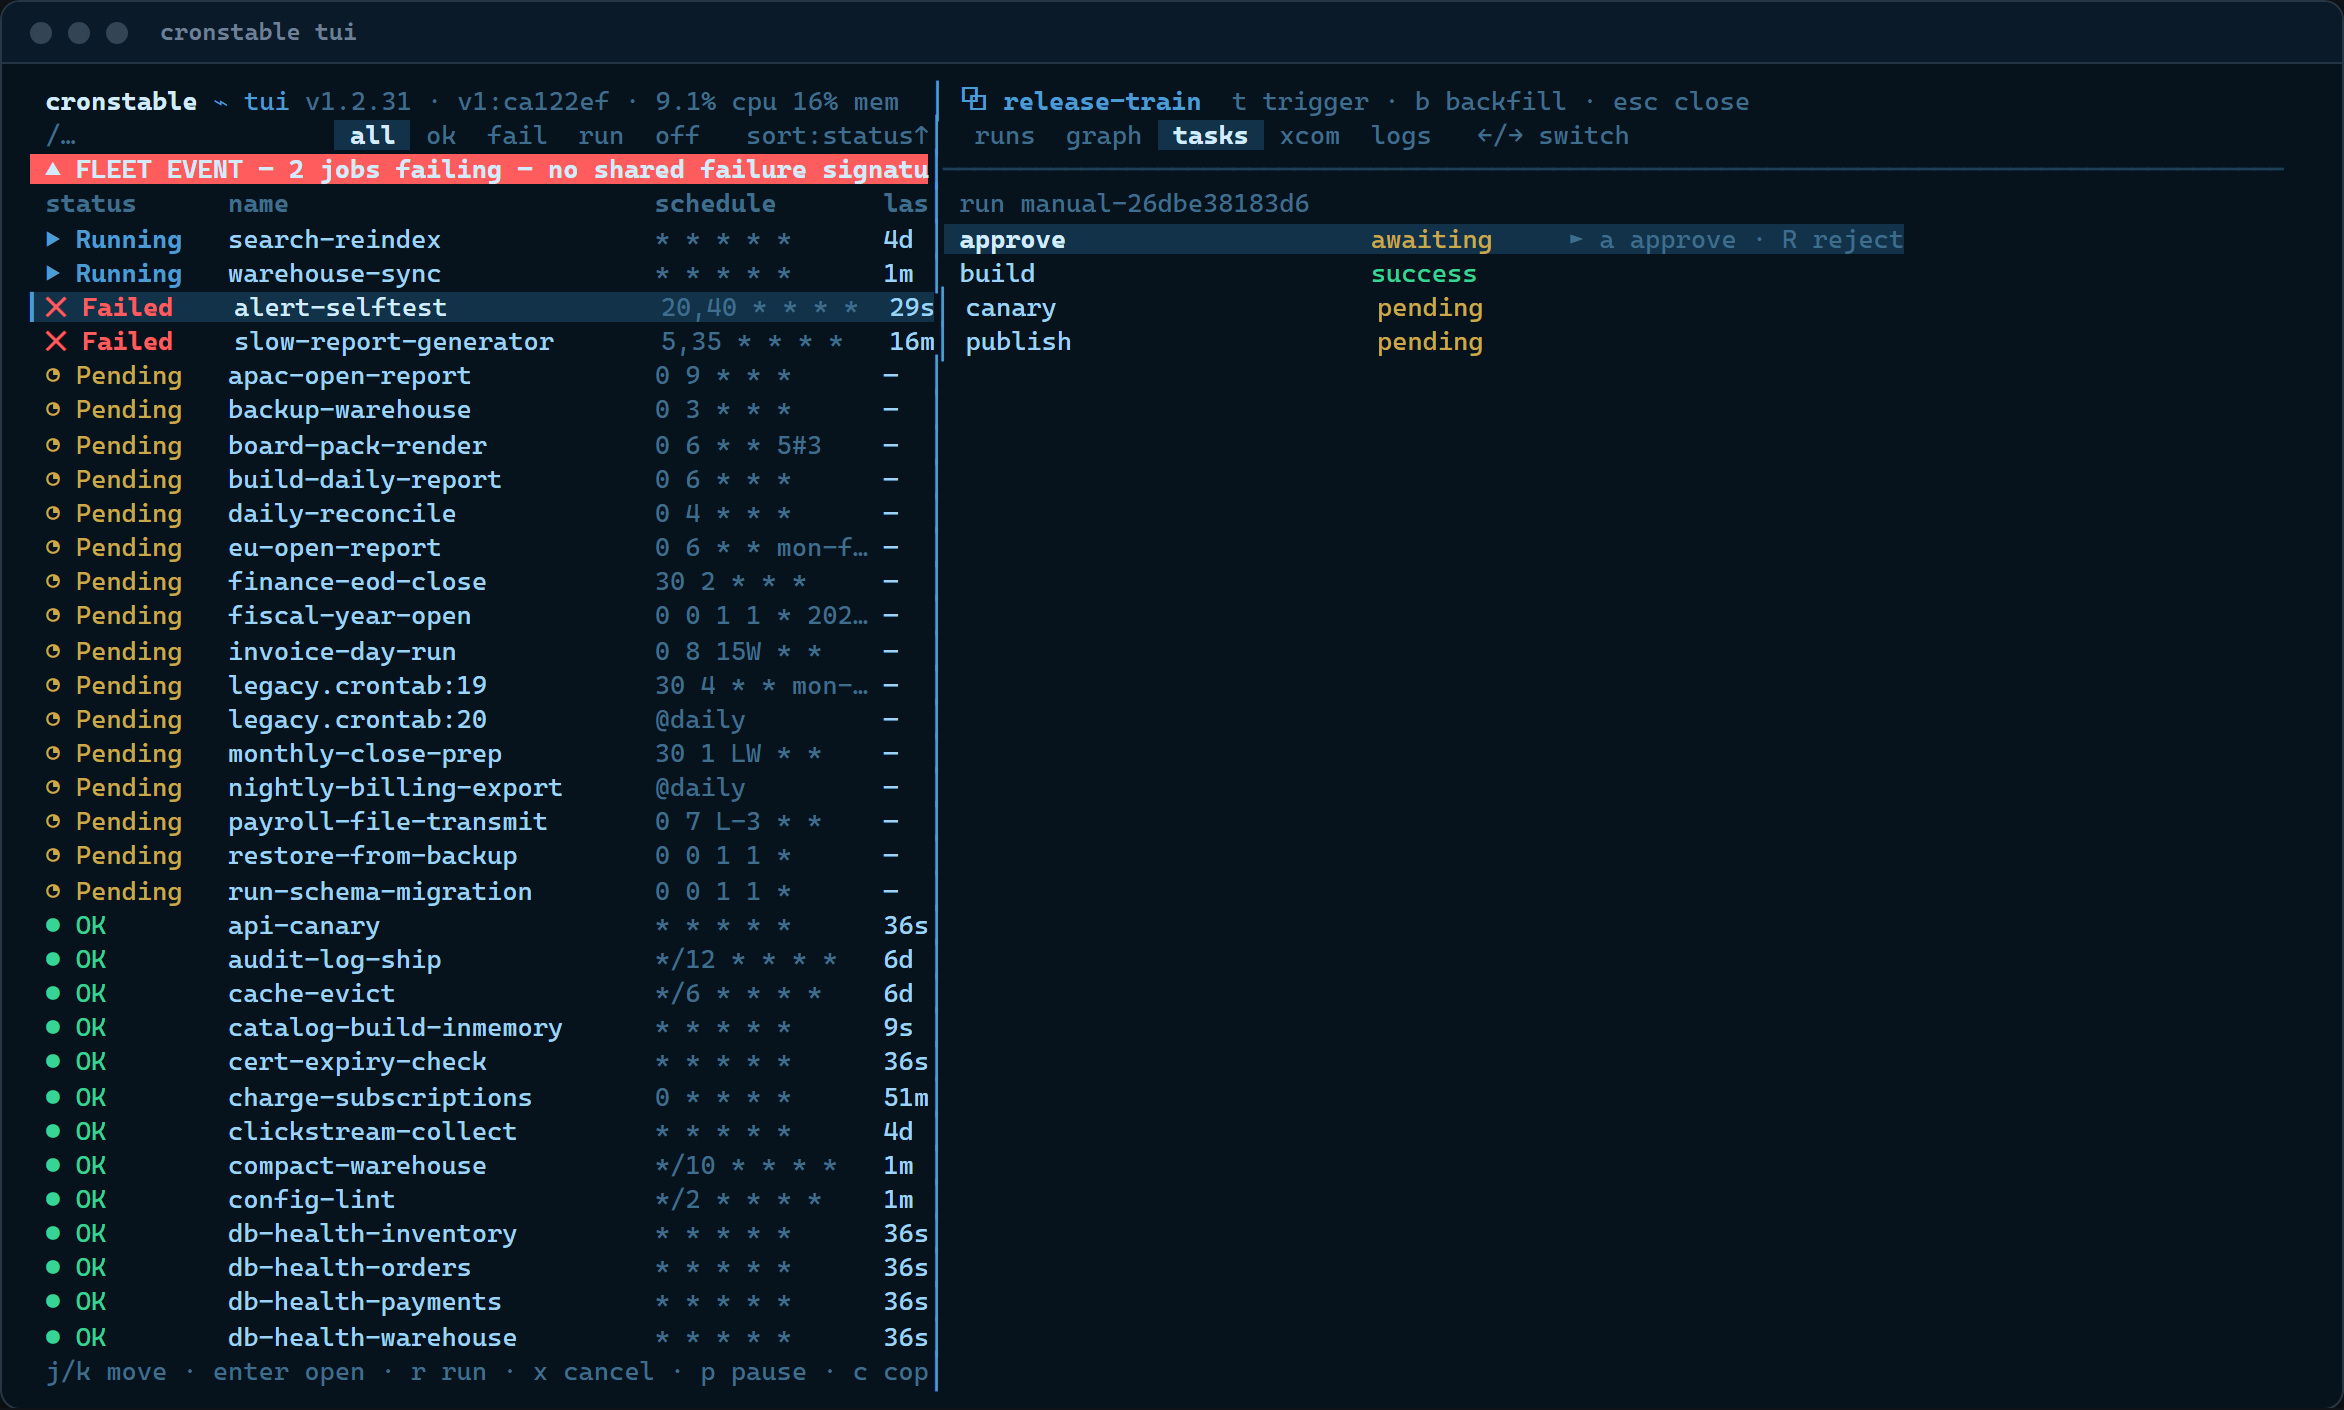
- The workflow drawer: runs, an ASCII task graph, per-task states and
attempts, approval gates (
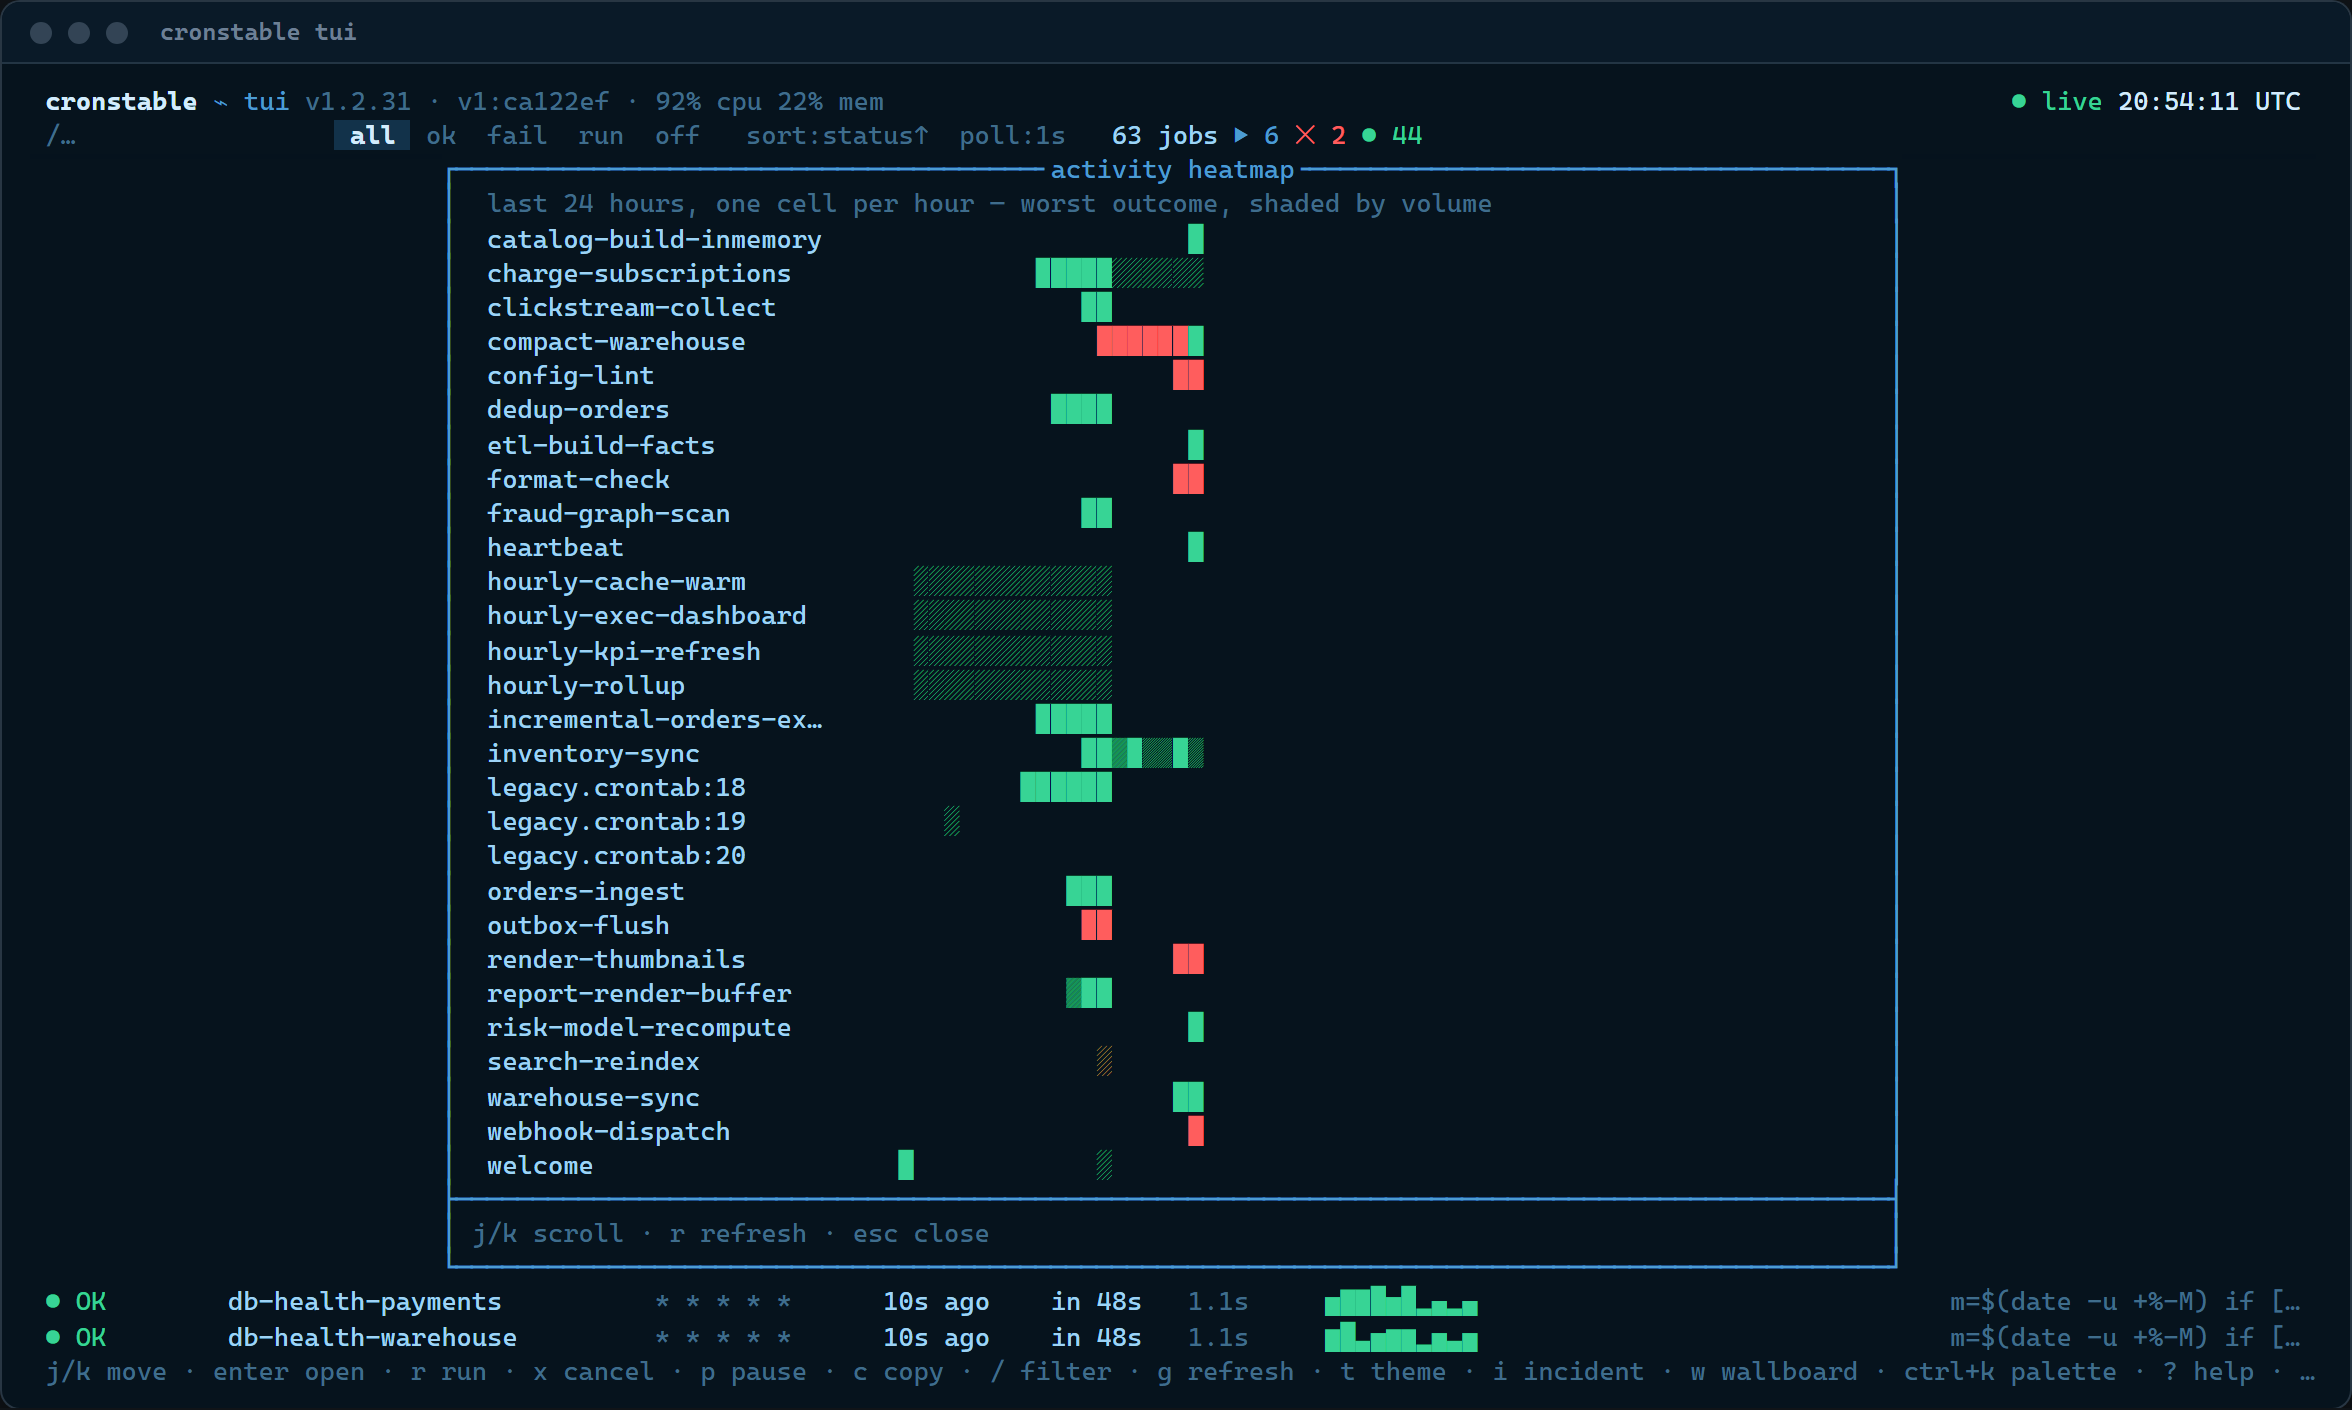
aapprove /Rreject), XCom (cross-communication) values, task logs, trigger and backfill. - The cluster panel, fleet matrix (jobs × nodes, failing-only filter), node resources, activity heatmap punchcard, and upcoming runs.
- The schedule load overlay (
Ctrl-K→ "Toggle schedule load"): the next 24 hours of scheduled runs as an hour-by-minute collision grid with a minute histogram, the fleet's duplicate-schedule groups, and the least-loaded-slot suggestions, computed locally from the/jobssnapshot with the daemon's shared analyzers (see schedule load), so it works against older daemons too. - The week calendar overlay (
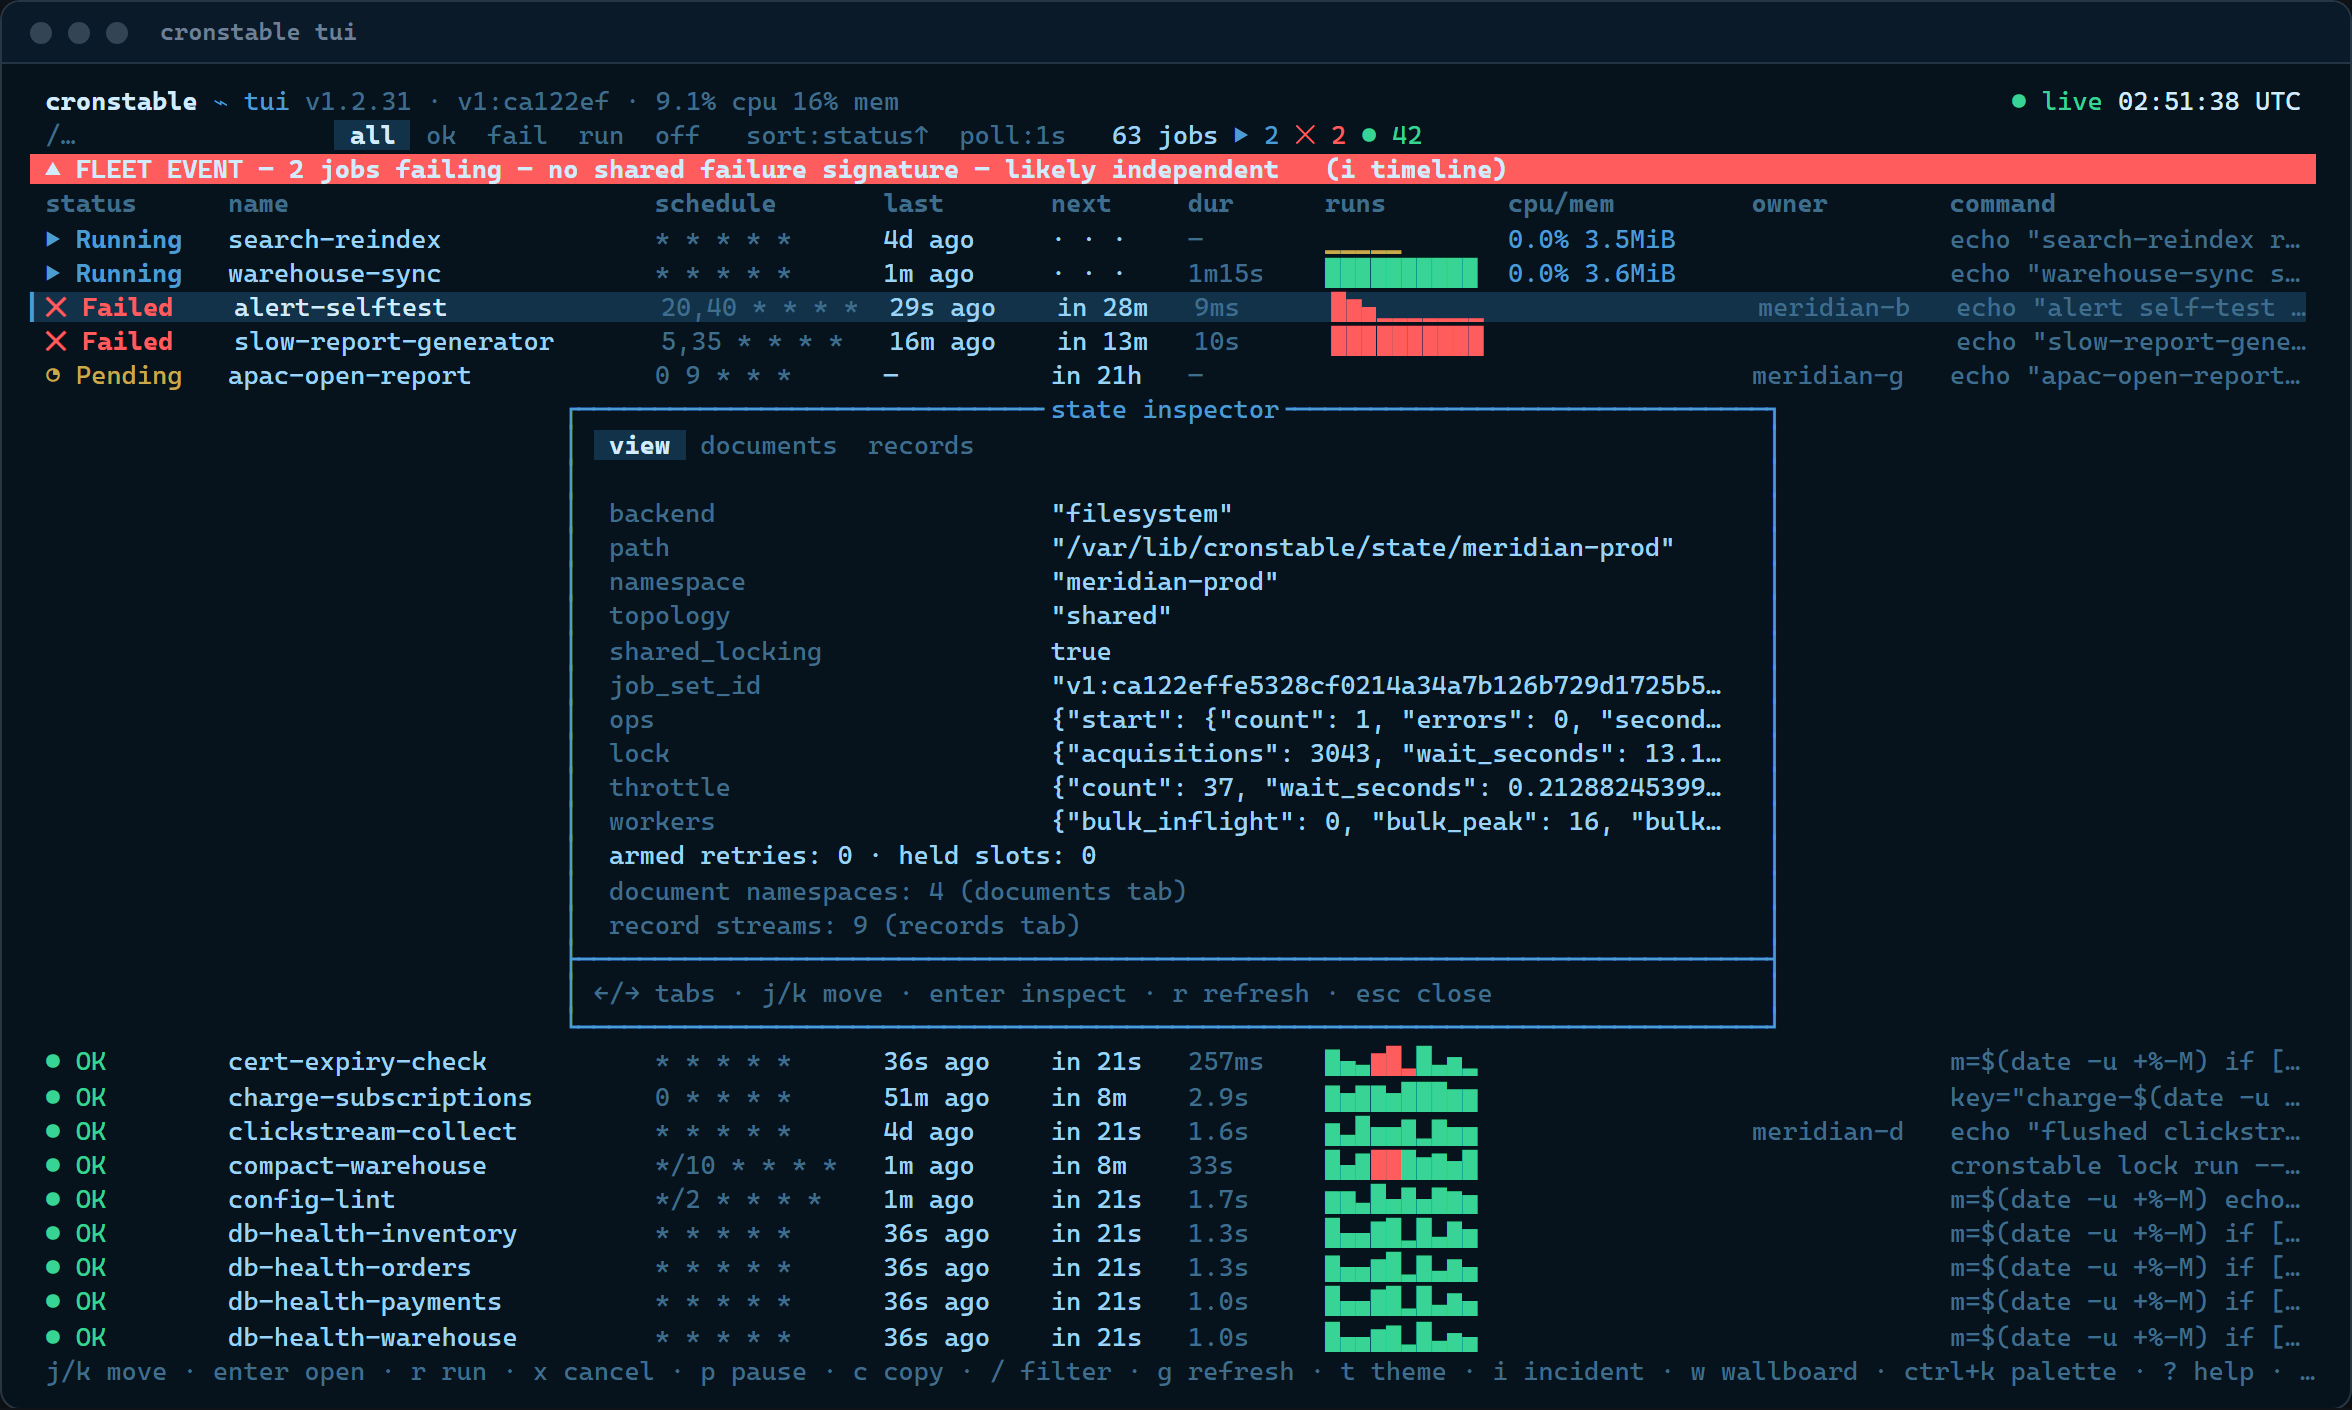
Ctrl-K→ "Toggle week calendar"): a seven-day schedule with a day-by-hour grid and chronological agenda in UTC. Frequent jobs appear in a background hum summary, with one line per job. Like schedule load, the calendar is computed locally (see calendar export). - The state inspector for the durable store (inventory, document namespaces, record streams).
- The schedule preview (
Ctrl-K→ "Schedule preview"), evaluating expressions live against the daemon's own engine, with the schedule linter's advisory findings inline. A job's schedule drawer shows the same findings in the job's own time zone, so DST notes carry real dates. - The Pair a device panel (
Ctrl-K→ "Pair a device (QR)"): the QR code that pairs the iOS app with the server, drawn in the terminal.ccopies the pairing JSON. See pairing from the terminal. - The wallboard (
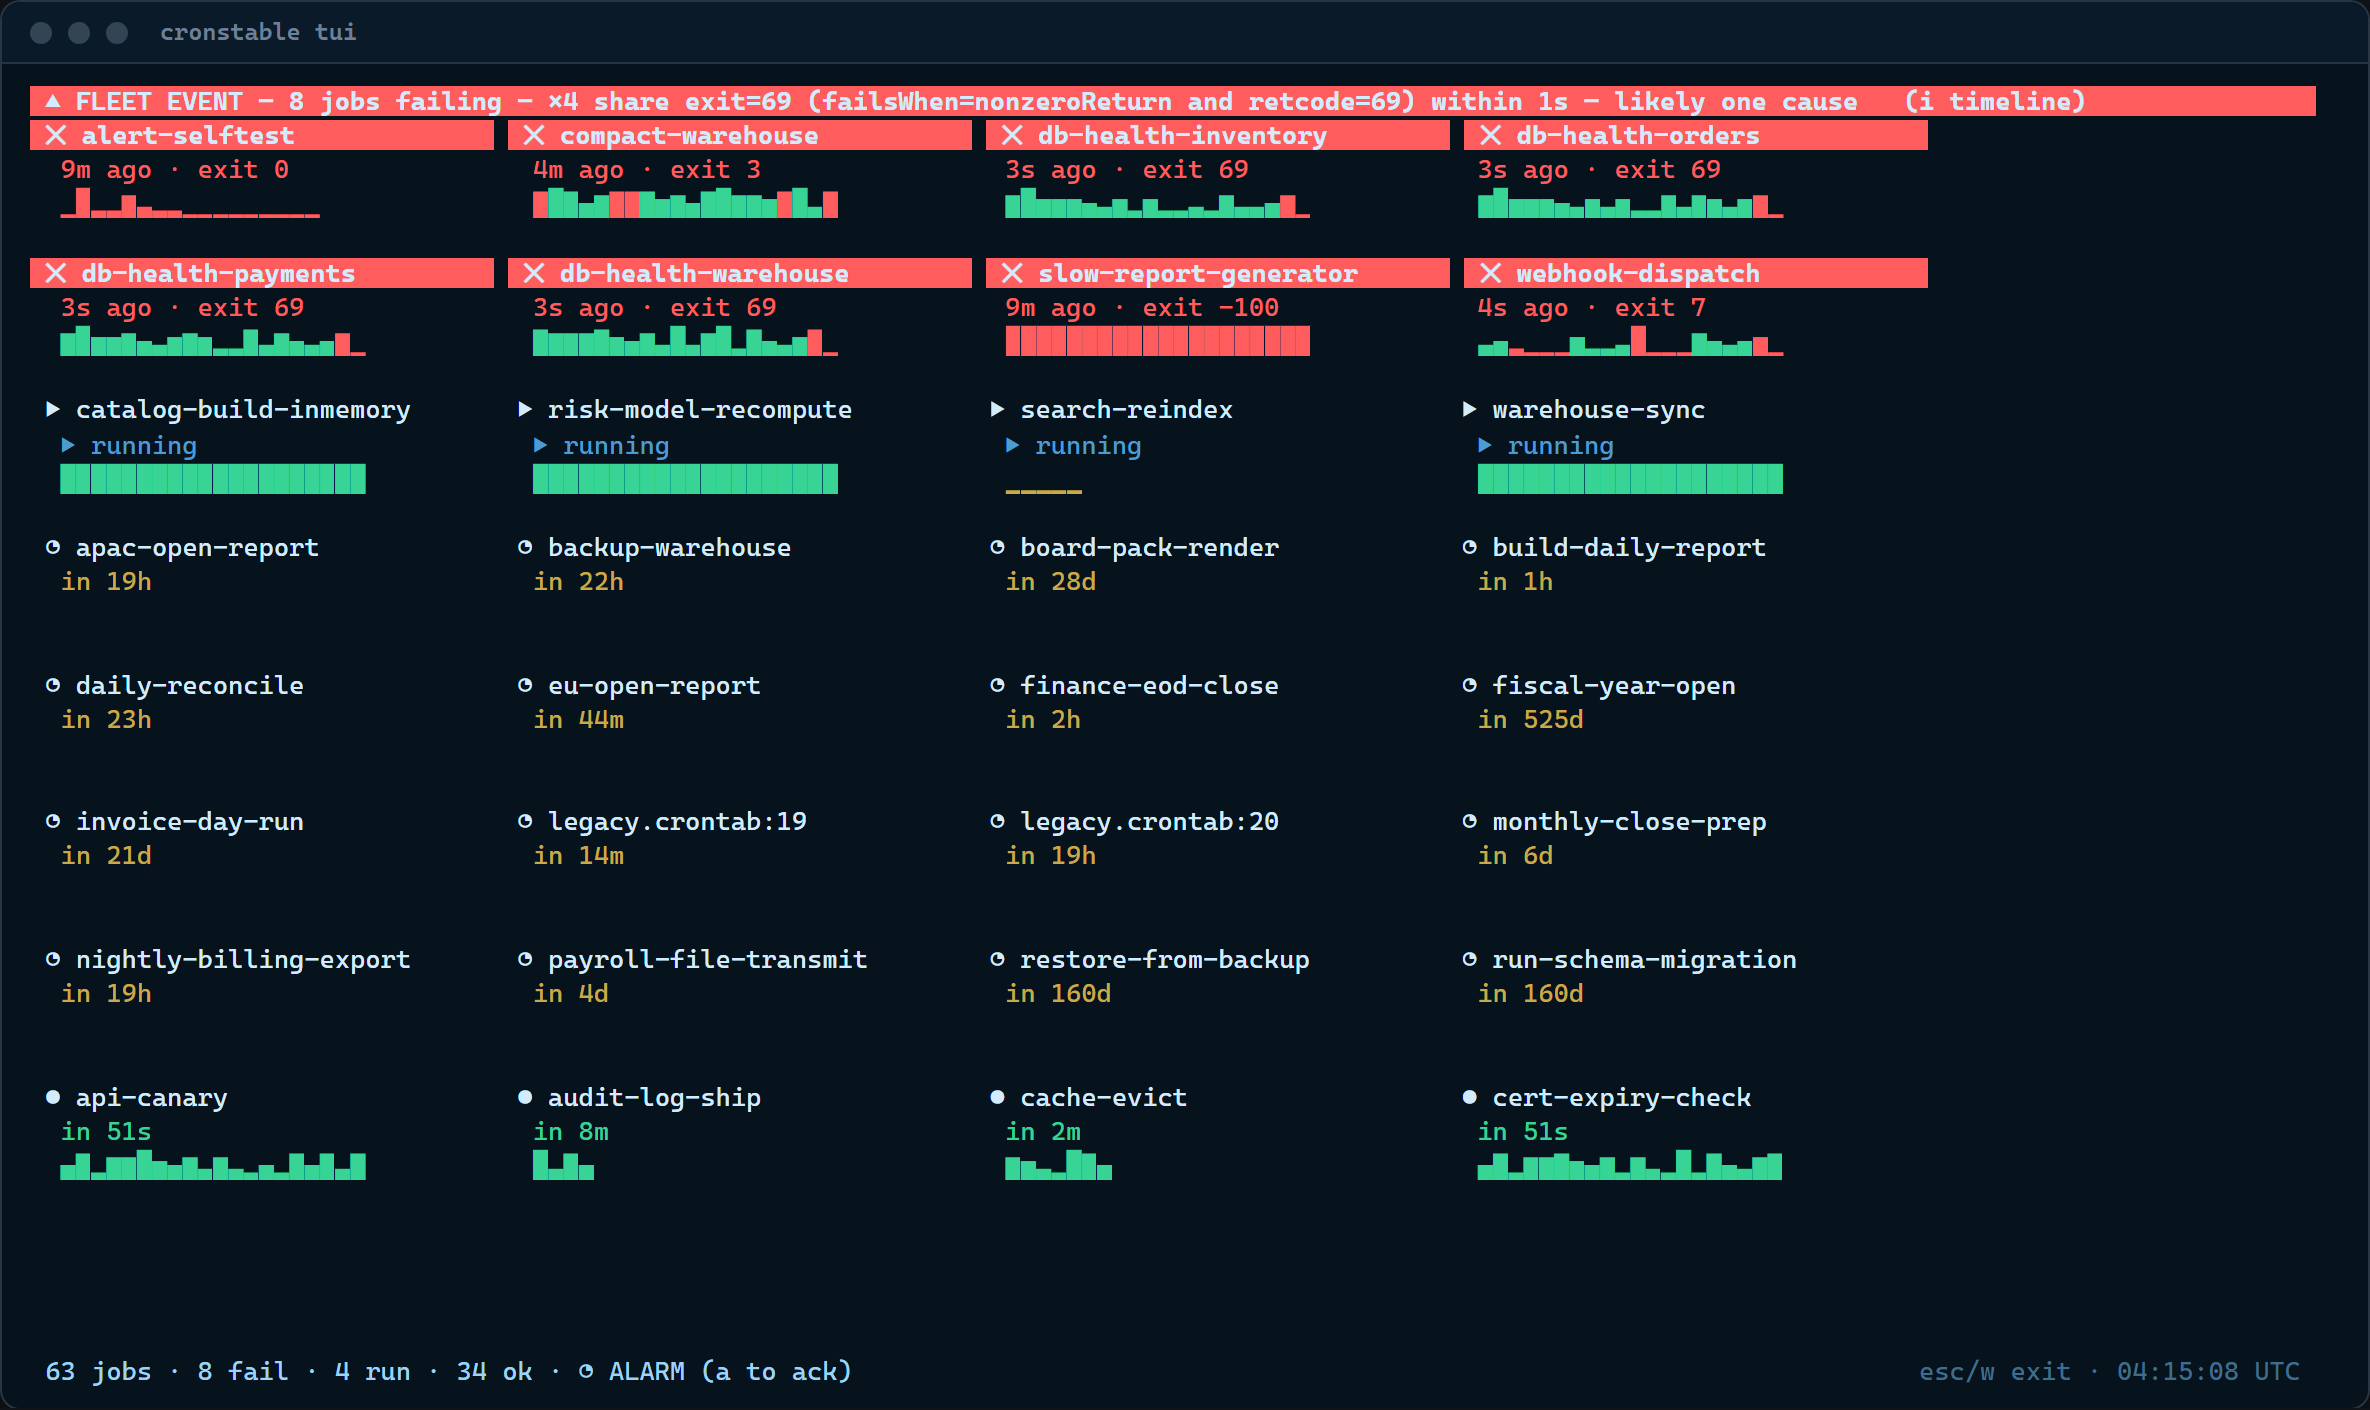
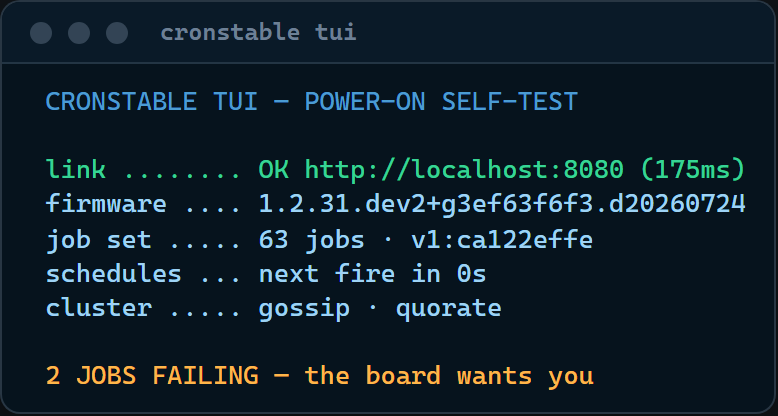
w) with worst-first tiles, the tally foot, aNO SIGNALbanner when data goes stale, and the zen screensaver on an idle board (nothing failing or running, data fresh). A panel, a drawer, or the token prompt that is open over the wallboard takes the keys.Esccloses it, and thenEscorwleaves the wallboard. - The BIOS-style boot self-test, checking the daemon once
per 12 hours. Skip it with any key,
--no-boot, or a settings toggle.
Text is sanitized before display. For log lines, only the last nonempty
\r segment is kept, so progress bars and cmd.exe's CRLF output display
correctly. Tabs expand, and other control characters are dropped. A
character that the terminal's encoding cannot encode is painted as ?.
Every escape sequence except SGR styling is scrubbed from job output and from API-derived strings such as job and node names, which under clustering arrive from other machines over gossip. Untrusted output can color a line, but it can never move the cursor, retitle your window, or write your clipboard with OSC 52.
Some features stay web-only: desktop notifications (the TUI rings the terminal bell instead, off by default), the run ledger, and the pendulum wordmark.
The drawer's Resources tab lists a monitored job's recent runs and its live reading, and the resource limits of a capped job:
- A job with
resourceLimitsgets a caps line at the top, such ascaps 1.5 CPU · 512 MiB · 64 procs (required). CPU is a number of CPUs, memory is in binary units like the daemon's (512 MiB,1.5 GiB), and processes readN procs(1 proc).(required)follows whenresourceLimits.requiredis set, and a cap set tomaxis left out. - The live line,
live: <cpu%> cpu · <rss> rss, comes from the newest running instance. - A run's limits go in a limits column after peak rss when they fit
there whole. Limits that do not fit go on an indented row under the run,
where they get 20 more columns. A run with no usage record shows
—in the cpu column. - A job without
monitorResourcesshowsthis job has no resource monitoringand(set monitorResources: true on the job). A capped job adds a started / limits table of its recent runs below them. -
j/kscroll the run list one run at a time andPgUp/PgDnten runs at a time. A run's indented limits row moves with its run, and the scroll stops once the oldest run shows. The table of a capped job without monitoring scrolls the same way.
A run's limits cell lists, in this order:
| Text | Meaning |
|---|---|
memory cap |
The run hit its memory cap and was killed. |
caps off |
A cap was not enforced, refused runs included. |
kernel peak <size> |
peak_memory_bytes: cgroup memory.peak on Linux, the job's peak commit charge on Windows. It is not RSS. |
throttled <duration> |
Linux: the time the CPU cap held the run back, shown when above zero. |
N process cap hit(s) |
How often the process cap refused a new process, shown when above zero. |
| the reason | Why the caps were off. |
A record with none of these reads caps on, and a list cut to fit ends in
…. The History tab shows a run's first marker in place of its
duration bar, in the failure color for memory cap and the warning color
for caps off. A second marker goes after exit N and before the fail
reason, as in this row detail:
memory cap exit -9 · caps off · memory limit exceeded (512 MiB).
A run whose verify check the memory cap killed gets check memory cap, in
the failure color. It goes second after the run's own first marker, or
first when the run has none, as in
check memory cap exit 0 · verification failed: memory limit exceeded (96 MiB).
When a History list has a marker longer than the duration bar, the marker
slot widens on every row of that list. The Resources tab's limits cells
show only the run's own record.
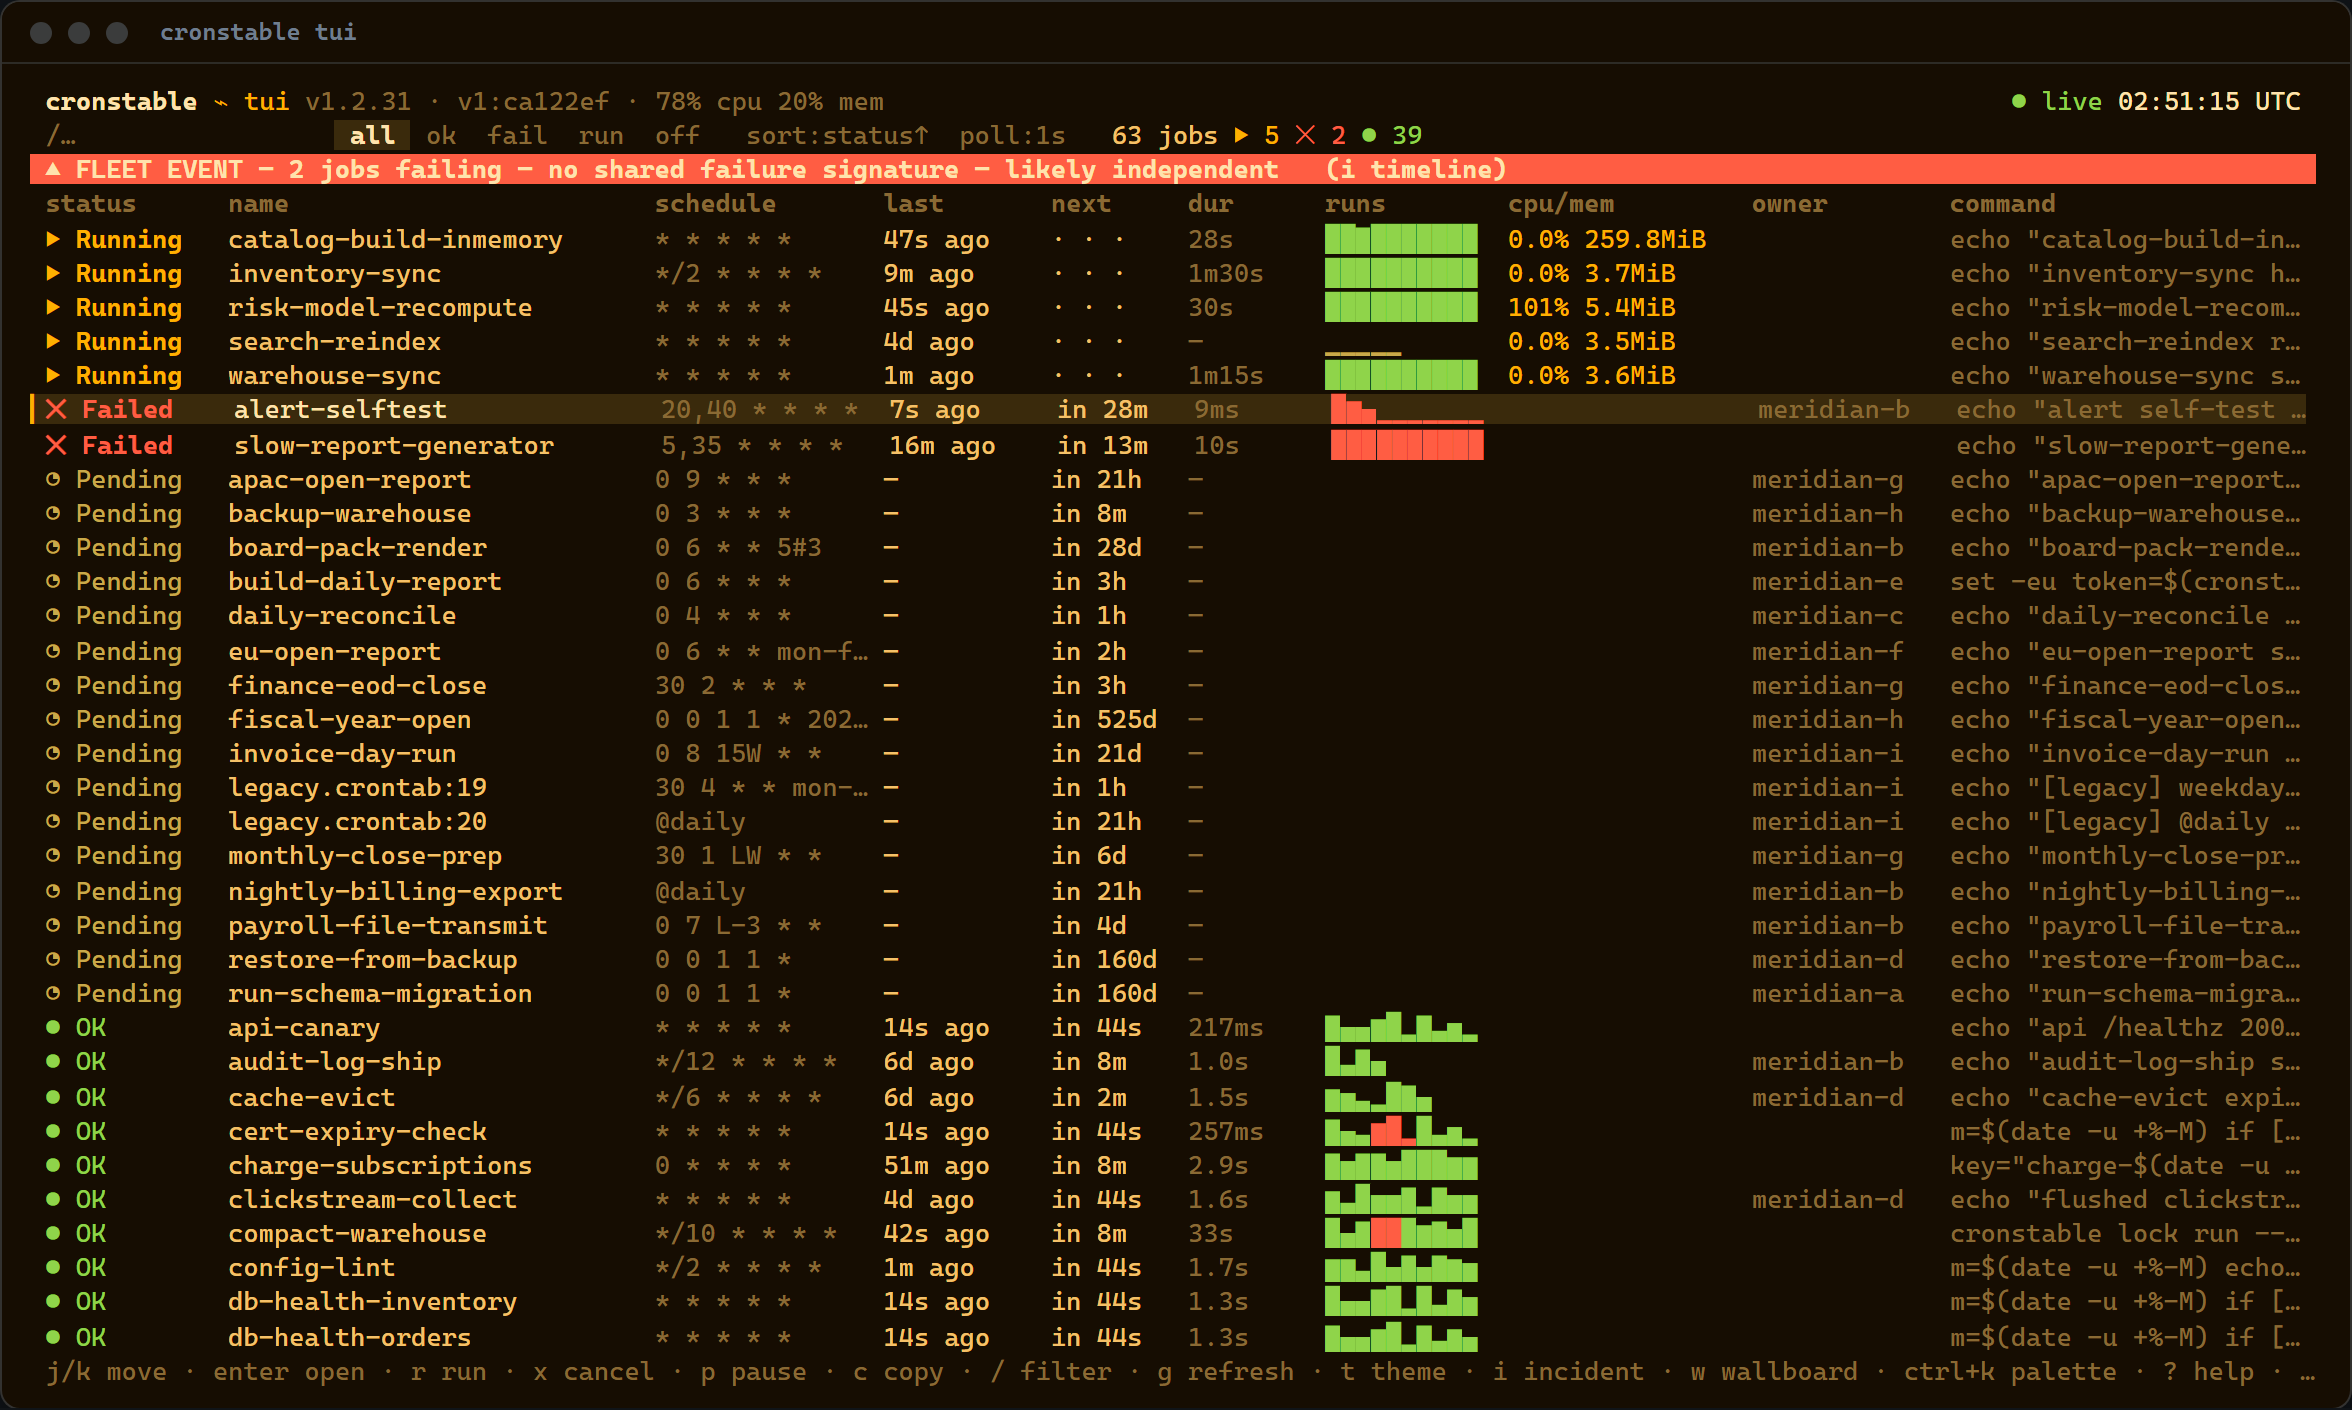
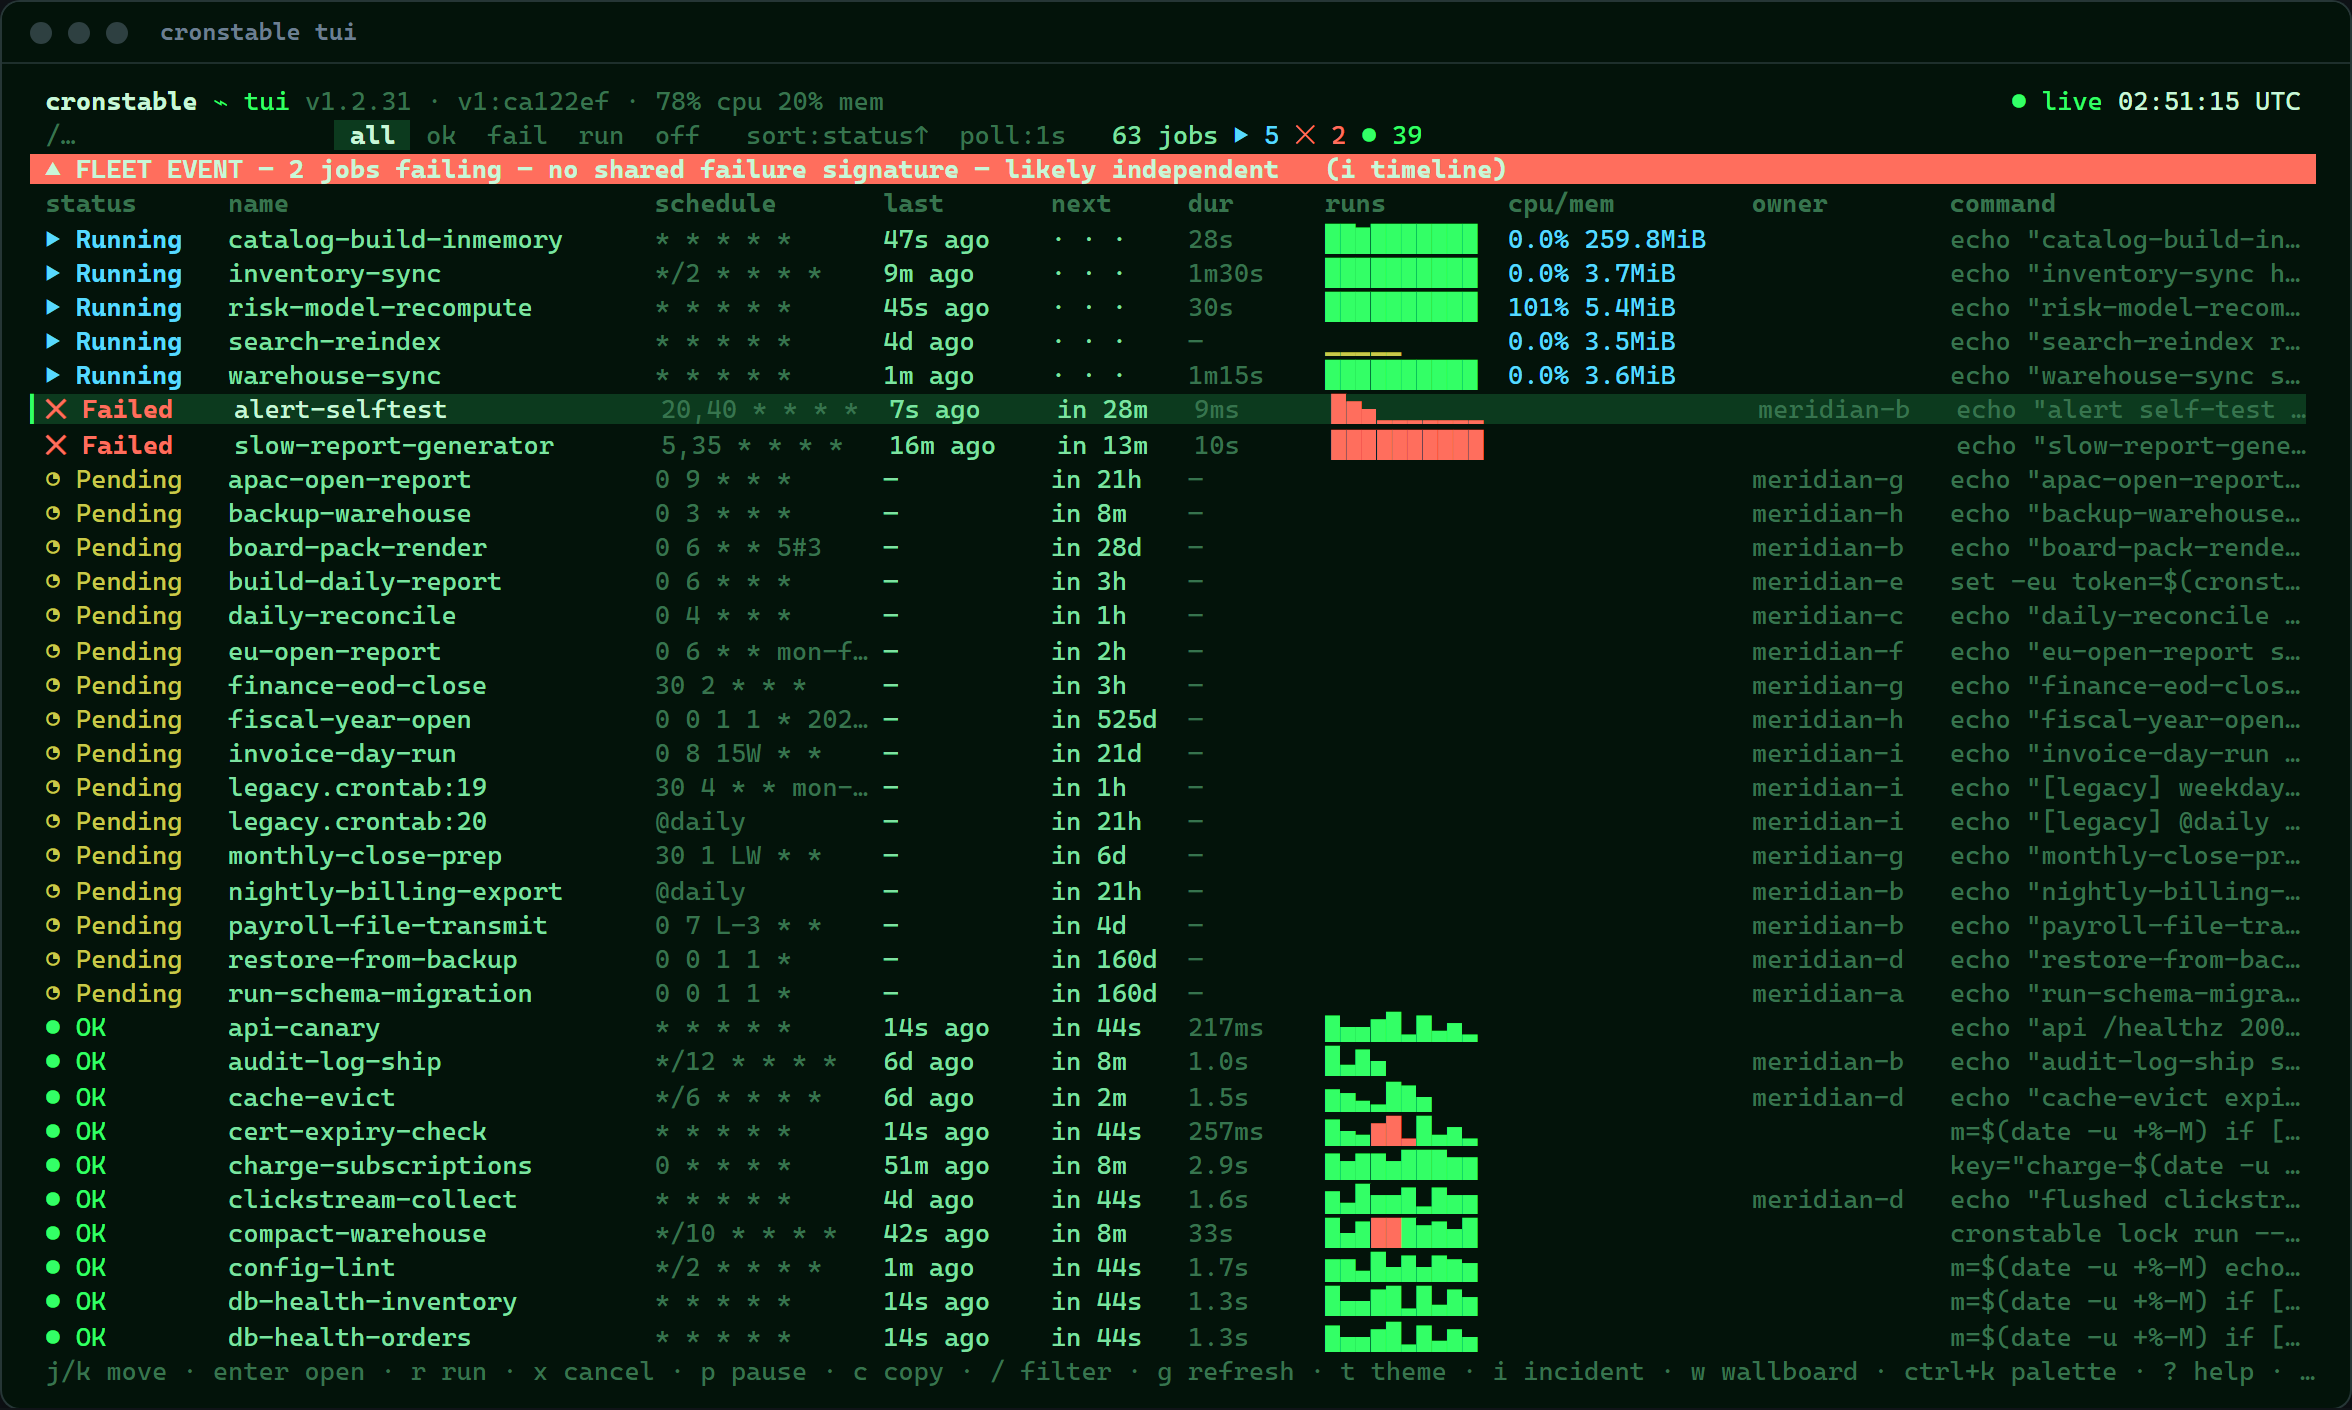
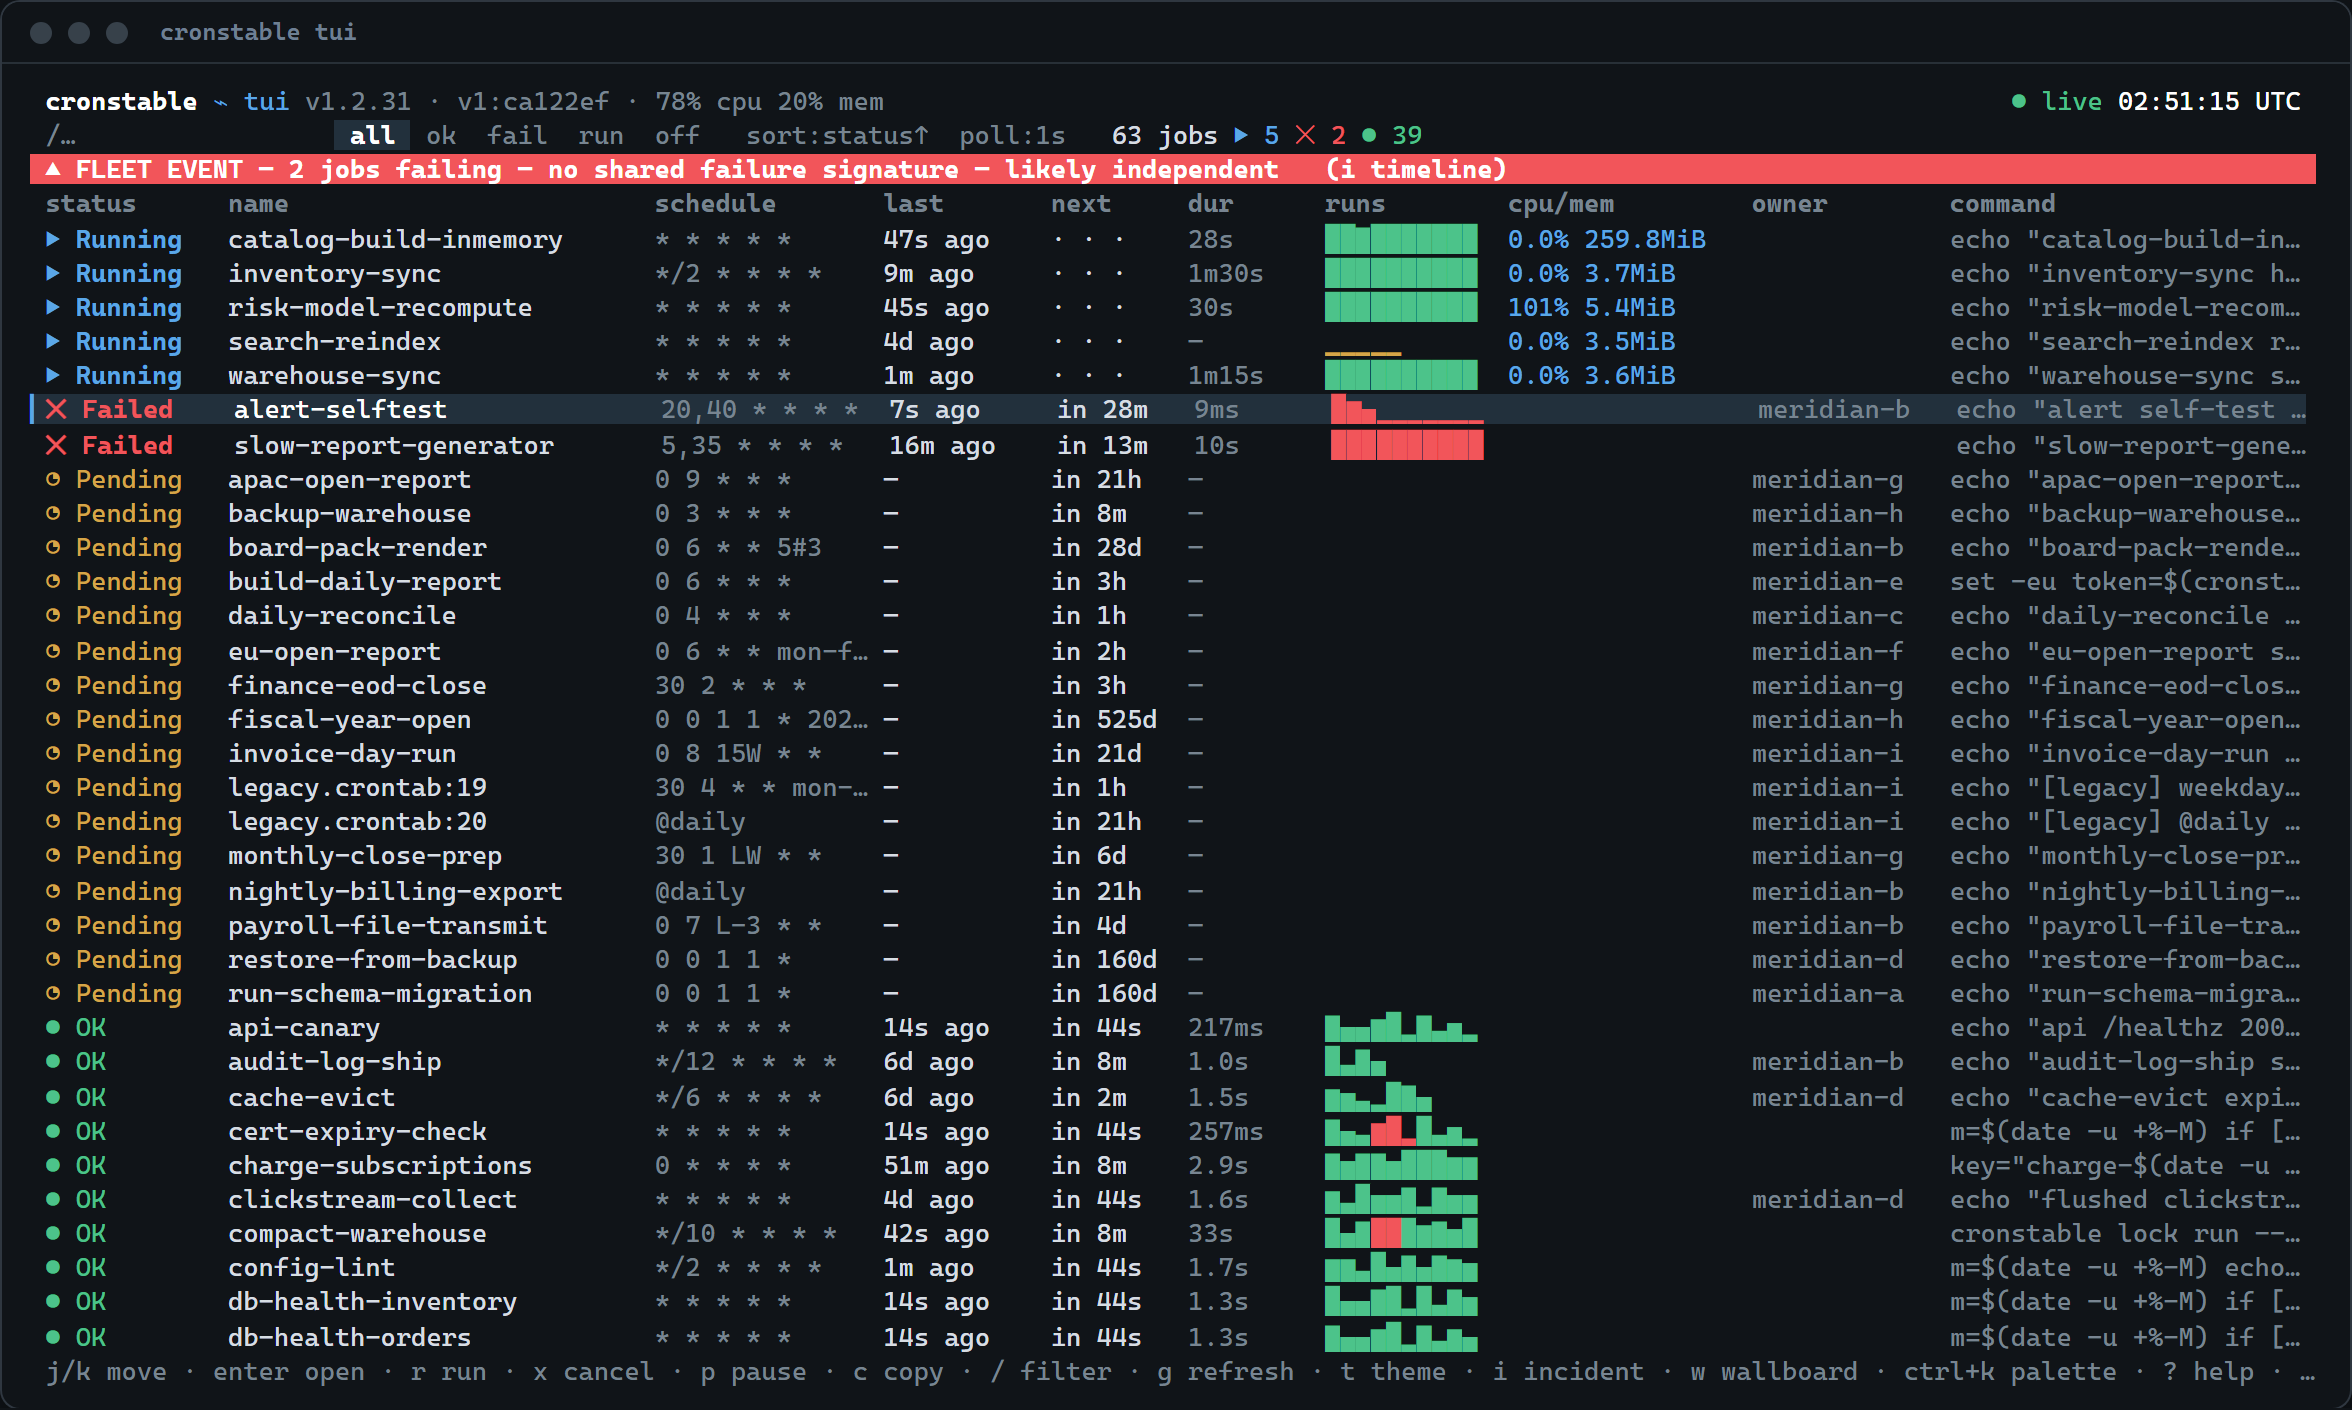
The same five hues as the web page: standard (default, flat
neutral), carolina, amber, green, and flat modern.
Each has a dark and a light (paper) variant. t cycles hues and T
flips the variant, exactly as in the browser.
The color-vision settings offer red-green and blue-yellow palettes.
Statuses also use distinct shapes, and --ascii replaces the glyphs
with plain ASCII.
Preferences (theme, refresh, toggles) persist in a small JSON file, the
TUI's analogue of the page's localStorage:
%APPDATA%\cronstable\tui.json on Windows,
$XDG_CONFIG_HOME/cronstable/tui.json (or ~/.config/...) elsewhere.
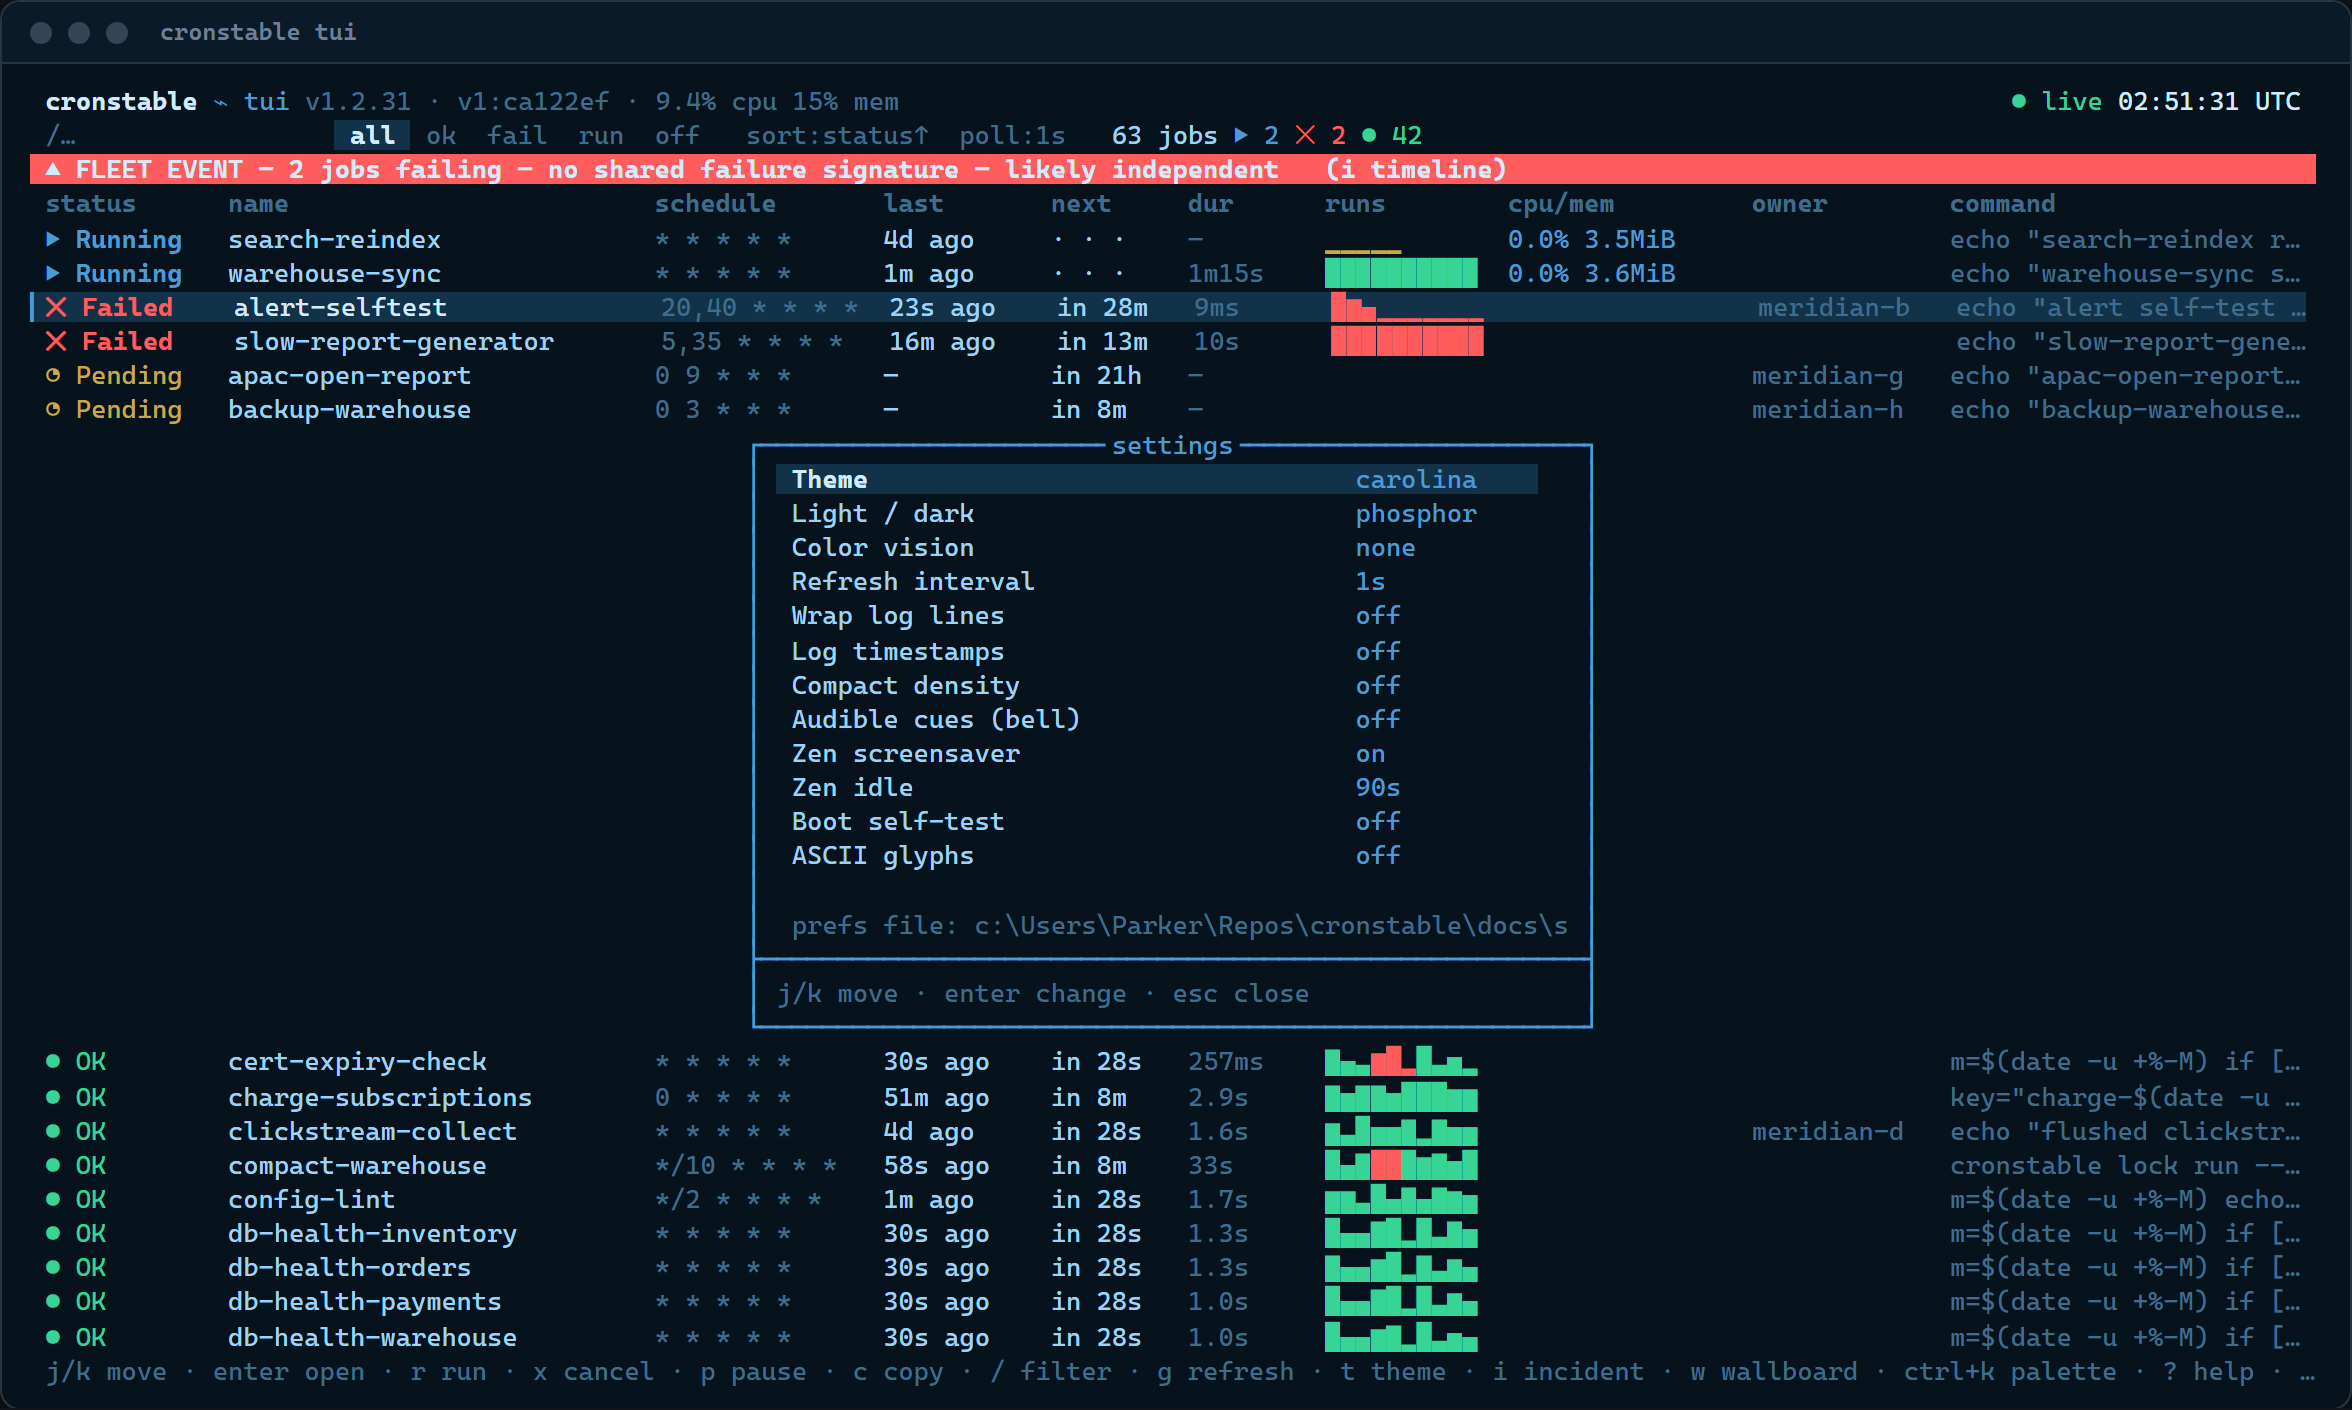
Open the settings panel from the command palette (Ctrl-K → "Open
settings"); it has no dedicated key. j/k (or the arrow keys) select
a row. Enter, Space, ← or → cycle or toggle the selected value.
Every change saves immediately to the preferences file, whose path the panel's
footer shows.
The panel has thirteen rows. Theme, Light / dark, Color
vision, and ASCII glyphs are the
themes and accessibility settings described
earlier. Refresh interval is the --poll cadence, 1s–10s or paused.
Wrap log lines and Log timestamps are the Logs tab's w/t
toggles. Audible cues (bell) is off by default. Startup checks
turns the boot self-test on or off (also in the palette as "Toggle
startup checks"). Compact density drops the schedule and sparkline
columns from the jobs board so the rest fits a narrower terminal (also
in the palette as "Toggle compact density"). Three rows live only here:
- Zen screensaver and Zen idle govern the wallboard's screensaver. On an idle board (nothing failing or running, data fresh), it engages after the keyboard has been idle for the Zen idle interval: 30, 60, 90, 120, or 300 seconds, default 90. Any key wakes it without acting. It stays off while a panel, a drawer, or the token prompt is open over the board. A token prompt that opens during the screensaver ends the screensaver within a second.
- Living logo animates the logo mark. With it off, the mark holds still.
The copy actions are c on a job; the palette's "Copy version",
"Copy job-set ID", "Copy fleet badge Markdown", and per-job
"Copy badge Markdown" (see status badges); and the
incident writeup. Each takes two paths at
once: an OSC 52 escape asking the terminal emulator itself to set the
system clipboard, plus the platform's copy tool (clip.exe on Windows,
pbcopy on macOS, wl-copy or xclip on Linux, whichever is
installed).
Over SSH the platform tool runs on the remote machine, so OSC 52 is the
only path to your local clipboard. It needs an emulator that supports
OSC 52; most modern ones do, and tmux passes it through only when its
set-clipboard option allows.
The TUI reports success without being able to verify OSC 52 delivery. If the clipboard is empty in a remote session, check the emulator's OSC 52 support. Incident writeups are also saved to a file.
Except on Windows, the TUI asks the terminal to mark each paste
(bracketed paste) while it holds the screen. It turns the mode off when
it quits, including on Ctrl-C and after an error. Marked text is text
only. The text field with the focus takes it, and line breaks and other
control characters are dropped, so a pasted line break commits nothing
and the field keeps its focus. With no field focused, an open command
palette, schedule preview, or token prompt takes the text. Anywhere
else the paste does nothing, and no pasted character acts as a
shortcut.
A terminal that ignores the request sends a paste as typed keys. A TUI
process that is killed with SIGTERM exits without restoring the
terminal, so bracketed paste stays on with raw mode and the alternate
screen.
When a terminal starts a marked paste and its end marker never arrives,
the TUI takes every later key as pasted text, so q, Esc, and
Enter do nothing. Ctrl-C pressed after a pause of 30 ms or more
ends the paste and quits the TUI. A pasted Ctrl-C character that
follows such a pause quits the TUI too.
The Windows console marks no paste, so a pasted line break, tab, or
escape arrives as Enter, Tab, or Esc. When a key takes the focus
out of a text field and more keys reached the TUI together with it, the
TUI drops those keys as the rest of a paste. Enter, Tab in the
filter, and Esc take the focus out of a field. A key that leaves the
field focused drops nothing: after Tab in the command palette, or
Enter there with no match, the keys behind it are typed into the
field. Keys that arrive on their own act as typed. When the console
delivers a paste in more than one piece, the TUI drops only the rest of
the piece that holds the key that left the field, and the later pieces
act as typed keys. A paste with no text field focused acts as typed
keys too. While the TUI is busy, a key typed right after a key that
leaves a field can reach the TUI together with it and is then dropped.
With web.authToken enabled, pass the token
with --token, or export it and let the default --token-env CRONSTABLE_WEB_TOKEN pick it up. Exactly like the page, an
unauthenticated start is fine: the first 401 opens the token prompt,
and the token is kept for the session only, never written to the prefs
file.
When the token prompt opens while the command palette is open, the terminal dashboard closes the palette, and the prompt takes the keys.
On the wallboard, the prompt opens over the board, and the board stays
on screen after you save the token. When you start with --job and no
token, the prompt comes first, and the job's drawer appears when the
prompt closes. Saving the token loads the job's log in the drawer's
Logs tab.
Mutating keys (r, x, DAG trigger/backfill/decision) go through the
same POST endpoints. The daemon's cross-site Origin gate does not
apply to a native client, so no extra configuration is needed.
The endpoints and cadence model match the web page's: GET /jobs on
the refresh interval (1s–10s or paused, default 3s), with /cluster
and /node riding each successful poll. /fleet, /state,
and the heatmap's one-request /activity batch are polled only while
their panels are open, with the per-job /jobs/{name}/runs fan-out kept
as the fallback against a daemon without that batch. The heatmap
request is GET /activity?jobs=80&sort=name: the 80 jobs the panel
draws, first by name.
GET /jobs/{name}/logs is an SSE stream while a Logs tab or
multi-tail pane is attached (replay-then-follow, with the page's same
reconnect throttle).
| Live log tail | Run history | Schedule, explained |
|---|---|---|
 |
 |
 |
| Fuzzy command palette | Keyboard-first, with the web page's keys |
|---|---|
 |
 |
| The task graph, mid-flight | A human approval gate |
|---|---|
 |
 |
| Cluster panel | Fleet view |
|---|---|
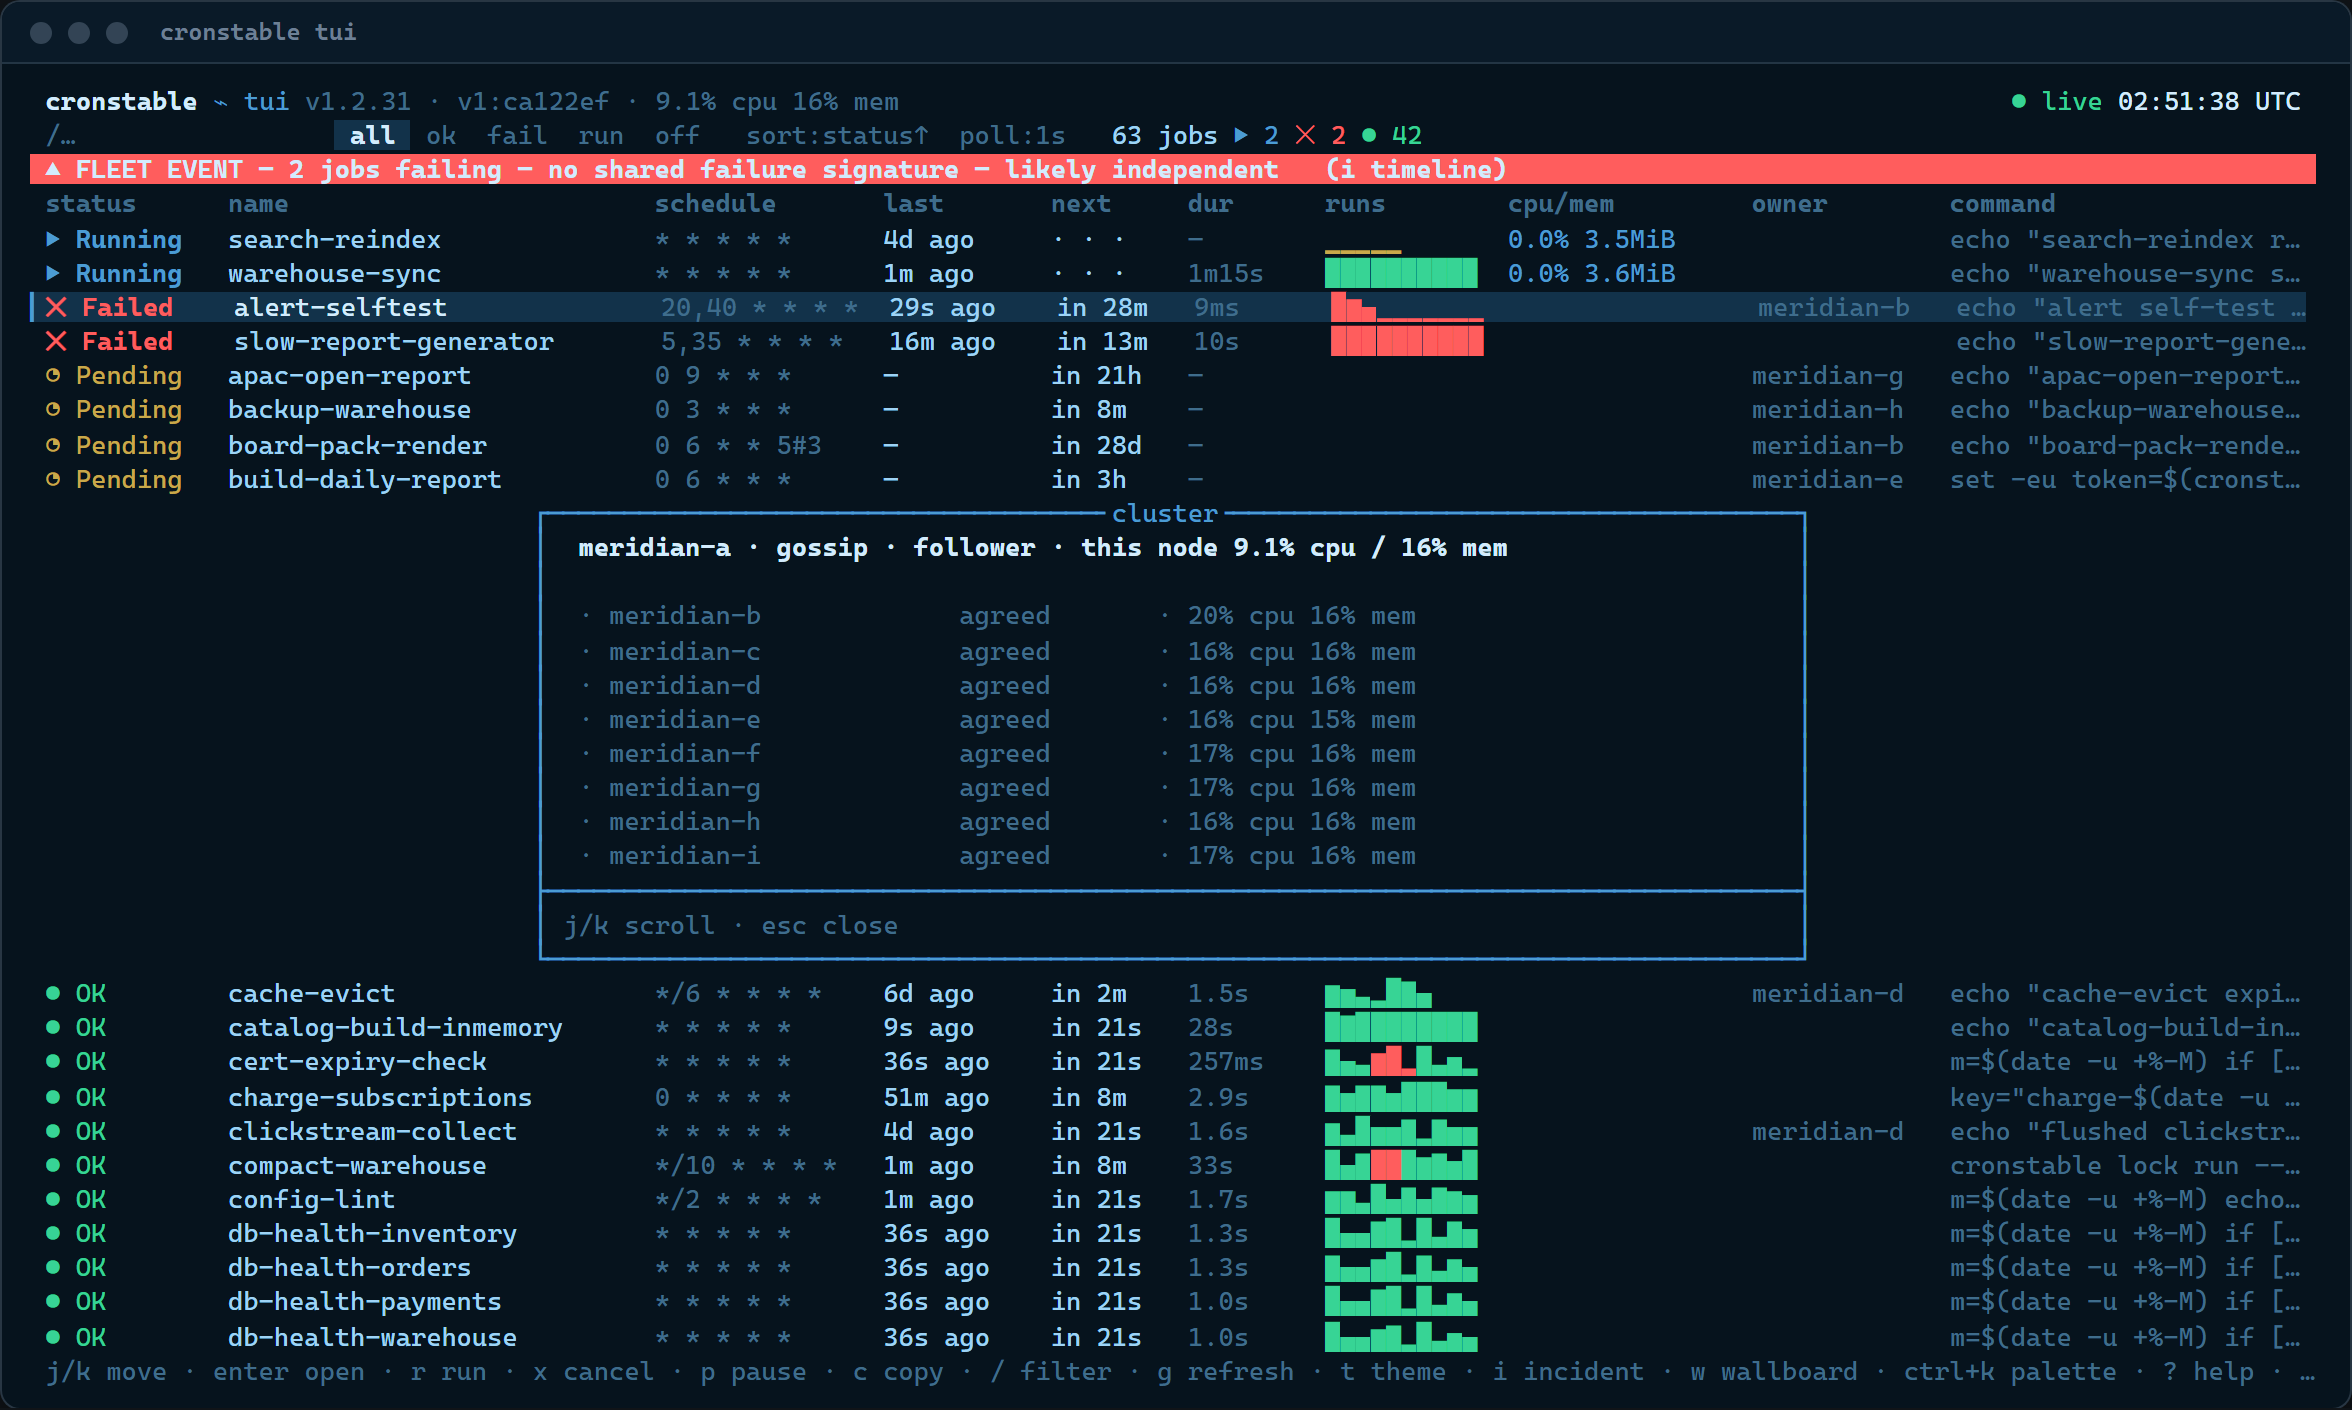 |
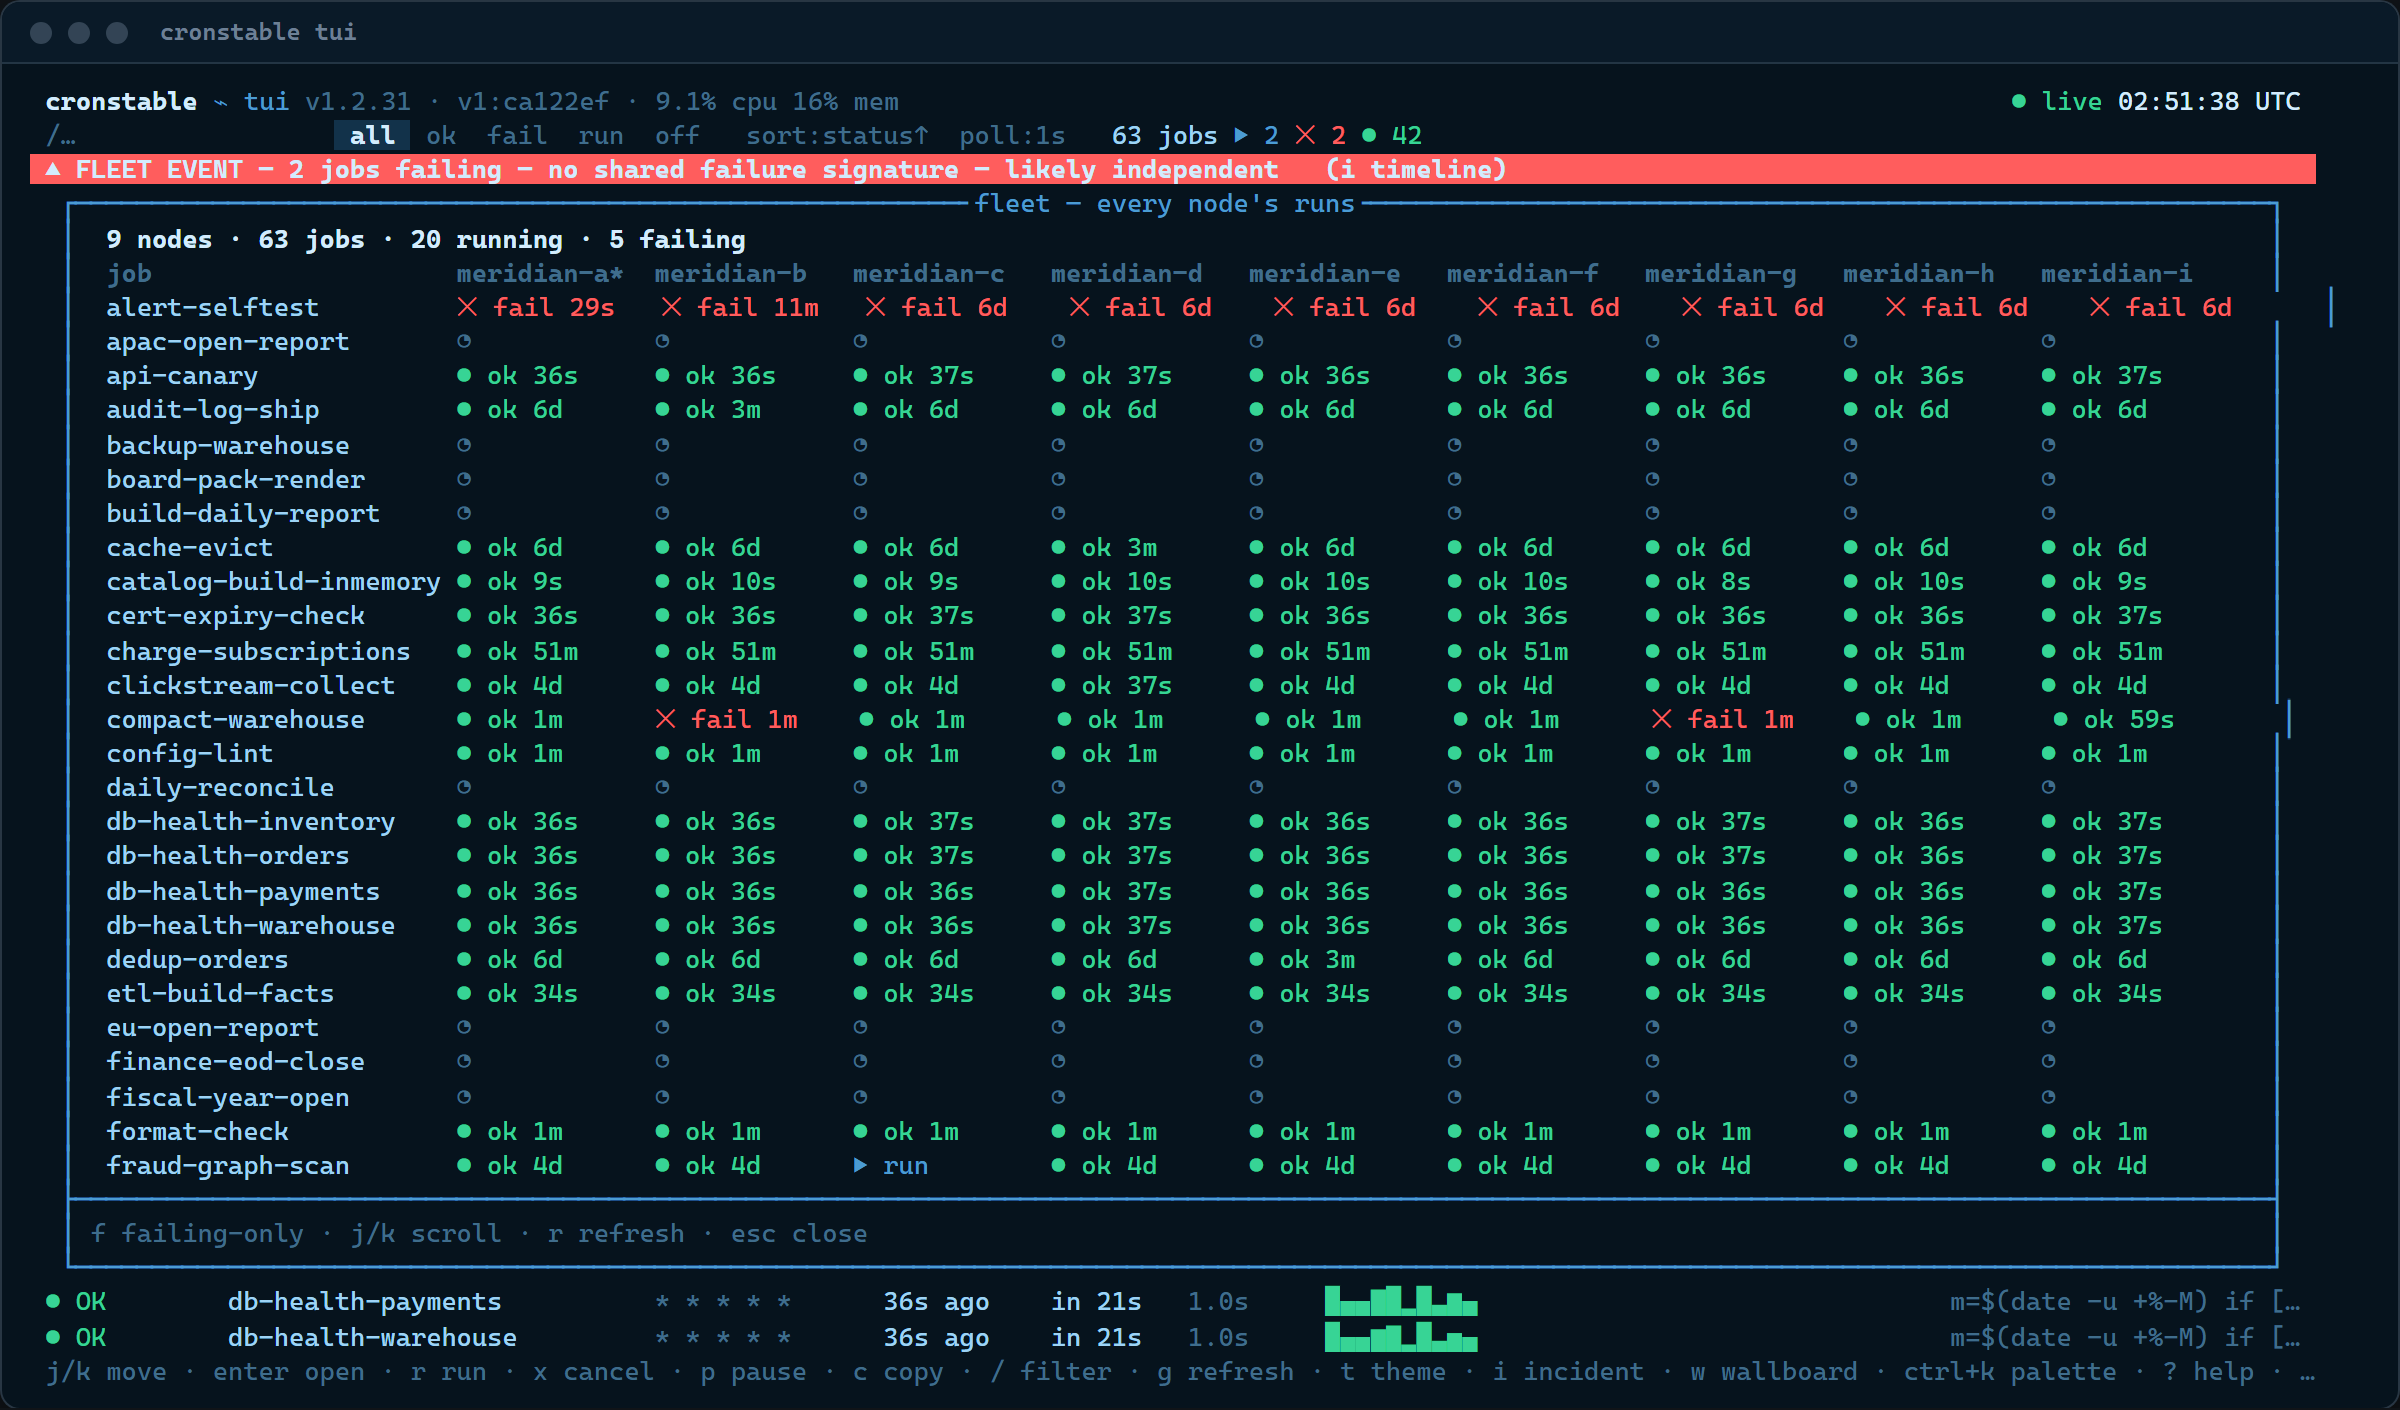 |
| Incident timeline | Merged multi-tail |
|---|---|
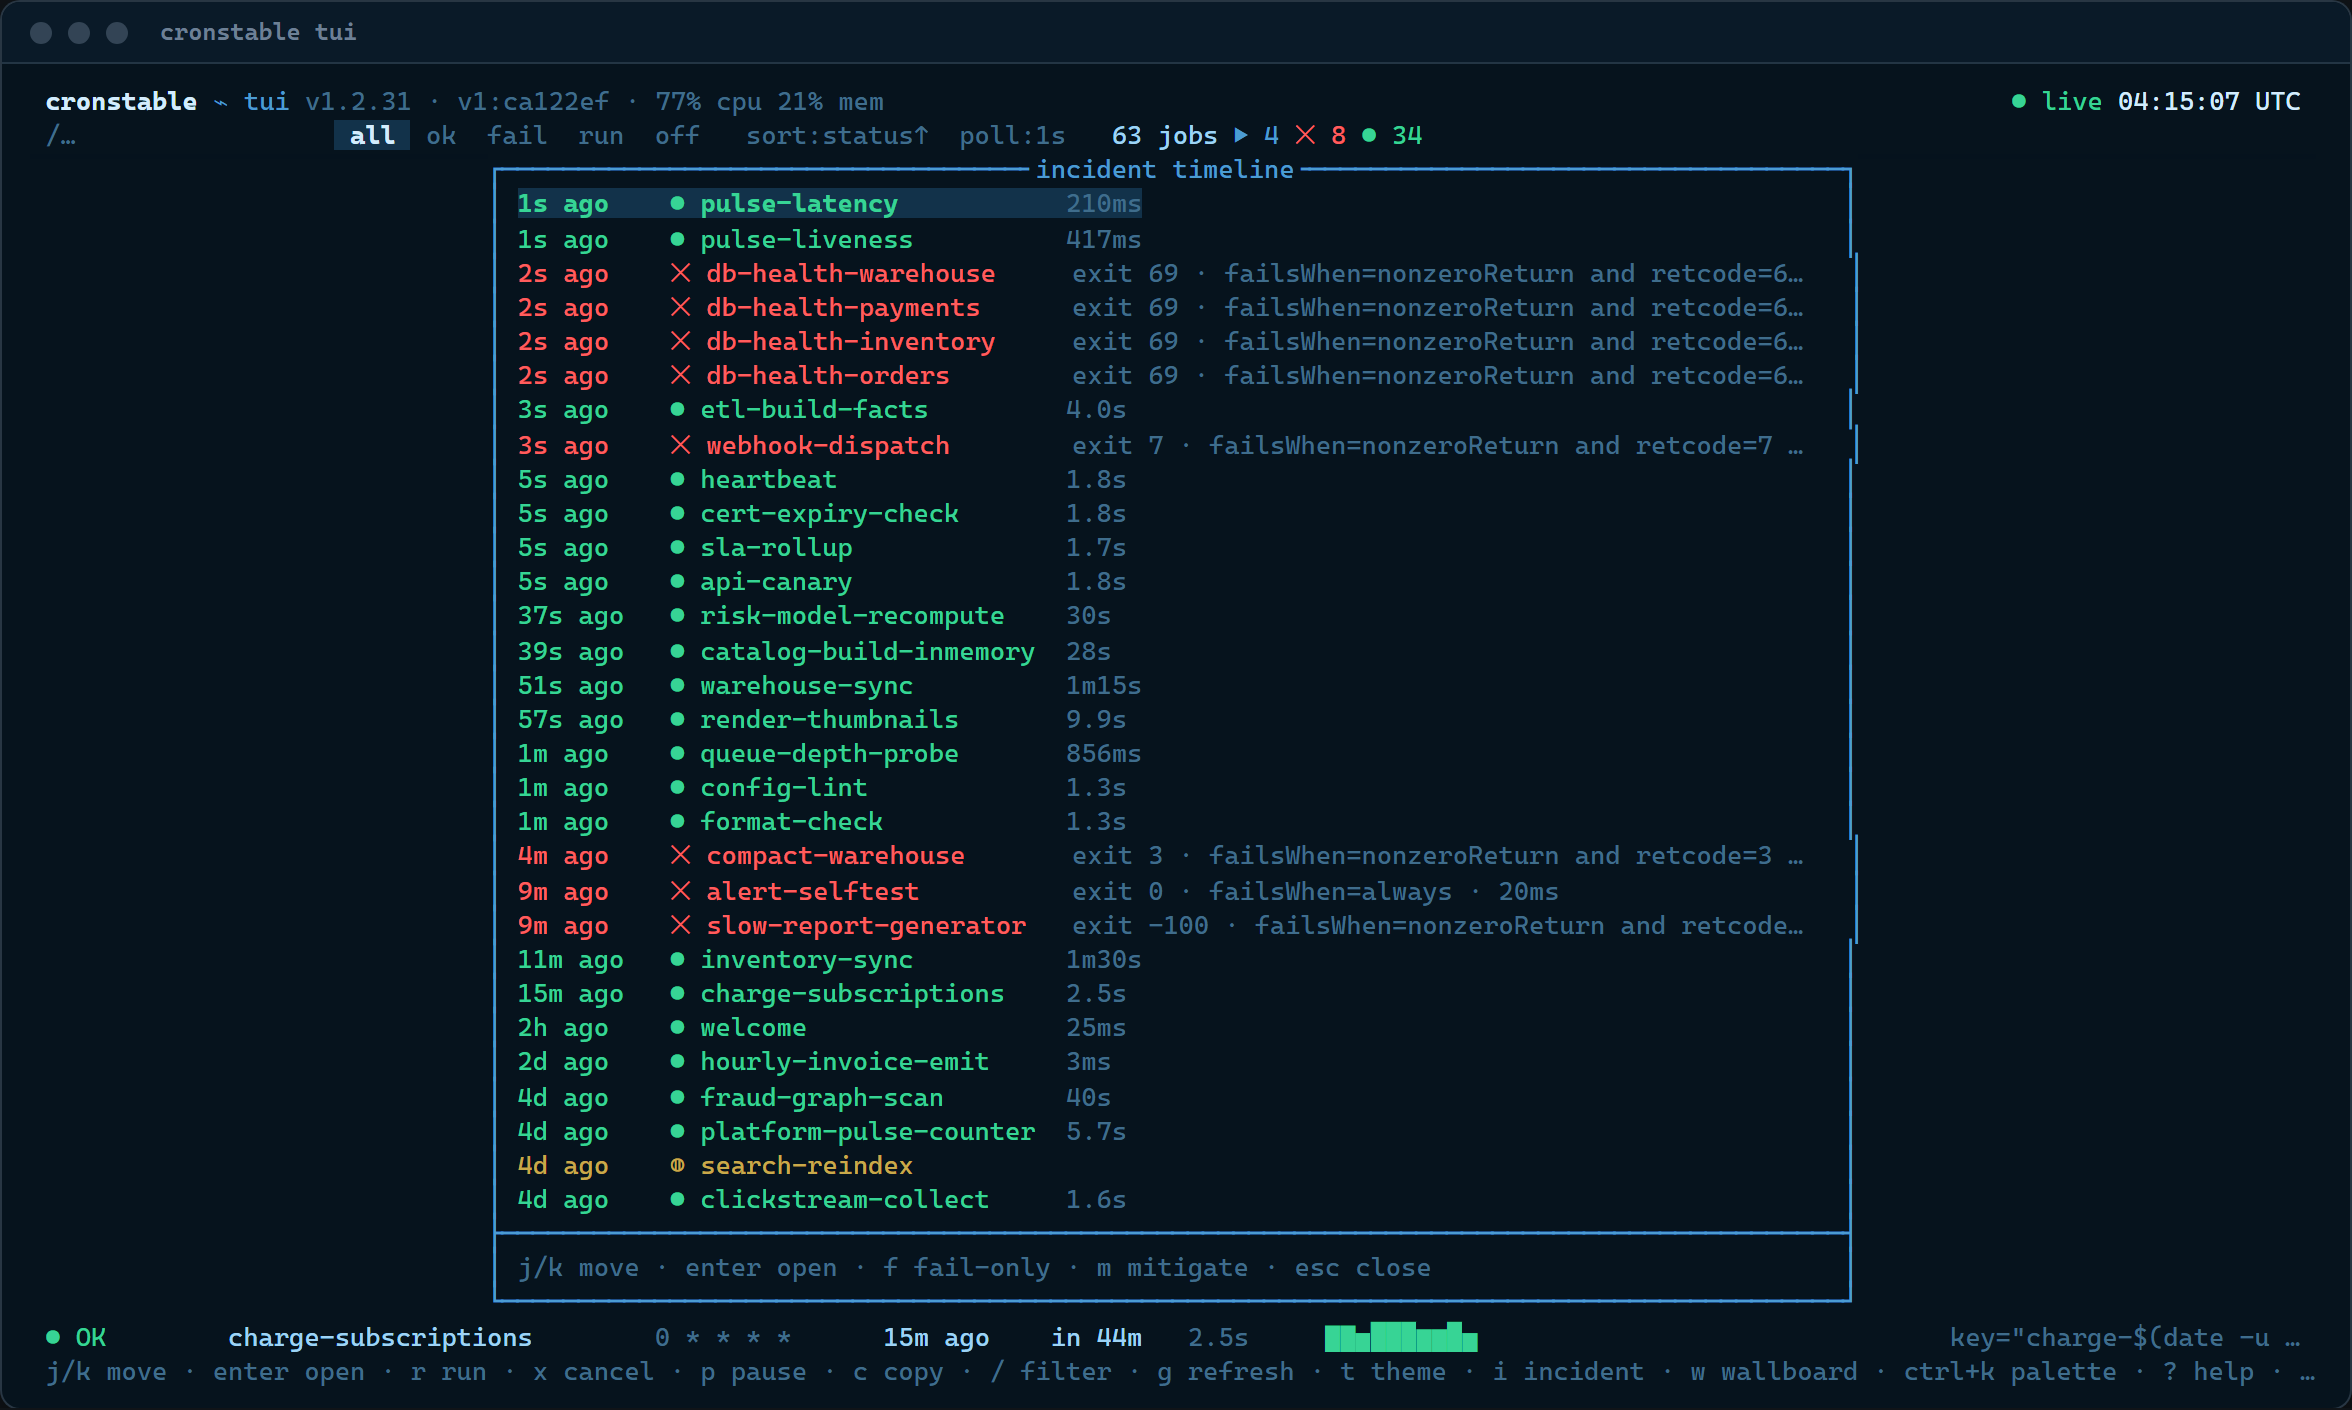 |
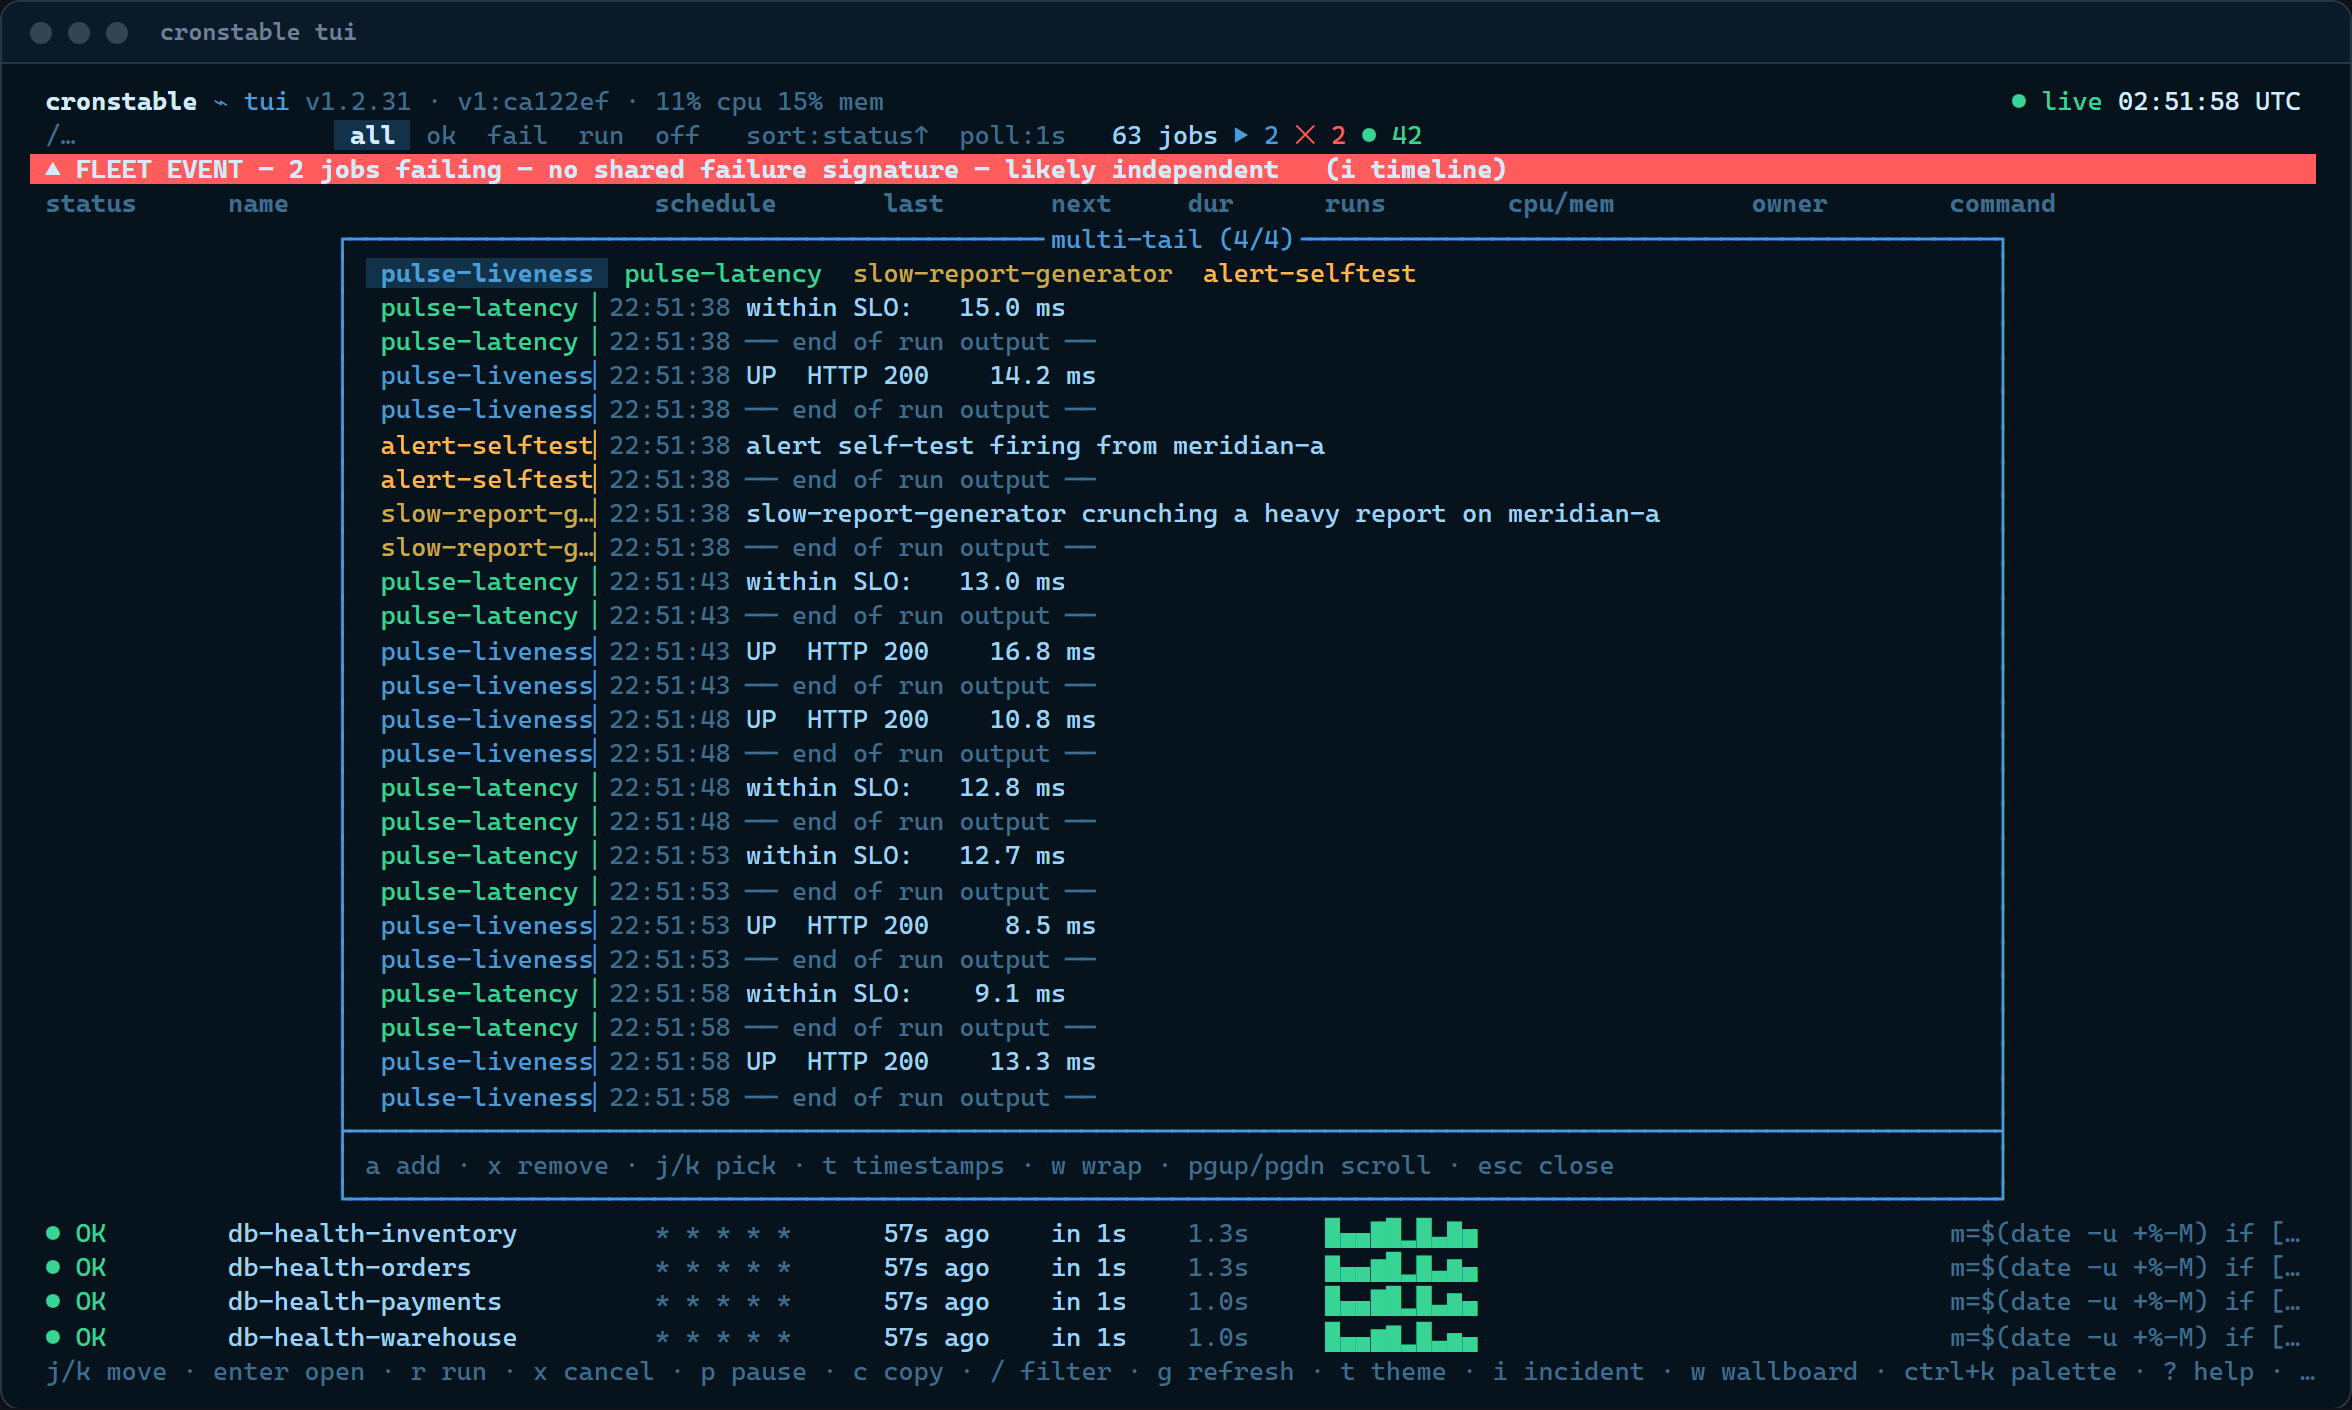 |
| Wallboard / TV mode | Activity heatmap | Durable-state inspector |
|---|---|---|
 |
 |
 |
| Carolina | Amber |
|---|---|
 |
 |
| Green | Flat modern |
|---|---|
 |
 |
| Standard, on paper (light) |
|---|
 |
| Startup self-test | Settings |
|---|---|
 |
 |
- Web Dashboard: browser features and screenshots.
- HTTP Control API: the endpoints and authentication both frontends are built on.
-
Pausing Jobs: the runtime pause behind the
⏸glyph and thepkey. -
Late-Run Detection: the
sla:monitor behind the OVERDUE suffix. -
Resource Limits: the
resourceLimitscaps behind the caps line and thememory capandcaps offmarkers. -
Pairing from the Terminal: the Pair a device panel
and the
cronstable paircommand. - MCP: access for AI agents.