Ompp UI Microdata Aggregate and Compare - openmpp/openmpp.github.io GitHub Wiki
Home > Aggregate and Compare Microdata
This topic shows functionality of the OpenM++ UI through annotated screenshots. The UI can also be explored by hovering over elements to display short descriptions. To find additional information about model run comparison please see: Compare model run results
Microdata UI has two views:
- source (raw) microdata view
- aggregation and run comparison microdata view
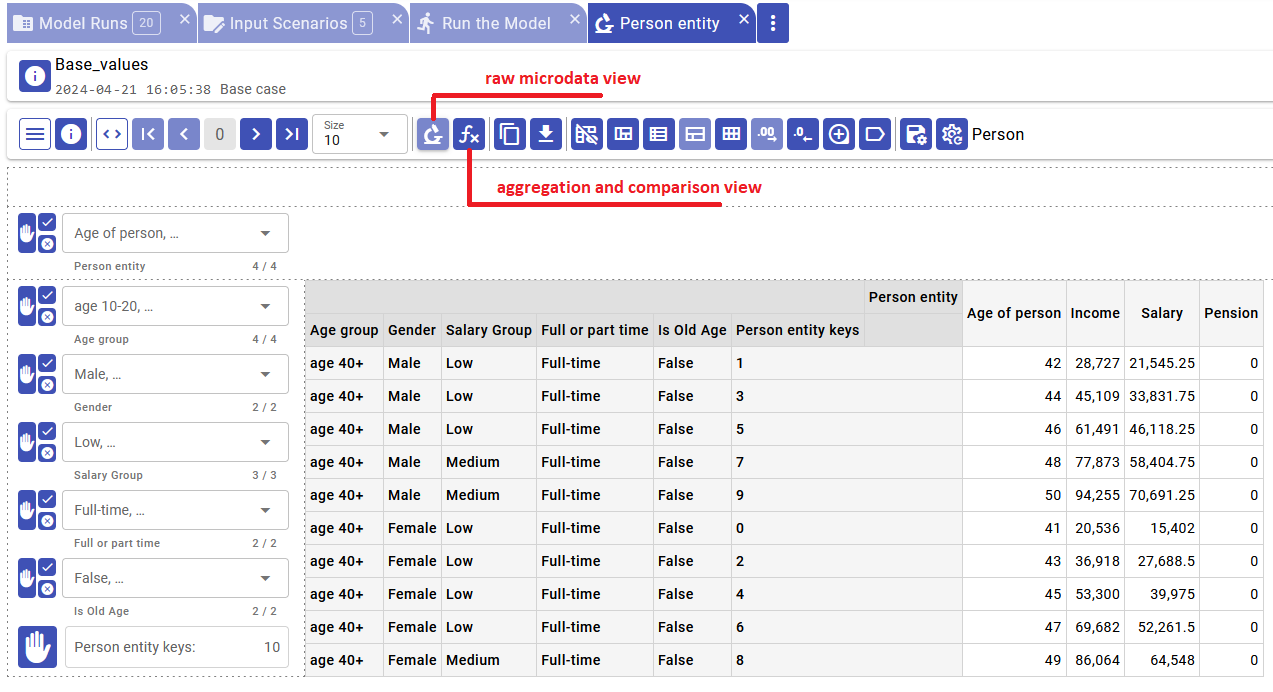
Aggregation and compare view allow you to aggregate source microdata attributes, group it by selected dimensions attributes and optionally compare microdata from Base model run to one or more Variant model runs.
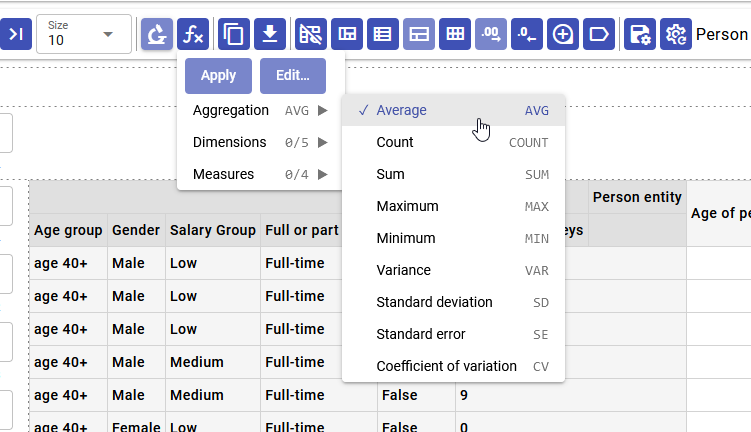
To aggregate microdata do following:
- click on
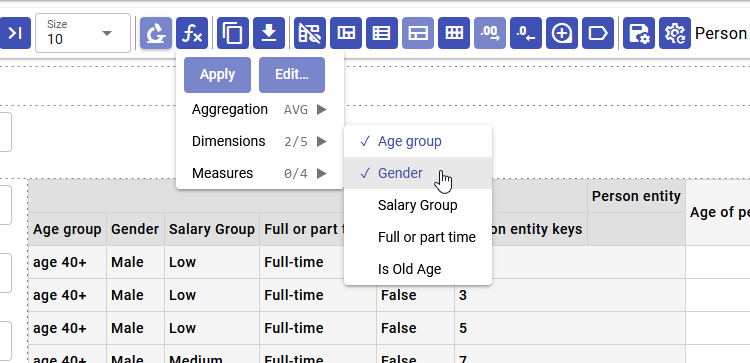
Aggregate microdatabutton to open the menu - select desired aggregation, on screenshots example below it is
Average - select one or more dimension attributes to group microdata, for example:
Age Group,Gender - select one or more measure attributes, for example:
Income - click on
Applybutton to se the results
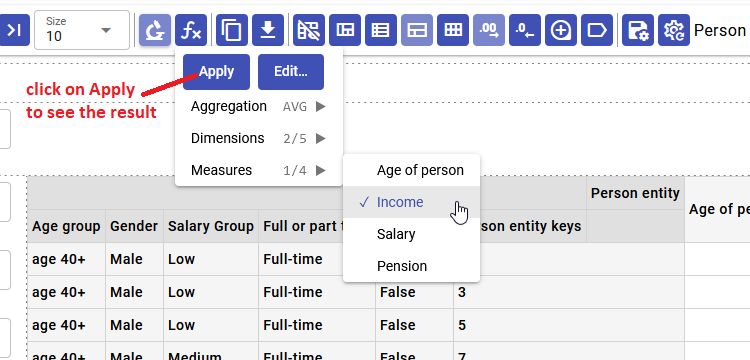
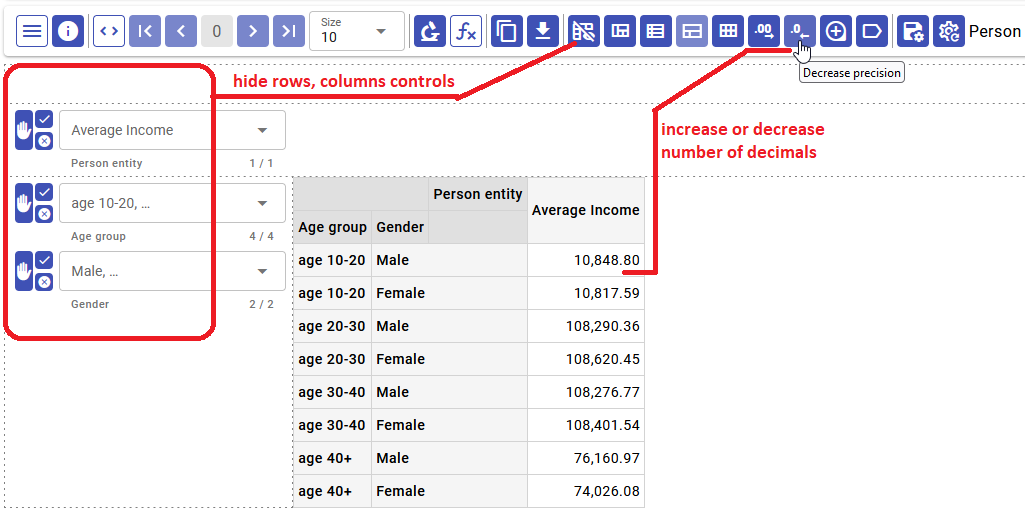
As result you will see an Average Income grouped by Age Group and Gender:
In order to compare microdata from Base run you need to select one or more Variant model runs to compare with and open your microdata. On screenshots below it is Person entity microdata:
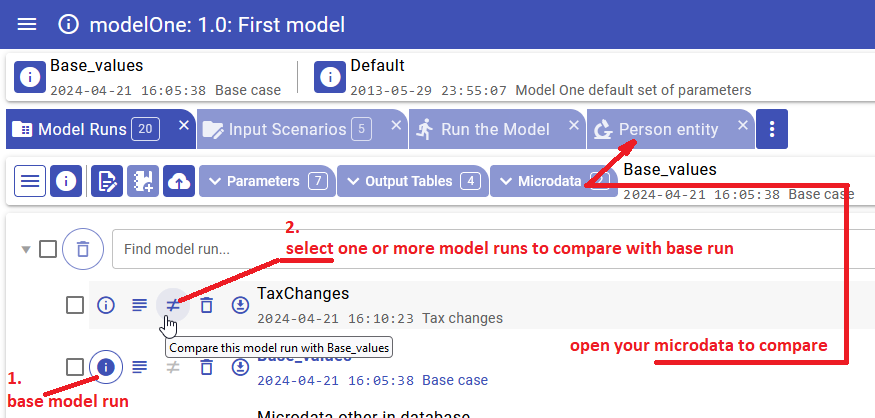
After that you will need to:
- click on
Aggregate microdatabutton to open the menu - select desired comparison, on screenshots example below it is
Percent, calculated as:
100 * (Variant Measure Value - Base Measure Value) / Base Measure Value
- select desired aggregation, for example:
Average - select one or more dimension attributes to group microdata, for example:
Age Group,Gender - select one or more measure attributes, for example:
Income - click on
Applybutton to see the results

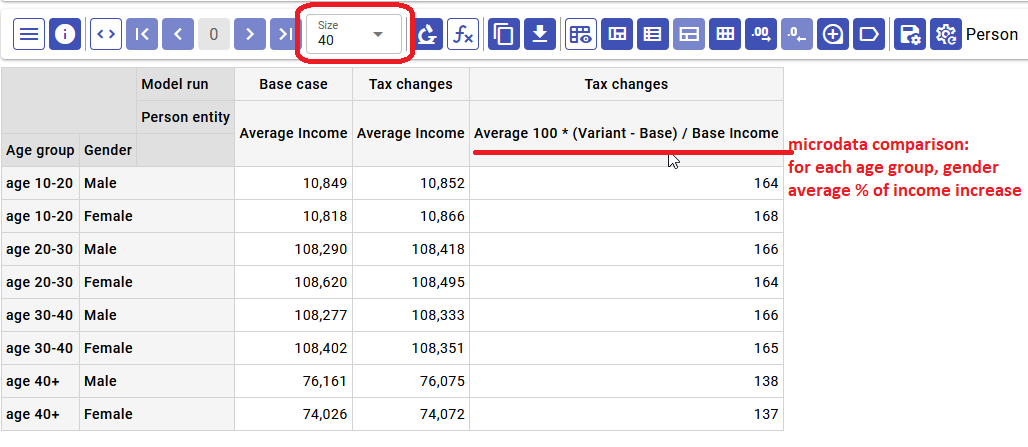
Results below:
-
AverageIncomegrouped byAge GroupandGenderside by side forBaseandVariantmodel runs - Calculated comparison values:
AveragePercentofIncomedifference for eachVariantmodel runs
Important: It is strongly recommended to drag Measure dimension on columns or rows.
Important: You may need to increase "page size" (number of rows to display), default value is 10 only, below it is 40.
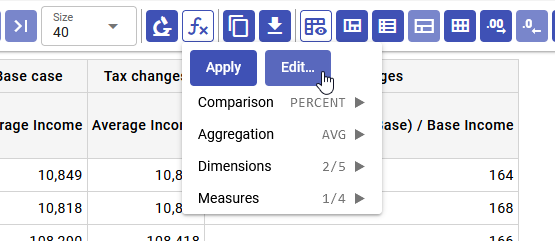
If standard aggregation and comparison menu does not cover your needs then it is possible to Edit, add or remove aggregation and comparison measures.
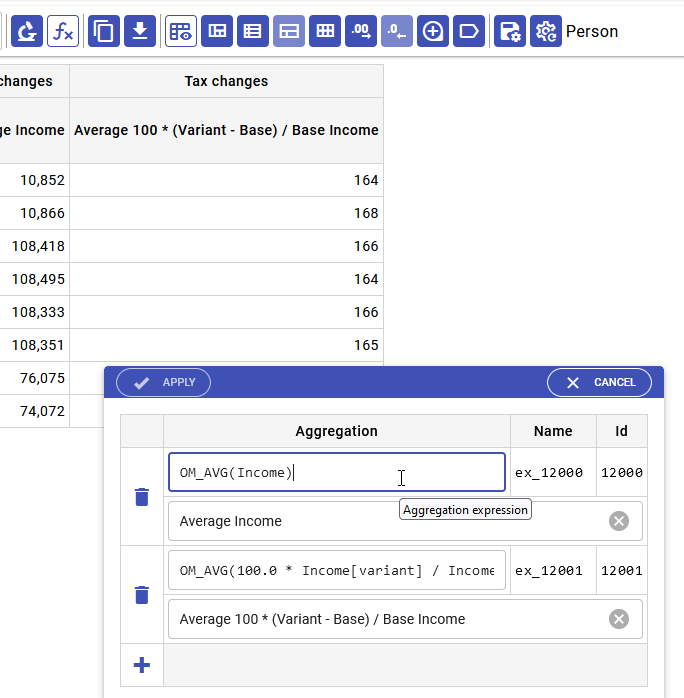
You can use any Output Expressions but top level must be an aggregation function or combination of. For example, it can be: OM_AVG(Income) + OM_AVG(Tax) but cannot be: Income + OM_AVG(Tax).
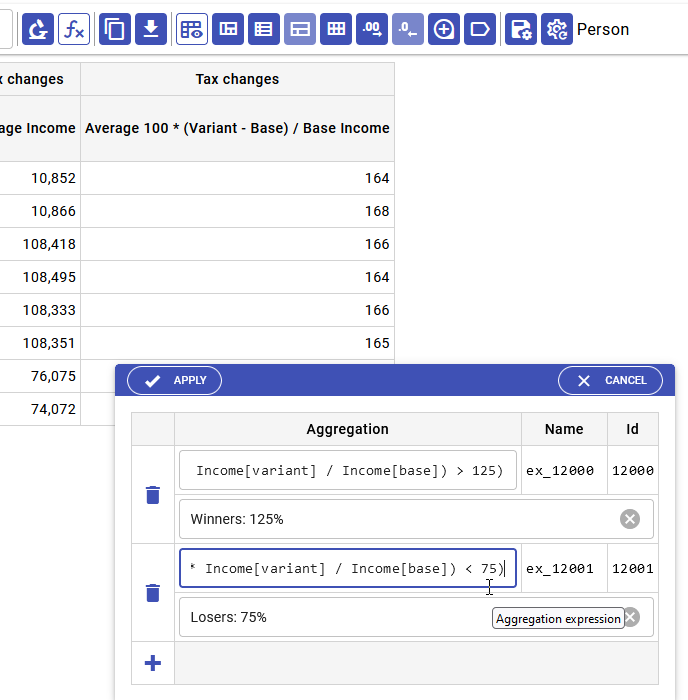
To edit existing measures, remove or add more click on Edit... menu button:
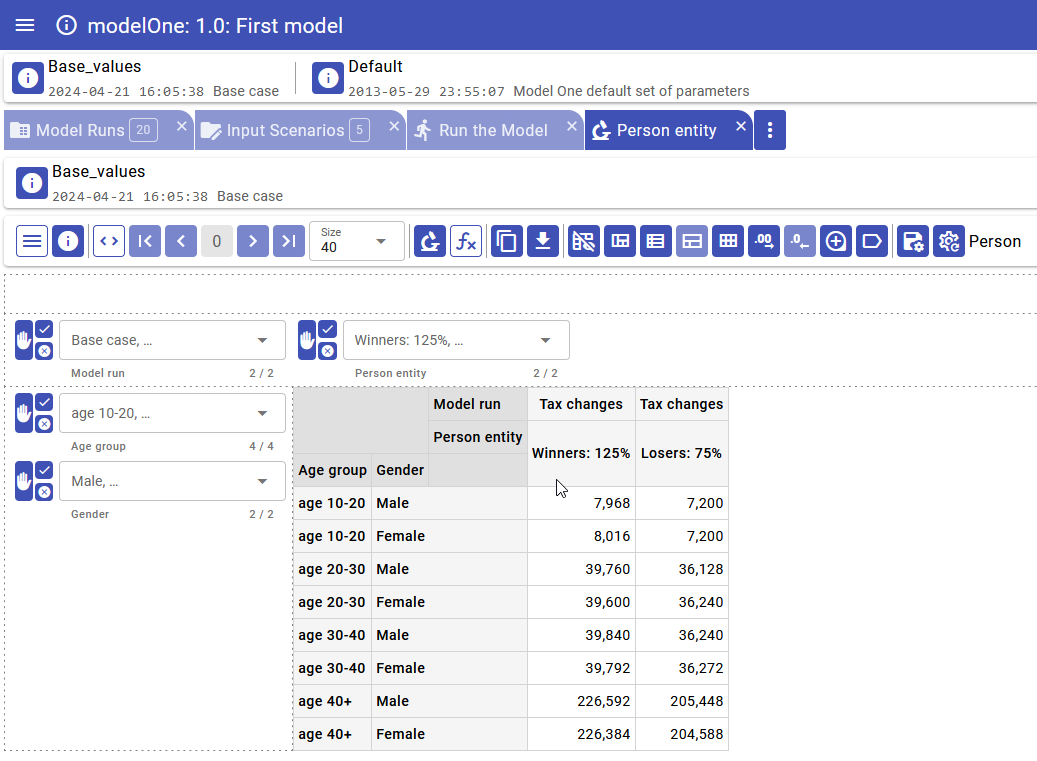
For example to compare Base case and Tax changes then we can find how many Person are winners and losers in each Age Group and Gender. In order to do it:
- select
Base_valuesandTaxChangesmodel runs for comparison - in
PersonmicrodataEdit...comparison measures and enter:- Label
Winners 125%is count ofPersons who haveTax changesmodel run income > 125% ofBase caseincome - Label
Losers 75%is count ofPersons who haveTax changesmodel run income < 75% ofBase caseincome
- Label
OM_COUNT_IF( (100.0 * Income[variant] / Income[base]) > 125)
OM_COUNT_IF( (100.0 * Income[variant] / Income[base]) <  75)
- click on
Applydialog button
