Section 1 ROS GUI Tools - ika-rwth-aachen/acdc GitHub Wiki

In the last exercise you learned about the basic and fundamental terminal commands for working with ROS. Lucky the ROS community does not solely rely on terminal commands, but also many graphical tools with an GUI exists which are helpful for debugging, visualization and development. This exercise focuses on the graphical user interface in ROS, namely rqt and rviz.
- You will learn about RQT which is a Qt-based framework for GUI development for ROS
- You will learn about RVIZ which is a 3D visualization tool for ROS
Start multiple terminals in an acdc docker container and start roscore, the flatland simulation and the vehicle controller again, since their interaction will be analyzed. Use the two launch scripts or the new combined.launch file from the previous unit.
roslaunch racing combined.launchrqt implements the various GUI tools in form of plugins. These plugins can be executed
- from the command line itself, e.g. by executing
rqt_graph - or from within the main window of rqt, which we will do in the following.
To execute rqt, run one of your free terminals
rqtThere is a long list of available rqt plugins, out of which
- the most important plugins (
rqt_graph,rqt_topic,rqt_console,rqt_plot) are covered directly in this tutorial - further important plugins are covered individually in the practical task at the end of this unit
- less relevant plugins are omitted.
Access the plugins from the GUI like in the following image:

Start rqt_graph by selecting Plugins --> Introspection --> Node Graph.
rqt_graph shows how the active ROS nodes are networked through the topics they publish and subscribe to. You can find similar information here like when using the rosnode list or rosnode info commands.

The graph's vertices are ROS nodes and its edges are their associated topics. Here, you can directly see the flow of information in our project:
- The simulation node,
/flatland_server, simulates the vehicle's sensor measurements and publishes them to the topic/vehicle/lidar_measurements. - The controller node,
/vehicle_controllersubscribes to this topic and computes the target velocity and steering angle. - The controller node publishes these target values to the topic
/vehicle/actuator_commands - The simulation node, in turn, subscribes to this topic to simulate the realization of these target values by means of a physical model. The simulation node then simulates the next time step and records new
/vehicle/lidar_measurementsfor this new time step.
By hovering over a certain graph element, its linked elements are colored for clarity. Activate and deactivate some options to see the effect on the displayed graph.
If you don't know the functionality of certain GUI elements, you can let the cursor hover over it and hopefully, a tooltip will help you:

Enter e.g. /vehicle_controller in the namespace filter to see the effect.
Also, play with the drop-down menu where "Nodes Only" is selected in the screenshot to see how other choices affect the scope of the visualization. Filtering what is visualized can help you especially in larger projects.
Start the topic monitor by selecting Plugins --> Topics --> Topic Monitor.
Do not close the previously opened Node Graph such that you can now arrange both plugins side by side. You can drag and drop, and dock / let float individual plugins to create your individual "Perspective" of rqt.
This plugin provides similar information like rostopic list, rostopic info or rostopic echo. Depending on the situation and application, it can be more convenient to use the command line or the graphical version.
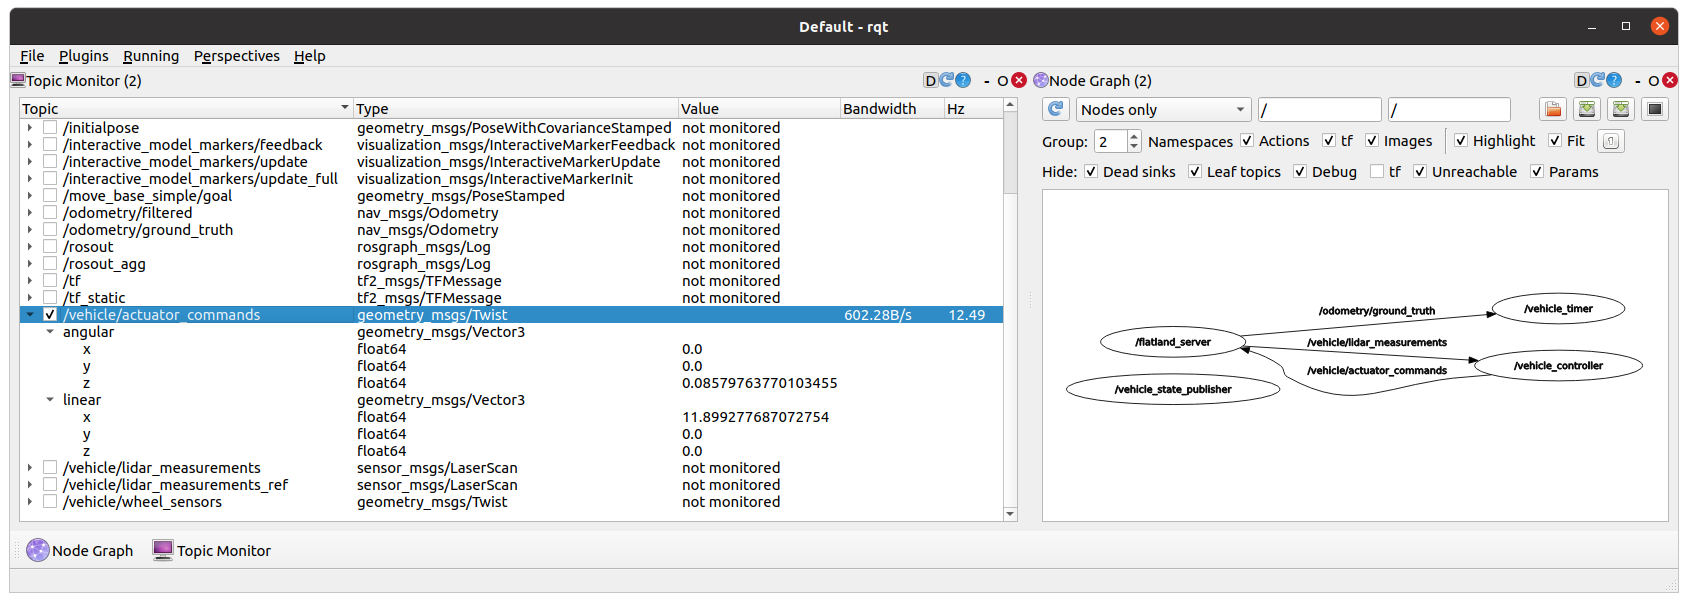
Check and expand the topic /vehicle/actuator_commands to analyze its provided fields:
- Topic includes names of topic and variable names of the transmitted message
- Type provides types and sub-types of the transmitted message
- Value numerical values of the transmitted primitive types
- Bandwidth Data rate transmitted through this topic
- Hz Frequency of data transmission
These fields are updated once per second, irrespective of the actual Hz value.
Like already done in the command line, we can again analyze the geometry_msgs/Twist message that controls the cart. The linear.x and angular.z value are again the ones that are actually used.
Compare the observed frequency to the one of the /vehicle/lidar_measurements topic. Both topics transmit data at an equal rate of 12.5 Hz. That is because the vehicle_controller operates data triggered: every time new lidar measurements arrive, new actuator commands are computed.
Convince yourself that other topics, like e.g. /vehicle/wheel_sensors get published to independently of the mentioned mechanism and therefore show a much higher frequency.
Look up in the still opened Node Graph who publishes to /vehicle/wheel_sensors.
Start rqt_console by selecting Plugins --> Logging --> Console.
rqt_console displays log messages that are published to /rosout. These are the same log messages that you can usually also see in the terminal output after starting a node. However, when one launch-file launches multiple nodes in the same terminal window, observing logs in the terminal quickly becomes infeasible. Therefore, rqt_console provides detailed exclusion and highlighting mechanisms.
After waiting for some seconds, you should see the regularly outputted log messages of the lap time measurement:

Now, shut down the vehicle controller node by hitting Ctrl+C in its terminal window and restart it with ⬆️ + Enter.
After a new start, the vehicle controller node publishes a distinct log message when the cart first crosses the start/finish line. That different log message may be hard to spot among all the others.
You can therefore highlight this message by:
- Highlight Messages... --> "Plus" --> ...containing
- A new row appears (you can also use the existing row)
- Enter "measurement"
- Click Button "Fit Columns" for better spacing
- By removing the checkmark, all messages will be highlighted again

Furthermore, you can also exclude messages based on certain criteria.
Not all of the /vehicle_controller's four log messages might appear in rqt_console. This might be related to them being published right after the node start, when the node is potentially not yet correctly linked to the ROS master.
Start rqt_plot by selecting Plugins --> Visualization --> Plot.
rqt_plot visualizes numeric values in a 2D plot, usually over time.
Plot velocity signals: enter the following strings individually into the "Topic" text field and hit "Plus" each time:
/vehicle/actuator_commands/linear/x/vehicle/wheel_sensors/linear/x
You should see both signals, which differ from each other, in the same plot window.
Plot steering angle signals: open a second instance of rqt_plot by again selecting Plugins --> Visualization --> Plot and enter the following topics/message variables:
/vehicle/actuator_commands/angular/z/vehicle/wheel_sensors/angular/z
Hit the  symbol to adjust your plot:
- Axes settings: You can make the X-Axis --> Left value about 10 smaller than the X-Axis --> Right value for getting a better overview over time.
- Under "Curves", add Markers to each plotted point by making their Size greater than the Line's Width.

In the actuator_commands topic, we have plotted the target values that the controller would like to apply. However, the cart's actuators naturally need a certain time to overcome mass inertia, and thus only follow the target values with a certain delay. This is why the actually measured signals from wheel_sensors are smoothed out and show less peaks than the actuator_commands.
You can see the plotted signals' frequencies by the distance between individual markers.
RViz is a 3D visualizer for ROS, which offers plugins for visualizing custom data types.
Close your currently running rviz instance to start it manually from the command line:
(make sure to keep all other processes running)
rvizIf you only see an empty default view, you can open this project's rviz config file: File --> Open Config and browse to ~/ws/catkin_workspace/src/workshops/section_1/racing/rviz/racing.rviz.
Activate the following Panels --> {Tools, Displays, Views, Time}.

(at the bottom) Several information about timing, including time from the /clock topic and frames per seconds of your visualization.
(on the left) Set the options for how your data should appear in the 3D plot here. A display usually gets its data from a topic, which can be specified in its properties, like e.g. for the "Laserscanner" display:

You can Add new displays and structure them in groups and sub-groups, like done in the "References" or "Sensor" groups.
(on the right) Set up the camera position. Currently, the orthographic "TopDownOrtho" is selected, but you can as well choose to follow the cart like in a video game or have a completely free view.
(at the top) Additional tools that are not covered now.
RViz supports Ctrl+S to save your rviz config for reuse at a later session.
In this task you get to know RViz in more detail. Manually create a new RViz config that looks as similar as possible to the screenshot below.

Hints:
- Use
Add->By Topicto add new visuals - Play around with the colors of the LaserScan
In addition, we want to improve our knowdlege regarding rqt. Try to influence or analyze the following plugins by runningt he simulation and vehicle controller.
Try to get a feeling for what each of the following plugins is for and how to use it. In doubt, look up the official documentation of the plugin. Become creative and play a bit with the options. You should checkout the following tools:
- Configuration
- Launch
- Introspection
- Package graph (only static; might throw an error in ROS noetic)
- Process monitor
- Miscellaneous Tools
- Python Console
- Web
- Robot Tools
- Robot Steering (with
/vehicle/actuator_commands. Try to steer the cart manually!)
- Robot Steering (with
- Services
- Service Caller
- e.g. call
/toggle_pauseservice - or call
/move_modelservice with name="racing_cart"
- e.g. call
- Service Type Browser
- Service Caller
- Topics
- Message Publisher
- Message Type Browser
- Visualization
- RViz (inside rqt!)
- TF Tree (for the transformation between
mapandbase; base is the cart coordinate system)
- You learned that you can use the command
rqtto start RQT andrvizto start RVIZ - You learned that RQT is a mighty tool which contains many helpful plugins that can be used for visualization, debugging and development
- You learned that you can start RVIZ with a configuration that can be loaded and stored as a
.rvizfile