ProjectHome - almarklein/visvis GitHub Wiki
Introduction
Visvis is a pure Python library for visualization of 1D to 4D data in an object oriented way. Essentially, visvis is an object oriented layer of Python on top of OpenGl, thereby combining the power of OpenGl with the usability of Python. A Matlab-like interface in the form of a set of functions allows easy creation of objects (e.g. plot(), imshow(), volshow(), surf()).
Visvis ...
- is easy to use
- is cross-platform
- is lightweight
- is designed to be easily extendable
- can be used in scripts
- can be used in interactive sessions (like in IPython or IEP)
- can be embedded in (commercial) GUI applications
- runs on Python 2.x and Python 3.x
- requires Numpy, pyOpenGl and a GUI backend.
How visvis works
With visvis a range of different data can be visualized by simply adding world objects to a scene (i.e. an axes). These world objects can be anything from plots (lines with markers), to images, 3D rendered volumes, shaded meshes, or you can program your own world object class. If required, these data can also be moved in time.
Online documentation is available for all classes and functions. Any questions can be asked in the visvis discussion group.
At EuroScipy 2012, I gave a talk about Visvis. The long version of the presentation can be seen here and there is also a PDF.
Example
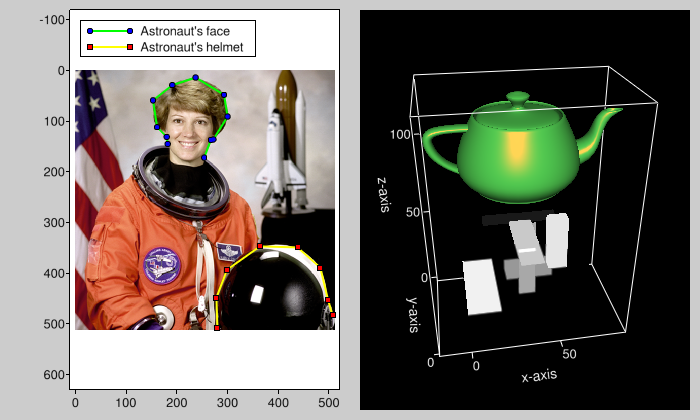
Click on the figure to see the code and how the user can interact with the figure.
Support Visvis
You can support the development of Visvis by:
- Reporting issues and bugs or propose improvements.
- Let me know if you like Visvis. Positive feedback is very motivating for any open-source developer.