example_plotting - almarklein/visvis GitHub Wiki
#!/usr/bin/env python
import visvis as vv
app = vv.use()
f = vv.clf()
a = vv.cla()
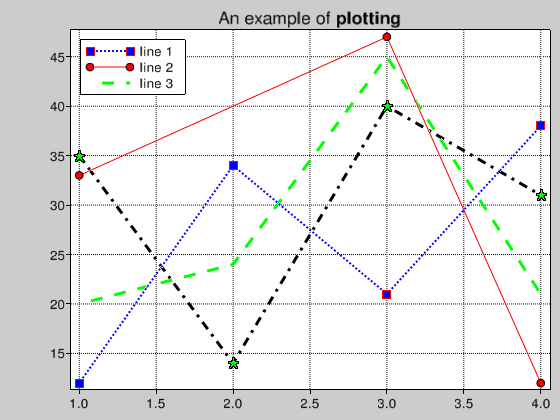
vv.plot([12,34,21,38], lc='b', ls=':',mc='b', mw=7, lw=2, ms='s', mec='r')
vv.plot([1,3,4],[33,47,12], lc='r', mc='r', ms='.')
vv.plot([20,24,45,21], lc='g', ls='--', mc='g', mw=12, lw=3, ms='')
vv.plot([35,14,40,31], lc='k', ls='-.', mc='g', mw=12, lw=3, ms='*')
# If the star is not visible, your OpenGl system does not support point sprites
a = vv.gca()
a.legend = 'line 1', 'line 2', 'line 3'
a.axis.showGrid = 1
a.axis.xlabel = 'measurement number'
a.axis.ylabel = 'some quantity [unit]'
vv.title('An example of \b{plotting}')
app.Run()