RealCase3 - adrianrm/javamelody GitHub Wiki
JavaMelody real case: Dozens of users are working extra-hours because a screen is very slow
Here is a third real case of monitoring and improving the performance of a Java application using JavaMelody.
You can also read the first JavaMelody real case and the second JavaMelody real case.
The context
A system with several applications is used in a French public administration by thousands of people of the administration, and by private companies and by citizens which are the final recipients of the system. The company I work for is maintaining this application for some years.
The system has an internal application, a public web site for citizen, internal web-services between the application and the web-site, and external web-services for private companies fulfilling a public service by contract.
The technologies of this system are: Java, Tomcat, Postgresql, Hibernate 3, Spring 1 (that was modern a long time ago but not when the application was created).
There are about 150 tables in the database (which is not much).
Investigation
The application uses JavaMelody in dev, in test and in production. JavaMelody is included classically with the javamelody-core dependency.
So let’s open the monitoring page of the aggregated data for the 4 instances of the internal application. Here are the graphics at the top of the monitoring page for the day period:
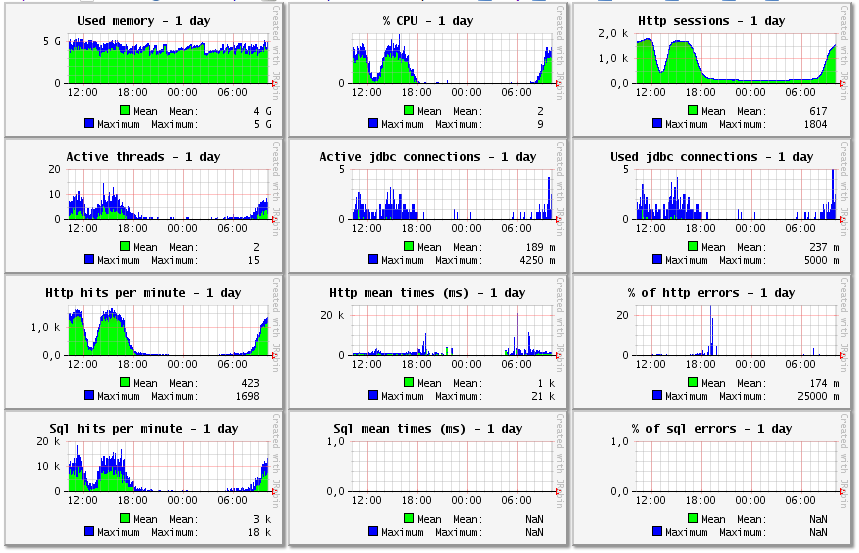
Used memory and others graphics are the sum of the used memory of each instance, except % CPU which is the aggregated percentage between 0 and 100 of all instances.
The summary statistics of the http requests for one day:

What was found
The sql request having the most cumulative time
In the statistics of the sql requests of the application, the sql request having the most cumulative time across the applications of the system is a simple select by id with a mean time of almost 0 ms, but with about 5 millions of hits per working day. And this sql request is a select on less than 10 rows of reference data which has not changed for 4 years! Said otherwise, the most expensive sql request in the application is an absolute waste of time.
After checking the sql statistics, many other entities and specific sql requests are for reference data or master data.
Those entities, their relations to collections and those specific queries have now been put in second level cache. When using Hibernate, like in these applications, this can be done by an annotation on the entities classes, and also on OneToMany and ManyToMany relations in the entities, and with setCacheable(true) for queries.
Configuration of the time to live
In the configuration for the second level cache, the time to live was configured to 5 minutes and nobody was thinking about that. 5 minutes is far from optimal for reference and master data in my opinion.
The time to live in the cache configuration has been changed to 4 hours.
The http request consuming 78 MB of memory
In the statistics for the http requests of the public web site, the http request having the most cumulative time is for uploading of a file such as pdf or photo. It has a mean time of 4 s, a maximum time of 440 s, a percentage of system errors of 19.9 % and a mean size of allocated memory of 78 MB per execution!
We have looked at the java code for this upload request to know why there is so much memory allocated and we found a collection of bad practices:
- It is useless to read all the bytes of a file into memory just to know its length: java.io.File.length() is way faster.
- And it is useless to read all the bytes of a file just to check if the 5 first bytes are the magic number of a pdf (“%PDF-“): reading only the 5 first bytes in an array is way faster.
- And it is useless to read all the bytes of a file or of a stream to copy it to another place. For example, InputStream.transferTo(OuputStream) exists since Java 9 and uses a 8 KB buffer to copy bytes without allocating an array of the size of the file or of the stream. This was done a dozen times for generating pdf from image, for generation thumbnails from pdf, and for copying via temporary files.
- And it is useless to copy to temporary files just to read them again, when the files to read from already exist.
In the same way, when downloading a previously uploaded file:
- It is useless to read all the bytes of a file into memory to send them to the http response: just send the bytes from the file directly to the http response stream using a 8 KB buffer like in InputStream.transferTo(OuputStream).
- It is useless to read all the bytes of files and also to copy those to temporary files, just to make a zip of the files with different file names: just make a zip from the initial files and define the different file names when making the zip.
The unfortunate lock
After starting to look at the monitoring data, we learned that dozens of users in a particular unit have an issue with a very slow screen. Indeed, a slow web-service and in detail for the http request, a slow sql request were identified as directly related to this screen. The mean execution time of the sql request and of the web-service was 18 s and maximum was 87 s. It was said that some people in this particular unit were working extra-hours in the early morning and late evening to keep up with the work to do.
Those people are working in a particular way: they act as a pool of workers by reserving some task ordered by age in the queue, and later by validating the data of the reserved task, with a reservation timeout in case of no validation, everyone in parallel of the others. The reservation is done by first selecting and reserving just one row of data. That was a slow and complex sql request which is a select with 15 joins and which ends by “… limit 1 for update of mytable”. (“limit 1” limits the rows of the result to only 1 even if there are 10000 rows available for the same conditions. And “for update of mytable” adds a pessimistic lock on the selected row(s) until the end of the transaction at commit time.)
At this point, a curious developer could ask if the locking with “for update of mytable” is done before or after the limiting of the result with “limit 1”. (The difference is adding a pessimistic lock on 1 row in the database or adding it on 10000 rows.) With Internet, it was found that it depends on the presence of “order by” which would cause all the rows to be read, ordered and all locked. Unfortunately in our case, the select has indeed an “order by” before “limit 1 for update of mytable” and the developer was not asked to be curious.
The scenario of this episode was a crisis waiting:
- At some time, a bit more data was inserted in the database tables.
- Because of this, a purge broke each night with OutOfMemoryError and logs of the purge were not checked causing more data in the database tables day after day.
- After some months, the select for reservation became a bit slower because of more data in the 15 tables to join in the select, and data is waiting longer in the queue.
- And because of “order by” and “for update” despite “limit 1”, the select locks all possible rows to be reserved but now has more rows to lock.
- With more rows to lock, the select is even slower and data is waiting even longer in the queue, which causes more rows to lock and a vicious circle.
- After many months of this vicious circle, each execution of the select increased to 18 s and all possible rows are locked for the duration of the reservation transaction.
- With dozens of workers in the unit, they are more and more working as a single worker waiting the other workers to release the locks on all possible rows. And what was said about extra-hours was true; a workaround to the issue was to work early in the morning or late in the evening, just because their co-workers were not locking them.
To fix the issue, we have separated the “limit :N” and the “for update” in different sql requests, but be aware that a reservation by a unique worker of a task from a queue is a bit tricky and that with parallel workers, the reservation state of a task can change any milliseconds in time before acquiring the lock (“for update skip locked” may help).
The other issues
Other very slow requests were identified but not analyzed due to lack of budget for such analysis not seen as needed yet.
Conclusion
We have looked with this system of applications at what can happen when everyone is focused for years only on the desired behavior and not at all on the basic practices for performance, like if performance problems never exist when no one anticipates what to do for performance. Many issues may happen in production as a consequence. When the issues become clear for everyone, that’s when one feature changes suddenly from slow to hardly available. It’s a bit late in my opinion.