RealCase2 - adrianrm/javamelody GitHub Wiki
JavaMelody real case: Investigation of a Java application with some very slow screens
Here is a second real case of monitoring and improving the performance of a Java application using JavaMelody.
You can also read the first JavaMelody real case.
The context
An application is used in a French public administration by hundreds of people. The application is 13 years old and had a lot of functional evolutions over the years to follow the changes of laws. The company I work for is maintaining this application for about a year.
The technologies of this application are Java, Tomcat, Postgresql, Apache reverse proxy. We have migrated Java 7 to Java 8, Tomcat 7 to Tomcat 9, Postgresql 9.1 to Postgresql 9.6. And I wish to see a migration to more recent versions of Java and Postgresql. (I am convinced that technologies are not the cause of the issue here. It all depends on developers who have forgotten to fix their code.)
There are 4 Tomcat instances for the users and 2 Tomcat instances dedicated for the clustered batchs. Each Tomcat instance has 8 CPU cores, 3 GB for Xmx and 6 GB for physical memory.
There are 356 tables in the database and the total size of data is about 12 GB in binary dumps of the database. Several tables at the heart of the application have more than 10 millions of rows and one table has 170 millions of rows.
The issue is that some screens are very, very slow in production and also while testing: 30 seconds of response time is not uncommon. Many other screens are just a bit slow. Users are unhappy. And the batchs are sometimes running all night, which is an issue for taking backups of data and also for distant territories in other time zones.
Investigation
The application uses JavaMelody in dev, in test and in production. JavaMelody is included classically with the javamelody-core dependency.
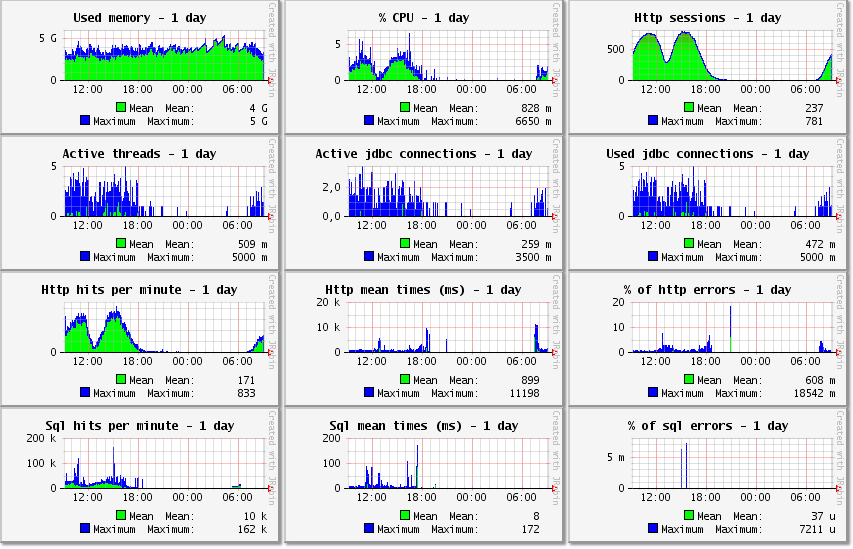
So let’s open the monitoring page of the aggregated data for the 4 instances. Here are the graphics at the top of the monitoring page for the day period:
And the same for the week period:
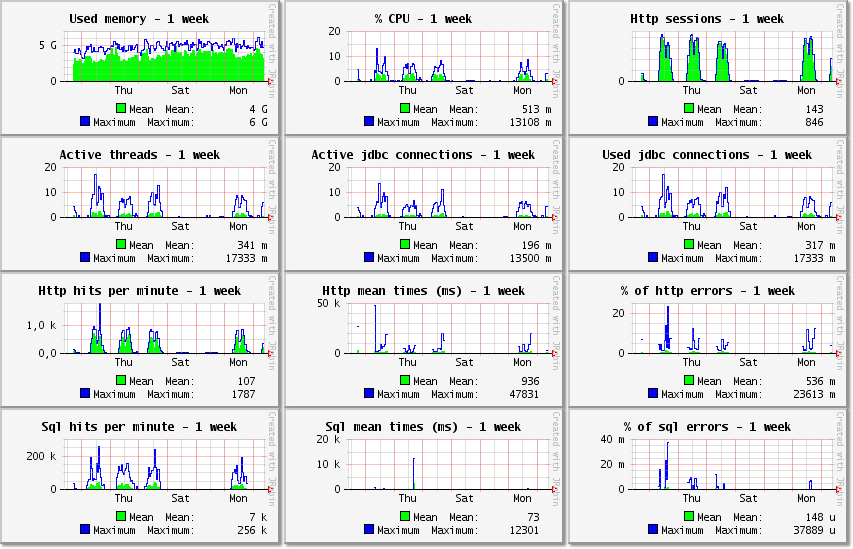
Used memory
The used memory is the aggregated memory used by the JVM heaps. It is the sum of the used memory of each instance.
% CPU
The % CPU between 0 and 100 is the aggregated percentage of all cores of all instances. In the % CPU graphic, the mean is 513 m and the maximum is 13108 m for the week period. In all graphics, the units of the values are "m" for milli (1 / 1000), "k" for kilo/thousands, "M" for mega/millions, "G" for giga/billions and "u" for micro (1 / 1000000). So the mean of % CPU is 0.5 % and the maximum is 13 %.
We can already conclude that the 8 CPU cores for each of the 4 Tomcat instances are underused at all times. And we could reduce the number of CPU cores to half.
Http sessions
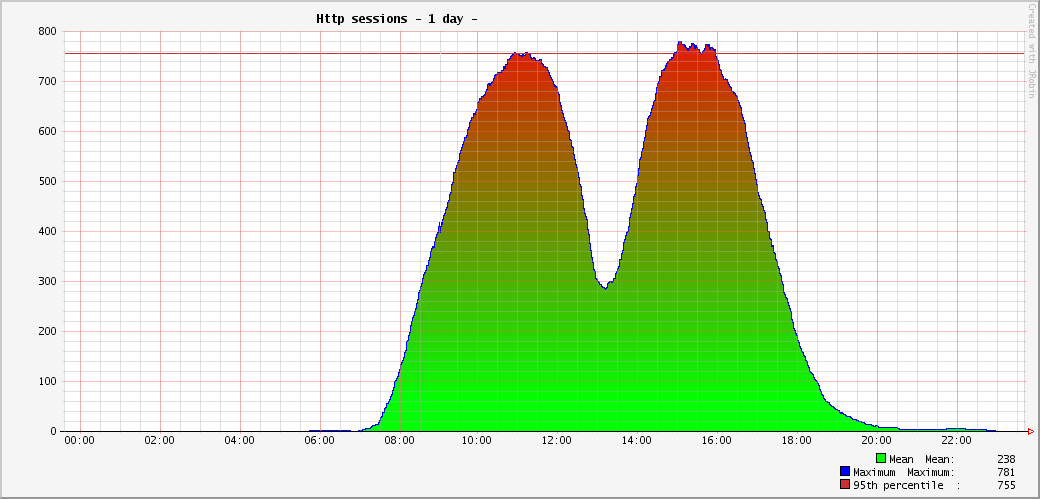
In a zoom of http sessions, we see that the application is used only by this French public administration with fixed hours and with only a few users before 7:00 and after 20:00. And most users are leaving for lunch at 12 with each others.
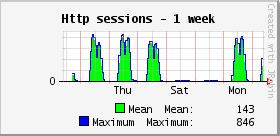
There are a maximum of about 850 connected users simultaneously at 11:00 and 15:30 almost every day.
Active threads
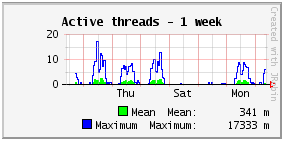
The active threads are the number of current HTTP requests, which are started but not yet completed. The mean number of active threads here is 0.3 and the maximum is 17. Given that there is no activity at night, we could also say that the mean number of active threads is in fact 0.6 from 8:00 to 20:00. Compared to the case of the website, we have 10 times less active threads in the application than in the website, but the mean http time is 3 times higher with often more work to do in the application than just displaying content like in the website.
Note that people often think that the application should handle hundreds of simultaneous requests, because they have hundreds of simultaneous users. And such a small number of active threads (between 0 and 17) is a surprise for them. But it is normal for every application to have a small number of active threads, such as sometimes 1 and sometimes 10 and in general not too much above the number of CPU cores, because a (logical) CPU core can handle only one running thread at a time anyway. And the free CPU cores should be used for background tasks, such as minor GC to prevent the obligation of a major GC. (Given that active threads may in fact be waiting for the results of I/O such as SQL requests and so are not running all at the same time, you may be ok with a number of active threads a bit greater than the number of cores). In our case, the 32 CPU cores can very easily handle the maximum of 17 active threads, which are mostly waiting for the results of SQL requests anyway. We could reduce the number of CPU cores by half without any difference.
If there is a way to handle high load, it is not to have many CPU cores to handle more and more active threads in my opinion, because one day or the other the requests will be too long for what the CPU cores (and the database) can handle and once overwhelmed the CPU cores may not recover from the situation with requests piling up. The right way to handle high load is to have requests as fast as possible so that CPU cores are free for the next requests. And so the number of active threads is not so high with requests flowing fast and many CPU cores are not needed.
Used jdbc connections
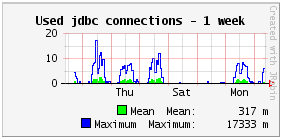
The used jdbc connections are the connections opened (taken from the pool of connections in general) and not yet closed (returned to the pool). When used, a jdbc connection is ready to execute SQL requests.
The used jdbc connections can’t be higher than the maximum value configured in the pool of connections (in the DataSource configuration in general, which is often displayed in the System informations of the monitoring page).
Most applications use no more than 1 jdbc connection per active thread, in order to have only one transaction per user request and to be able to rollback all changes in the database if needed. So the number of used jdbc connections is less than the number of active threads at all times, for most applications.
Active jdbc connections
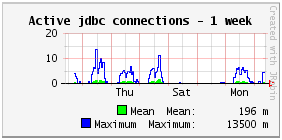
The active jdbc connections are the connections opened and now executing a SQL request (that is the execution itself, without the fetching of the data from a select).
By definition, the number of active jdbc connections is less than the number of used jdbc connections at all times.
Statistics http - 1 week – summary
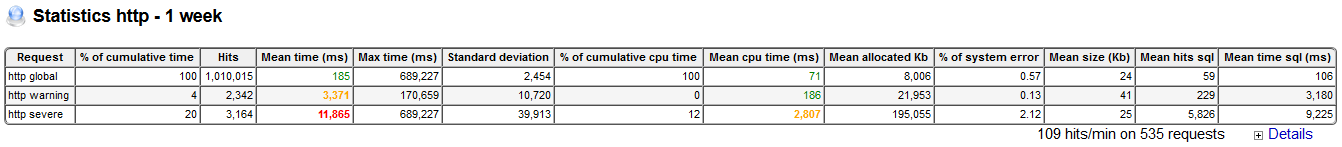
Zoom in your browser and see that the statistics of http requests display first a summary of all requests (global), of requests beyond the threshold of alert level 1 (warning), and of requests beyond the threshold of alert level 2 (severe). By default, the warning threshold is 1 x standard deviation and the severe threshold is 2 x standard deviation. The standard deviation of all requests is displayed on the http global row: 2454 ms. So, time of requests is displayed in orange between 2.45 s and 4.9 s and it is displayed in red beyond 4.9 s.
And if we look at the “Hits” column, 3164+2342 among 1010015 http hits were longer than 2.45 s. That’s 0,5 % of “slow” http requests and not a bad percentage in fact. So why are users unhappy? We have a hint in the “% of cumulative time” for that question: the 0.5 % of “slow” http requests took 24 % of the total time of all requests. That’s a lot! Said otherwise, the “slow” http requests are quite rare, but when they are slow, they are very, very slow.
The summary of statistics also shows that the mean response of http requests is 185 ms for the last 7 days starting at midnight. And there was a mean of 59 sql hits per http hit. And there was a mean of 106 ms in sql requests per http hit (so 106/185 = 57 % of http time is in execution of sql requests). 59 sql hits per http hit is quite a lot, we will see why.
Statistics http - 1 week - details
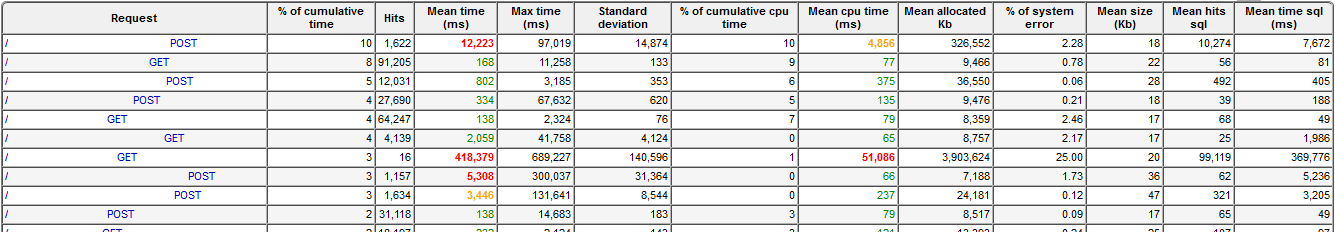
Let’s look at the details of the statistics of the http requests to see which ones are “slow” and used often enough to bother. (The requests names were hidden in the screenshot.)
By default, the requests are sorted by cumulative time descendant (that is by hits x mean time descendant). So, “fast” http requests may be before “slow” http requests, when they are called often and have more impact on the users. For example, the second http request in the list is fast with a mean time of 168 ms, but it is the second one having the most impact on the users because it is called very often and it is still worth to optimize it to reduce the waiting time for the users. We can reorder the request by clicking on headers, for example by max time or by mean hits sql, depending on what kind of issues we want to look at.
We have the same kind of statistics for the sql requests.
What was found
Missing index on foreign keys
In the hundreds of different sql requests, there were complex requests with dozens of joins, unions, exists and in conditions with subselects. Some sql requests were really frightening and they were not all fast of course. But among the top 5 sql requests having the most cumulative time, there was simple selects with only a single or two joins. No reason for them to be slow at first look.
On second look with the help of a Postgresql execution plan, it was found that the joins on foreign keys in those sql requests did not use indexes. And indeed, using a sql script to find foreign keys without indexes, 89 foreign keys without indexes were found. When the foreign keys were created, the indexes were forgotten. For some years, it was not a big issue because the number of rows in those tables was low enough and the database had more power than necessary. But once the number of rows increased to millions of rows, it was finally measured to be one of the top issues even for simple requests.
The 89 missing indexes on foreign keys were added.
Duplicate indexes
While looking at indexes, it was found some exactly duplicate indexes. A complete list was found using a sql script. The duplicate indexes are of course useless.
The 17 duplicate indexes were removed.
Missing foreign keys
And while looking at foreign keys, it was found that some foreign keys were also missing! That’s a severe issue because nothing is more precious than correct relations between data, even performance. Using another sql script to find missing foreign keys based on naming of columns, 29 foreign keys were found missing and added. By the way, when adding the missing foreign keys, some incorrect id values of relations were found and fixed. Indexes were also added for those new foreign keys.
Entities of reference and master data without cache
In the sql statistics, there are a lot of select by id on reference or master data. These reference or master data never or rarely change and are mostly enumerations of different types, enumerations of different states or lists of codes. It could be optimized by eager fetching of the joined data in JPA, but using a second level cache with a long time to live is better with no need to fetch the joined data. Putting those entities in cache will remove a large number of sql hits without changing the behavior.
Given that the behavior is the same, using the second level cache is often a simple task forgotten by many developers which think about desired behavior and not at all about performance. Such applications are often put in production like this and the performance may be so bad that they can sustain just a few of connected users.
We put 14 entities in the second level cache (that is a cache in java memory shared for all the webapp).
Specific requests on master data without cache
After the first optimizations were put in production, we looked again at statistics for a new week.
And it was then found that the sql request having the most cumulative time was a request with specific conditions on some master data, so it can also be put in cache. It was called in loop with a lot of other requests but it was a bit longer than others.
We put the specific sql request in the second level cache without a second thought.
Select N+1 anti-pattern
The monitoring page also displays statistics for Quartz scheduler jobs like for http requests. In this application, they are batchs which are mainly call at night.
In one complex transaction inside a Quartz job running for about 30 minutes, there were a lot of sql requests in loops.
After opening the details for this Quartz jobs, we see that one of these sql requests was called hundreds of times in a loop and took 5.5 seconds each time. The cumulated time of the identified sql request was taking most of the time of the job. (It is a sql request of a select with an “in” condition based on a subselect which is itself an “union” of 5 selects with an “in” condition based on another subselect using joins and “group by”. Not a surprise if this monster of sql request takes 5.5 seconds). We thought of rewriting this sql request entirely but we had some issues to understand what it is trying to do.
So, without trying to rewrite the sql request, we have just simplified some conditions and above all we have transformed the request to call it only once for all the data of the loop, instead of calling it with a parameter for a subset of the data in each iteration of the loop. By doing this, we removed a well known “Select N+1 anti-pattern” (executing a select for each element of a loop) and also the duration of the Quartz job was reduced by 70 %, from 30 to 9 minutes.
Useless union
When opening the details of the longest http request by cumulative time, we see long a sql request. (The request details were hidden in the screenshot).

The “Hits by parent request” columns shows that it is called only once per call of the http request. But if we compare the mean time of the sql request (9.2 s) compared to the mean time of the http request (13.3 s), we that this sql request is a large contributor to the execution time of the http request. So an optimization of the sql request would have a large impact.
The sql request was in fact written with unions between four selects. And after careful reading of the joins and conditions, it was found that one of the unions selects a subset of another union. That is useless to add an union on a subset of data already selected.
The useless union was removed.
By the way, the values of the parameters were hard-coded directly in this sql request (without using binded parameters). This is bad for security against sql injection and this is bad for performance to reuse the execution plan in the database.
We replaced the hard-coded values with jdbc binded parameters in this sql request and also in many other sql requests for the same reason.
Code refactoring
We have already seen above that the second longest http request by cumulative time is only 168 ms, but it is called very often. When opening the details of this http request, there is also a sql request longer than the others. This sql request is only used as a condition to display or not a button. Other java conditions such as hiding based on the connected user’s profile were unfortunately coded after the call to the sql request.
Moving the java conditions before the condition based on the sql request was enough to not execute the sql request most of the time.
Index for search
A long and complex sql request attracted our attention because several percents ended in error as displayed by the “% of system error” column and its max time was exactly 300 s like a timeout to cancel the request.
The timeout errors of this request were an issue because it is used in an important search. The sql request was not optimal because its main condition was written with “some_code like upper(?||’%’)”, where “?” is a value binded to a parameter. Such a condition would not use the index on the some_code column, as we have checked with the Postgresql explain command.
We added another index for this search, using an operator class varchar_pattern_ops suitable for the like operator.
Other errors in sql
While looking at sql requests ordered by the “% of system error” column, we found another sql request with errors. Its syntax was incorrect with an empty “in ()”. It was a bug in production which was not declared.
We reproduced the bug and fixed it.
A useless management dashboard
12 years ago several dashboards were created in the application with a quickly made data warehouse in the relational database. These dashboards were created for some national statistics and for the local management of tasks, while waiting for the definition and creation of Business Intelligence dashboards using dedicated database and tools. But for whatever reason, the Business Intelligence dashboards were never defined and created successfully.
12 years later, we now have to maintain the still used but quickly made data warehouse in the relational database. But the iterative import of data in the data warehouse for the dashboards is made by a Postgresql stored function. The execution of the stored function was taking between 30 and 60 minutes every night and it needed to be optimized. A difficulty was that JavaMelody monitors the calls to the stored function in the database, but JavaMelody cannot monitor the calls to the sql requests in the stored function. So, we installed the pg_stat_statements module in the test database to measure the statistics of the execution times of the sql requests. One day later, we understood that the longest sql request in the stored function was taking 30 % of the stored function time. And surprise, that long sql request was in fact for some not well-known dashboard which has almost no data since a change of the law seven years ago. In fact, the last event to potentially be displayed in this dashboard was two years ago, for a recourse on a file seven years old governed by the law of that time, and there will be possibly no more events like this in the future.
Thanks to the monitoring with pg_stat_statements, we removed the useless management dashboard and the long sql request which was importing data for this dashboard. The duration of the daily import of data for the management dashboards was reduced by 30 %.
And we know the second sql request which would need to be optimized in the stored function.
Index for a night job
Another Quartz scheduler job is executed every night to integrate data from another information system. The job has a mean execution time between 5 and 21 minutes.
When opening the details of the job, we see that each job execution calls thousands of times a select by a code number to check if the data to integrate already exist in a buffer table which contains 384000 rows. The hits x mean time of the select shows that it takes 70 % of the execution time of the job.
We have added an index on the code number in the buffer table to reduce significantly the execution time of the job.
Purge
The database contains data for the last 14 years now and the client has never wanted in 14 years to delete data, in case of litigations. At last, the client has decided to purge some of the very old data when litigations were not possible anymore. It is long to remove rows among millions and keep it consistent, but bits by bits it will be deleted using jdbc prepared statements in batch mode.
With less rows in the main tables, the purge is expected to reduce the execution times of some SQL requests.
Conclusion
Optimizations were found for all the issues explained. And some optimizations are already put in production. So we can compare the metrics and the statistics in production between before and after the first optimizations:
- Mean response time of all screens combined decreased by 40 %
- Mean response time of some important screens which were slow decreased by more than 90 %
- System errors decreased by 16 %
- CPU usage decreased by 18 %
- Mean number of sql hits per http hit decreased by 41 %, from 59 sql hits per http hit to 35.
As you have seen, it is quite easy to find why an application is slow. And there are often different causes for the different screens, and once found we have to analyze the issues one by one. Fixing the many issues may be difficult and may need to imagine and study different approaches. Fortunately we can recognize similar patterns in issues and some of the issues have well-known solutions, for example second level cache on entities for reference and master data.