The Device Page - TheThinkingHome/device_sentinel GitHub Wiki
The Device Page
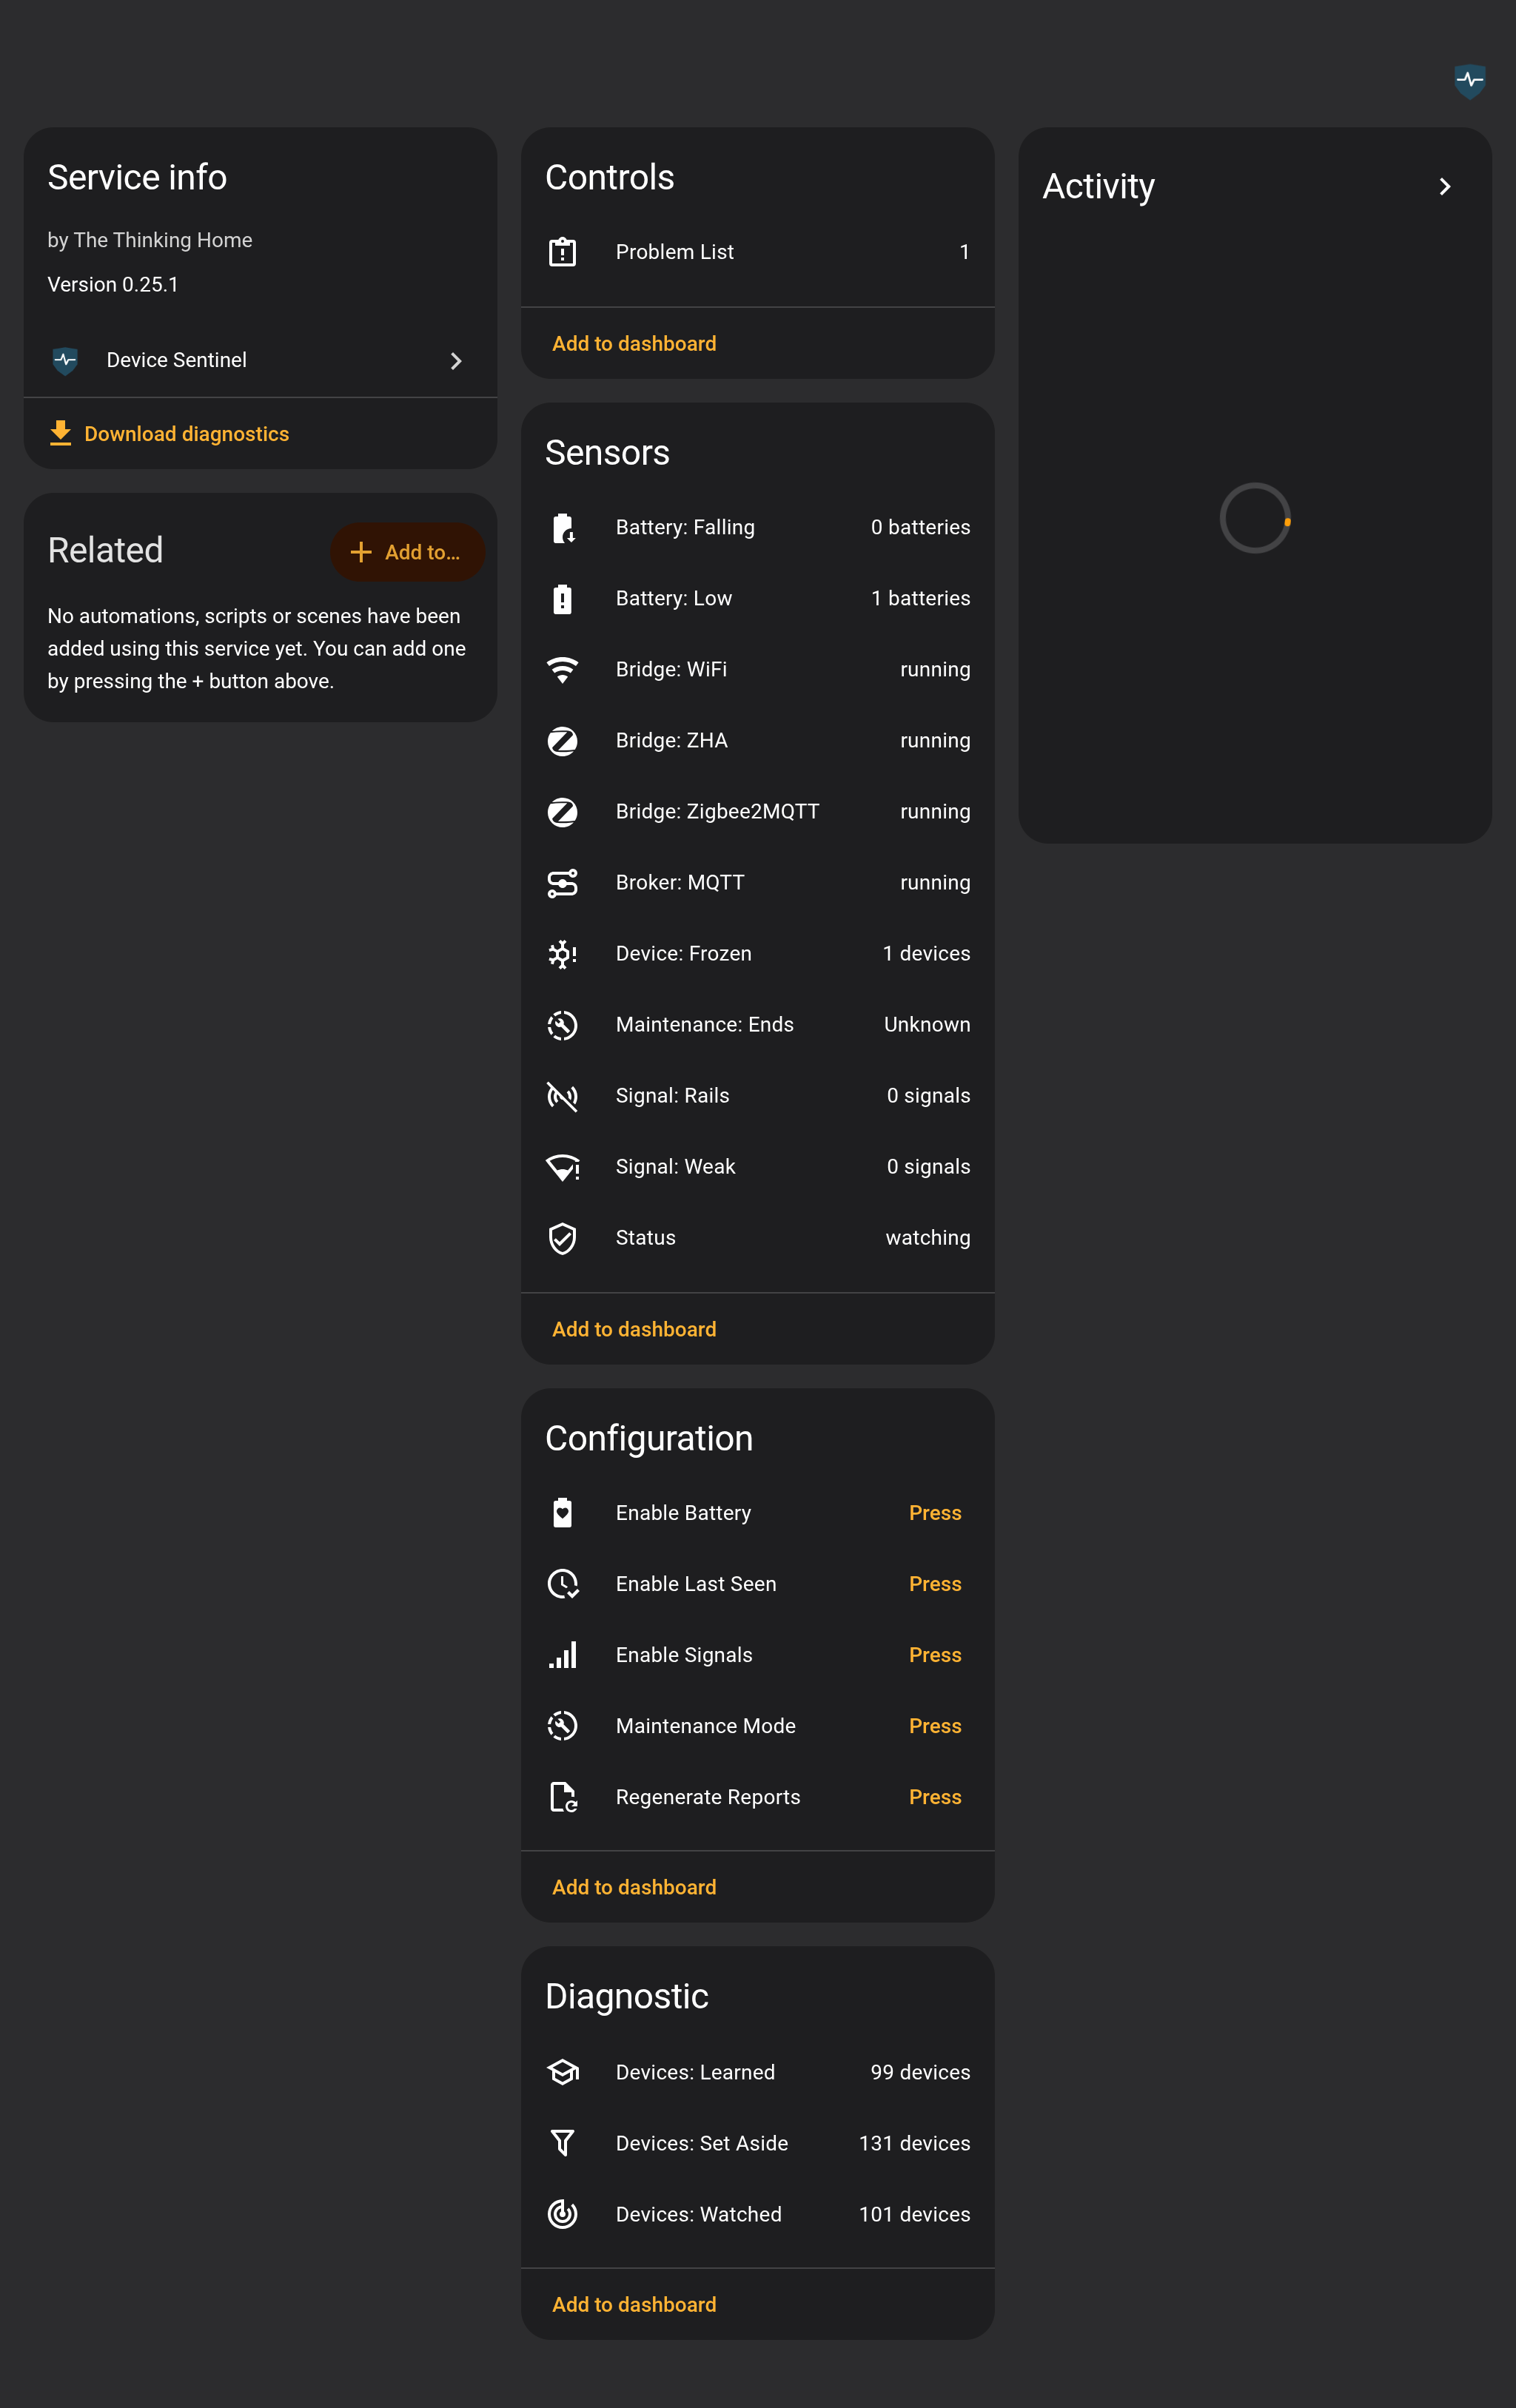
This page describes the central hub for the integration: the Device Sentinel "device" page in Home Assistant. You can find it by navigating to Settings > Devices and Services > Device Sentinel.
Home Assistant does not provide helper text for entities on this page, so an entity's name and its state are the whole explanation. This guide breaks down what each control and sensor tells you, and how to use them to keep your monitoring accurate.
1. Active Controls & Maintenance
These buttons are how you actively manage the integration, enable diagnostics, and pause learning when you need to work on your hardware.
Maintenance Mode (Key Workflow)
Because the integration cannot see your hands, a manual fix (like a battery swap, a power cycle, or a device re-pair) looks identical to a device recovering on its own from a long silence. If the system learns that long silence, it will widen the freeze window for that device, making future detections much slower. Maintenance Mode covers the whole workflow.
Maintenance Mode tells the system you are actively working on the hardware.
How to use it:
- Press Maintenance Mode before you touch the hardware.
- Perform your repair (swap the battery, press the wake button, re-bind it, etc.).
- Press the button again to end the window early, or simply let it expire automatically (defaults to 10 minutes).
Note: Any device that recovers while this window is open is treated as your fix, and its silence gap is safely discarded rather than learned.
The Maintenance: Ends sensor shows when the open window closes, and reads unknown when none is open. Put it on a dashboard for a countdown.
The Three Enable Buttons
Most integrations ship their diagnostic entities disabled by default. Device Sentinel cannot learn from what is switched off. These three buttons turn on, across your watched devices, the entities Device Sentinel needs:
- Enable Last Seen: Turns on last-contact entities. This is the most reliable clock a device can offer and drastically speeds up freeze detection.
- Enable Battery: Turns on battery-percentage sensors (which feed the battery discharge history).
- Enable Signals: Turns on link-quality (LQI) or signal strength (RSSI) entities so Device Sentinel can establish a signal baseline.
Note: These buttons only target watched devices. Devices you have explicitly set aside or excluded are ignored.
Regenerate Reports
Makes Device Sentinel judge every device right now and rewrite the daily brief and the diagnostic files. Use it after you fix a frozen device, so the brief shows the fix at once rather than at the next check.
2. Verdicts at a Glance (Sensors)
These sensors provide a live, at-a-glance summary of everything currently wrong in your home. Note: Most finding counts ship switched off by default. Enable the ones you want to view on this page or on a dashboard.
- Problem List (To-do list): The one place to see and act on what is wrong. Contains frozen/unavailable devices, low/falling batteries, and stuck signals. Checking a row acknowledges it, silencing notifications while keeping the item on the list until the device actually recovers.
- Status: Reads
Watching,Learning, orProblem. It will read "Learning" until your very first device establishes a rhythm. "Problem" means Device Sentinel's own storage is unhealthy. - Device: Frozen: How many devices are currently frozen, unavailable, or unknown. The attributes contain the full list of downed devices.
- Battery: Low: How many batteries have crossed your flat low-battery threshold (15% by default). Its attributes name each device, its level, its area and how long it has been low.
- Battery: Falling: How many batteries are projected to hit 0% within your warning horizon (e.g., 30 days), based on how fast their weekly average is falling, including batteries that have started falling faster. This catches dying lithium cells that still read a high percentage.
- Signal: Rails: How many devices are reporting a false, stuck signal (e.g., pinned at 255 LQI or -128 RSSI for 3+ days).
- Signal: Weak: How many devices are currently reporting a signal significantly worse than their own historical normal. This is live: devices appear here while struggling and drop off the moment they recover.
3. Coordinator, Broker and Network Health
When a coordinator or broker stops, every device behind it goes quiet at once. These sensors tell you when a coordinator, broker or network has failed, rather than blaming the individual devices. The Bridge and Broker Sensors covers each one in full.
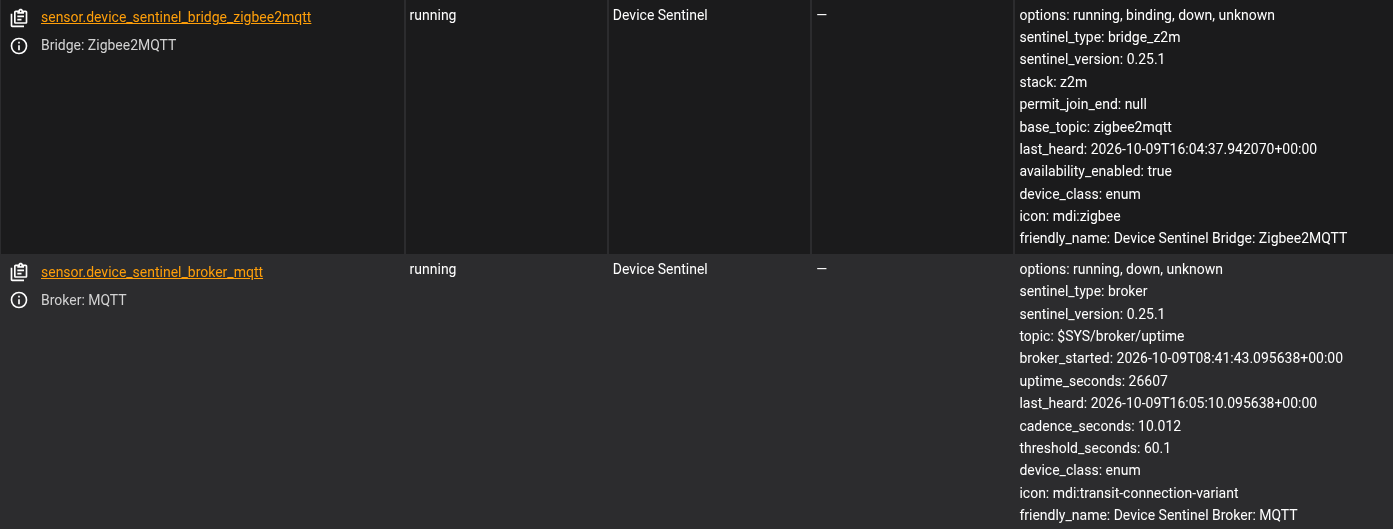
- Bridge: Zigbee2MQTT / Bridge: ZHA: Reads
running,down, orunknown.down: The coordinator has stopped. Freeze verdicts for its devices are paused, and you will receive one notification naming the coordinator rather than dozens of alerts for the devices behind it.binding(Z2M only): A pairing window is open. Any device that returns during this state is treated as a manual re-pair, and its silence is discarded rather than learned.
- Bridge: WiFi: Reads
runningordown. Exists only if WiFi outage watching is configured. - Broker: MQTT: Reads
running,down, orunknown. Because a bridge cannot report that its own transport has failed, the broker is monitored separately. A broker outage outranks a bridge outage.
4. Diagnostic Sensors
These sensors count what Device Sentinel watches, learns and sets aside. They are disabled by default as they answer questions you usually only ask when troubleshooting.
Device Counts
- Devices: Watched: The total number of devices currently being observed and learned.
- Devices: Learned: How many devices have successfully established a reporting rhythm (enough days to be judged for a freeze). This will always be lower than Watched, as button-remotes with no heartbeat never establish a rhythm.
- Devices: Set Aside: Devices that Device Sentinel is deliberately ignoring (e.g., cloud services, disabled devices, clones of hardware another integration already watches, or integrations you added to the Exclude list).
The diagnostics download from this page also records how long each coordinator, the MQTT broker and each integration took to load after the last restart, which shows whether something was slow to start or down.