4. Pressure Logger Calibration - sunny-day-flooding-project/tutorials_v1 GitHub Wiki
Table of Contents
- Tutorial Overview
- Equipment
- Hardware Setup
- Experiment Setup
- Conduct Calibration
- Analyze Data
- Input Data into Spreadsheet
Tutorial Overview
The pressure transducers used in the SuDS can be sensitive to temperature. Each pressure transducer is calibrated to determine how pressure readings vary with a range of temperatures. This step occurs after the pressure logger has been constructed and the settings have been configured. Before calibrating, it is recommended that you read through this entire document to prevent having to repeat the experiment for optimal results. Furthermore, make sure the pressure logger is set to the right settings (especially sampling frequency) as outlined in the Pressure Logger Setup.
Equipment List
- Jumper shunt, to reconnect the MEAS Jumper on the OLA
- USB-A to USB-C cable, to connect the OLA to the computer
- 90 degree USB-C Male to Female Adapter, to better attach the USB-A to USB-C cable to the OLA
- 2 separate containers, with at least one having a depth of 30cm or more
- Ice, for the ice water
- Stopwatch/ clock, to tell time when conducting experiment
- SD Card reader, to read the micro-SD card on your computer (might not be needed depending on your device)
Hardware Setup
Configure the OLA
- Connect the OLA to your computer using a Jumper shunt and USB cable. Before connecting to the pressure logger to the computer, review the Pressure Logger Precautions about the MEAS Jumper and battery pack.
- Access the terminal (Putty or SecureCRT) and make sure the correct OLA settings are being used for the calibration. As outlined in the Pressure Logger Setup, the only setting that needs to be set specifically for calibration is in Menu 1.
- Connect the pressure transducer to the other end of the QWIIC board while the OLA is still connected to the computer
- Manually boot the OLA (press button on the board)
- Reestablish connection to terminal on your computer
- When opening the terminal, make sure the program recognizes that the Pressure Transducer is attached
- Configure the OLA settings in Menu 6.1 to generate data
- Disconnect from the computer and power the OLA with the battery pack again. Before inserting the battery pack, review the Pressure Logger Precautions about the MEAS Jumper and battery pack in order to avoid frying the electronic boards.
PVC Housing
- Check the PVC Housing made during the Pressure Logger Construction. This test must be done after the PVC housing has been fully built. The PVC Housings should be watertight and sealed. Otherwise, water will leak into the PVC housing and damage the electronics.
- Mark the depth measurement locations on the PVC for calibration
- Decide on a maximum calibration depth, depending on the depth of your container. Our maximum depth is 30 cm.
- Measure the incremental distance from the bottom of the pressure transducer up the ½” PVC pipe. We do increments of 10 cm.
Experiment Setup
- Fill one container with room temperature water.
- This container will need to accommodate the your maximum calibration depth. Thus, our container for room temperature water has a depth greater than 30 cm.
- Fill one container with a ice cold water ("ice water").
- Have a running stop watch by your side so that you know when to change containers and incrementally change depth of sensor in the container with room temperature water.
Conduct Calibration
- If you are not immediately analyzing the data, record the following which will be needed later for the calibration spreadsheet:
- Atmospheric pressure (mbar). If a gauge is not present in the experimental setting, then search online for the atmospheric pressure in your region.
- Maximum calibration depth (cm)
- Check the hardware setup of the pressure logger for the following:
- Pressure transducer is connected to the QWIIC board
- Micro-SD card is inserted into the OLA
- Power on the OLA via the power button.
- Perform the following procedure with submerging the pressure transducer in the containers. Throughout this process, make sure the pressure transducer never touches the bottom of the containers, as it will impact readings. Furthermore, make sure the electronic boards (OLA and BLE) do not fall or get wet.
- Hold the pressure transducer in the ice water for 5 minutes so the temperature stabilizes.
- Transfer the Pressure Transducer to the room temperature water. Submerge to the maximum calibration depth for 5 minutes.
- Incrementally reduce the water depth based on the incremental markings you made on the PVC pipe. Hold at each depth for 1 minute.
- After conducting the experiment, turn the OLA off and on again to cycle power. Doing so will save the calibration data on the MicroSD card.
Analyze Data
- Disconnect the OLA from the battery pack and remove the microSD card from the OLA board.
- Use a microSD to SD card converter to plug the microSD into your computer.
- Locate the files on the microSD card. All the file types are as follows:
- dataLog.txt files
- serialLog.txt files
- OLA_settings.txt and OLA_deviceSettings.txt files (i.e., the settings you used during the calibration).
- Look through the dataLog files and select the one that has all of the calibration data.
- Every time the OLA is rebooted, it creates a new dataLog file. Thus, if the OLA was rebooted many times, you will have many dataLog files. It is likely that one of the last dataLog files is the one you are looking for.
- Don't delete any of these dataLog files until you input data into the calibration spreadsheet and are sure which dataLog file contains your data from the calibration.
- Create a new folder for the calibration data for this pressure transducer. Include copies of the following files.
- Template Calibration Spreadsheet
- dataLog file
- OLA_settings.txt files and OLA_deviceSettings.txt files
Chosen dataLog File
If you configured the OLA correctly, the variables that should be reported in this log file include:
- rtcDate – date measurement was taken if properly setup (MM/DD/YY)
- rtcTime – time measurement was taken (HH:MM:SS)
- VIN - volts
- aX, aY, aZ
- imu_degC – temperature of the OLA
- mbar – measured pressure
- degC – measured temperature in degree Celsius
- count – observation number
Example of a dataLog file with correct format and reasonable data
If the data you collected does not match this, it is probably fine as long as the pressure and temperature readings make sense. You do not need to redo the calibration experiment. The template calibration spreadsheet expects the inputs in the order of those shown above. Thus, you might have to work with your data more to make sure the correct data is being selected. However, you will have to adjust your OLA settings prior to deployment so that you are collecting all the data listed above.
Input Data into Spreadsheet
There are 3 sheets in the Calibration Spreadsheet:
- Raw Data
- TempCorrection
- Plots
Raw Data sheet
Import the data from the dataLog.txt file pulled from the OLA microSD card into this sheet.
Example of Raw Data in the Calibration Spreadsheet with correct format
TempCorrection sheet
-
Input the date, team member initials, pressure transducer ID, and if the calibration was performed indoors or outdoors
-
Input atmospheric pressure and calibration depth. The spreadsheet will calculate:
Water Pressure (mbar) at Max Calibration Depth = Calibration Depth (cm) * 0.981 mbar/cm
Total Pressure (mbar) at Max Calibration Depth = Water Pressure (mbar) at Max Calibration Depth + Atmospheric Pressure (mbar)
-
Re-select/drag/link or copy the (1) raw pressure and (2) raw temperature data from the 'Raw Data sheet' into the blue columns on the right.
- Common issues with this step include the data counts being different (longer/shorter) than the template, and the columns of the raw data not matching what is currently linked. If this problem occurs, try inputting the data again and make sure you are selecting the right column.

Copying Raw Data from 'Raw Data' sheet to 'TempCorrection' sheet
- Analyze the Raw Pressure Readings (mbar) plot and Raw Temperature Readings (deg C) plot to select the data from the 5 minutes that the pressure transducer was held at in the room temperature water at maximum calibration depth. This portion of data is what we want to make a linear regression for and shows the pressure transducer warming from being previously submerged in ice water.
- Hover with your mouse over the plot to figure out what point in the series it is. Reference the picture below.
- Record the row start/end of the selected data so you don't forget.
Analyzing raw data to find the data from the 5 minutes the pressure was submerged at maximum calibration depth in room temperature water
- Adjust the axes and selected data of the Pressure Transducer Temperature Correction plot so that is reading in the rows of data determined in the step before (e.g., 241 to 409).
- The selected data should show a relationship between pressure and temperature that is approximately linear. If not, make sure that you have removed outliers within the selected data and make sure you have chosen the right number of rows for this data set. If the R2 is < 0.90, consider re-running the experiment to get a better fit.
Example of a Pressure Transducer Temperature Correction plot that has an appropriate linear regression and R-value
-
Using the equation constants from the linear regression equation generated on the Pressure Transducer Temperature plot, input the values for the slop and intercept. The spreadsheet will then calculate the sensor offset. The values for the slope and sensor offset will be used as input into the Raspberry Pi later.
Raw Pressure (mbar) = Slope (mbar/deg C) * Raw Temperature (deg C) + Intercept (mbar)
-
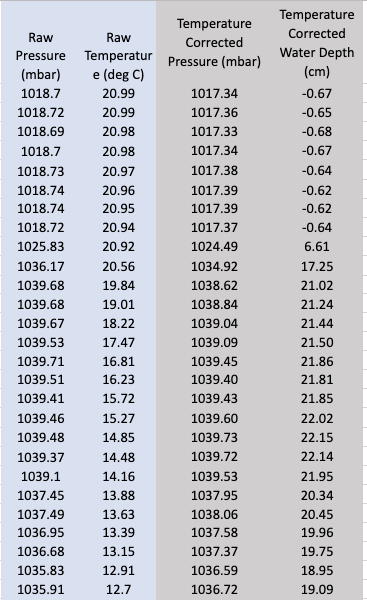
Using the equations below, the spreadsheet calculates the temperature corrected pressure and depth. Make sure that the GRAY columns of the corrected Temperature and Water Depth (on the right side) are calculating across the correct cells (e.g., length of the data varies). This data is plotted on the Plots sheet.
Temperature Corrected Pressure (mbar) = Raw Pressure – (Intercept – Total Pressure at Max Calibration Depth) – Slope* Raw Temperature
Temperature Corrected Water Depth (cm) = (Temperature Corrected Pressure -Atmospheric Pressure) / Density of Water
Plots sheet
Use these plots to make sure the calibration results make sense (e.g., are the measured water depths as expected).
Example plots that show the correct trends for water depth and pressure, respectively. These plots reflect that the pressure transducer was first submerged in ice water for five minutes, submerged in room temperature water at a maximum calibration depth of 40 cm for five minutes, and then submerged at depths of 20, 30, and 40 cm for approximately 30 second intervals.