Single Cell Visualization - STAR-Fusion/STAR-Fusion GitHub Wiki
Results from running STAR-Fusion on single cell data can be viewed with cirrocumulus.
Cirrocumulus can simultaneously view fusions and single-cell data processed with popular tools such as Seurat, Scanpy, or Cumulus.
pip install cirrocumulus
Launch cirrocumulus from the command line using the command cirro launch <dataset>... where dataset can be an h5ad, loom, a Seurat object, or fusion_predictions_deconvolved tsv file. For example:
cirro launch /data/test_samples_fusion_predictions_samples_deconvolved.tsv,/data/test_samples.h5ad.
- fusion_predictions_deconvolved.tsv generated by STAR-Fusion
- h5ad
- loom
- Seurat object
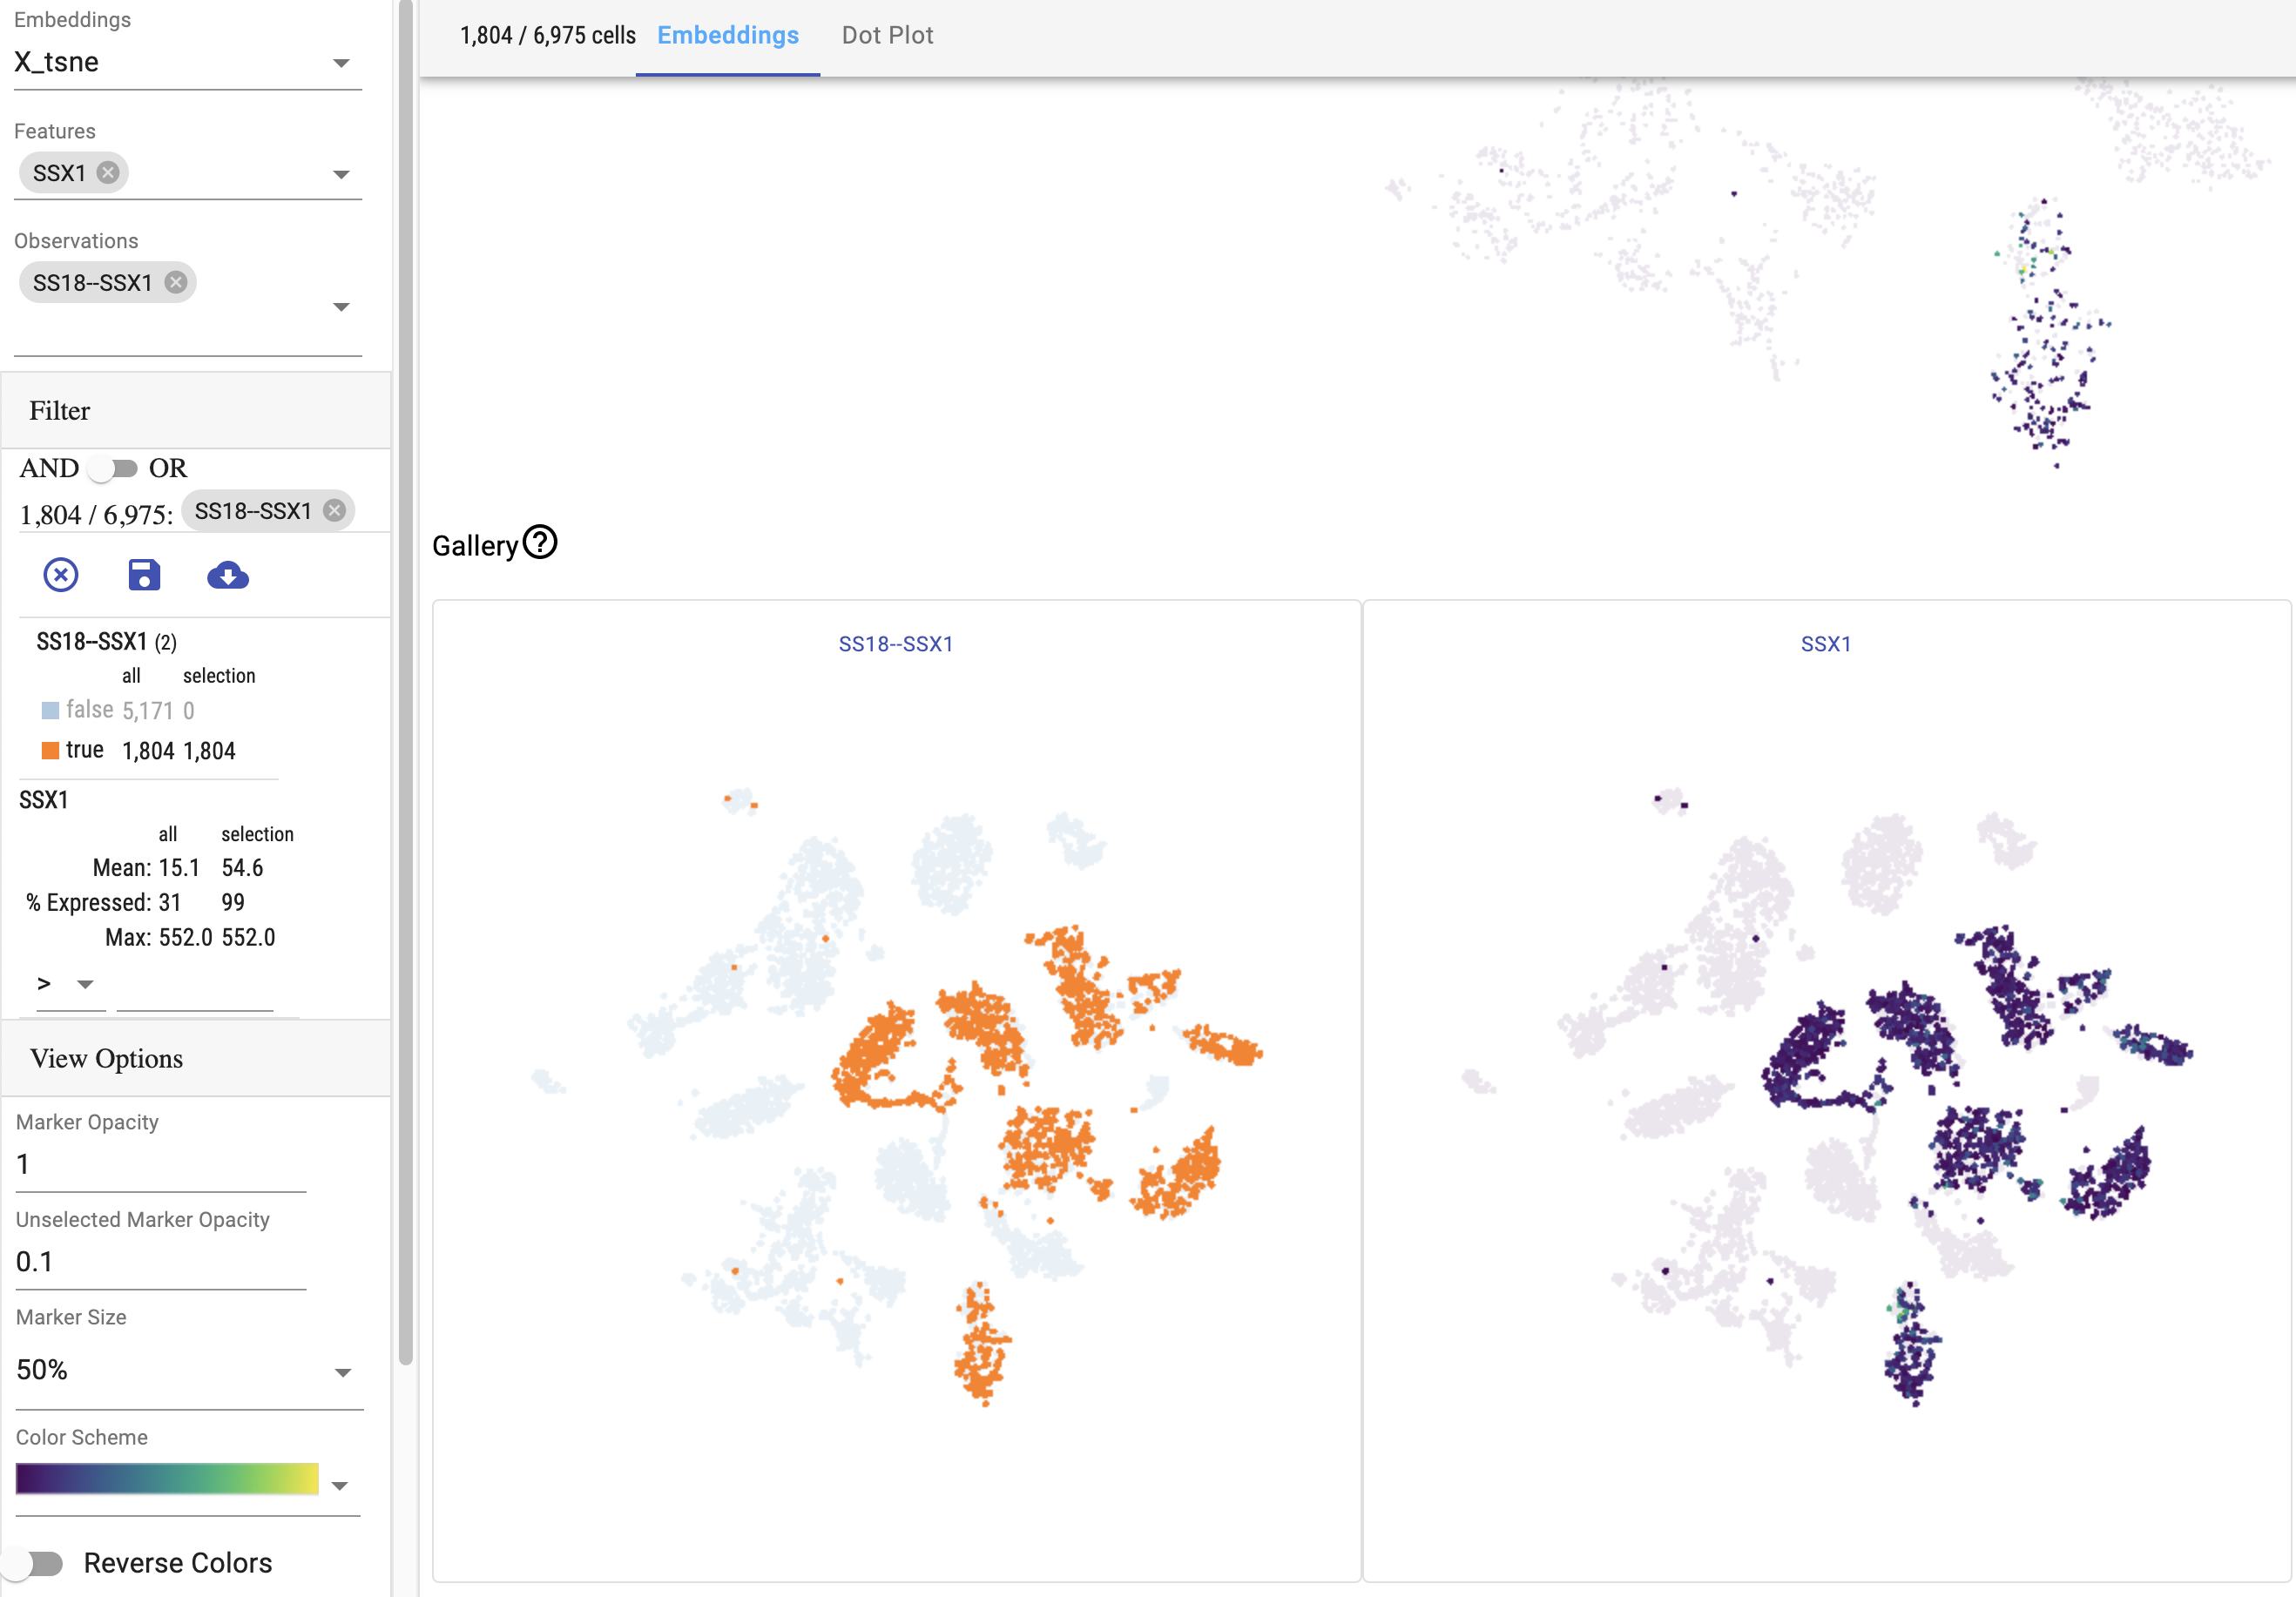
This figure shows the fusion SS18--SSX1 and scRNA-seq data for the gene SSX1 generated using a TSNE embedding. Cells with the fusion are highlighted.
- Install Pegasus via pip:
pip3 install pegasuspy - Run pegasus cluster with your count matrix as input to normalize, filter, cluster, and generate embeddings:
pegasus cluster --louvain --tsne test_dge.txt.gz test.h5ad.
More in-depth scRNA-seq tutorials are available using Seurat, Scanpy, and Pegasus