catalase lab - MetabolicEngineeringGroupCBMA/MetabolicEngineeringGroupCBMA.github.io GitHub Wiki
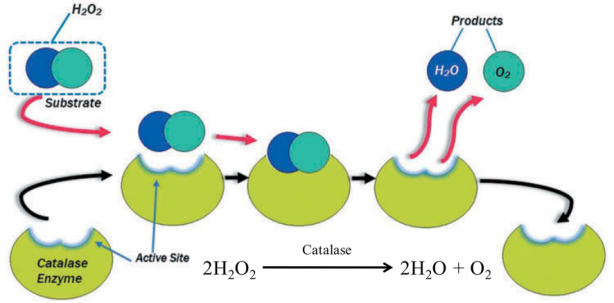
Catalase is an enzyme that catalyzes the breakdown of hydrogen peroxide to water and oxygen.

Figure 1
The aim of this practical class is to measure the activity of catalase in permeabilized Saccharomyces cerevisiae yeast cells.
Acyl-CoA oxidase is the first enzyme in the peroxisomal β-oxidation pathway, responsible for catalyzing the oxidation of acyl-CoA, a process that breaks down fatty acids.

Figure 2
Unlike in mitochondria, where FADH₂ would enter the electron transport chain, peroxisomal FADH₂ directly donates its electrons to molecular oxygen, leading to the formation of hydrogen peroxide (H₂O₂) instead (Figure 2). This step is unique to peroxisomal β-oxidation since, in mitochondria, electron carriers like FADH₂ contribute to ATP synthesis through oxidative phosphorylation. In peroxisomes, however, FADH₂ is quickly oxidized back to FAD, enabling continuous fatty acid oxidation but producing H₂O₂ as a byproduct instead of ATP.

Figure 3
Complex I and III can inadvertently leak electrons to molecular oxygen (Figure 3), forming superoxide. The superoxide anion (O₂⁻•) generated in Complex I and III of the mitochondrial electron transport chain is detoxified primarily by the enzyme superoxide dismutase (SOD).

Figure 4
NOX1 and NOX2 are enzymes that belong to the NADPH oxidase (NOX) family, which play crucial roles in producing reactive oxygen species (ROS) as part of cell signaling and immune responses (Figure 4). Unlike mitochondrial ROS generation, these enzymes generate ROS directly at the cell membrane or within specific cellular compartments.
- Location: Primarily expressed in epithelial cells, including those in the colon and vascular smooth muscle cells.
- Function: NOX1 generates superoxide (O₂⁻•), which can be converted into other ROS, such as hydrogen peroxide (H₂O₂).
- Role in Cellular Function: Involved in cell signaling related to cell proliferation, migration, and immune responses. NOX1 is also implicated in vascular remodeling, inflammatory responses, and some forms of cancer progression, where ROS play a role in cell growth signaling.
- Location: Most well-known for its role in phagocytic cells (like neutrophils and macrophages), but it is also expressed in other cell types.
- Function: NOX2 is crucial for the immune response, as it produces superoxide in phagosomes to destroy ingested pathogens. Superoxide generated by NOX2 contributes to the “respiratory burst,” a rapid release of ROS that kills bacteria and other pathogens.
- Role in Host Defense: NOX2-derived ROS are critical in antimicrobial defense. Inherited defects in NOX2 lead to impaired ability to fight off infections.

Figure 5
Glutathione (GSH) removes hydrogen peroxide (H₂O₂) through an enzymatic reaction involving glutathione peroxidase (GPx) (Figure 5). This enzyme catalyzes the reduction of H₂O₂ to water, using glutathione as the electron donor.
- Reduction of Hydrogen Peroxide: Glutathione peroxidase uses two molecules of reduced glutathione (GSH) to convert hydrogen peroxide into water. GSH is oxidized to form glutathione disulfide (GSSG).
- Regeneration of Glutathione: To maintain a steady supply of reduced glutathione (GSH), glutathione reductase (GR) recycles GSSG back to GSH using NADPH as a reducing agent:
Figure 6
The catalase test is a simple biochemical assay used to identify organisms capable of producing the enzyme catalase. All known aerobic microorganisms produce catalase. In the test (Figure 6), a small amount of bacterial culture is exposed to hydrogen peroxide, and the presence of bubbles indicates a positive result, signifying catalase activity. This test is commonly used to differentiate between catalase-positive organisms, like Staphylococcus spp., and catalase-negative organisms, such as Streptococcus spp. in clinical microbiology.
The protocol is based on a combination of a method for preparing permeabilized yeast cells with ethanol described by Trawczyńska & Wójcik 2015 and an assay for peroxide using cobalt ions described by Hadwan 2018.
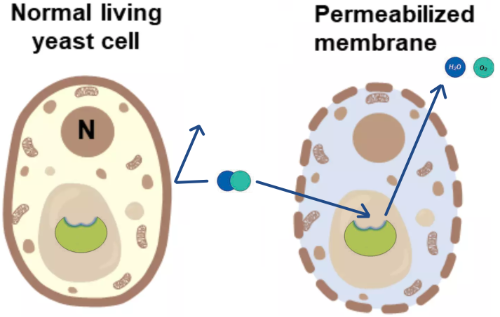
After the cells have been permeabilized, substrate such as H2O2 can more easily reach the catalase enzyme and the products (H2O and O2) can more easily leave (Figure 7).

Figure 7
The permeabilization protocol is very simple. The yeast cells are incubated with ethanol for 20 min in a phosphate buffer.
Permeabilized yeast cells are mixed with hydrogen peroxide and incubated for 10 min at 37°C. During this time some of the hydrogen peroxide is consumed by catalase and broken down to oxygen and water.
The remaining peroxide is measured by allowing the hydrogen peroxide to oxidize cobalt(II) to cobalt(III) which can be measured with a spectrophotometer at 440 nm (Figure 8). The oxidation is performed in the presence of carbonate ions which causes a pink complex with cobalt(II) and a green complex with cobalt(III).
 Figure 8
Streak the two strains below on solid YPD medium and incubate at 30 °C for ~48 h.
| Strain number | Strain designation | Plasmid vector | box | pos | |
|---|---|---|---|---|---|
| µ1886 | CENPK111-32D | pTA1 | empty vector | Björn12 | 35 |
| µ1885 | " | pTA1_TDH3_ScCTT1_PGI1 | CTT1 expression vector | "" | 34 |
Inoculate two 50 mL glass tubes os small Erlenmeyers with ~5 mL of SD medium and incubate at 30 °C with shaking for ~48 h. Label the tubes 1885 and 1886, respectively. These cultures can be kept at 4-8°C in a fridge for for ~3-4 weeks.
This should be done in the morning the day before the class. Inoculate two 50 mL glass tubes with 5 mL of the same medium using 100 µL of each pre-culture. Label the tubes with 1885 and 1886.
Prepare 10 mL Hydrogen peroxide solution (10 mM) by adding 12 µL of 30% hydrogen peroxide to 10 ml of 50 mM phosphate buffer (pH 7.0). Pour ~1 mL of the Hydrogen peroxide solution in four Eppendorf tubes, one for each group.
Measure the optical density (OD) at 640 nm for the cultures. Add fresh medium to the culture with the higher OD in order to set the two cultures to the same optical density.
Prepare 50 mL Working solution. The order in which these components are added is important:
- 2.5 ml of cobalt (II) solution (3 x 834 µL)
- 2.5 ml of Graham salt solution (3 x 834 µL)
- 45 ml of sodium bicarbonate solution. (Fill x 834 µL)
Pour 5-10 mL of working solution into four 50 mL FALCON tubes, one for each group. This solution should be stored at room temperature in the dark.
| Group | Strain number | Strain designation | Plasmid vector |
|---|---|---|---|
| 1 | µ1886 | CENPK111-32D | pTA1 (empty vector) |
| 2 | " | " | " |
| 3 | µ1885 | " | pTA1_TDH3_ScCTT1_PGI1 |
| 4 | " | " | " |
- Each group (G1, G2, G3 and G4) should take out 1 mL of the culture indicated in the table above in an empty 1.5 mL Eppendorf tube.
- Centrifuge 🌀 the culture for 20 s in a microcentrifuge.
- Remove supernatant with a P1000 pipette.
- Add 1 mL 5 mM phosphate buffer.
- Resuspend cells by pipetting up&down with the same tip.
- Centrifuge 🌀 culture for 20 s.
- Remove supernatant.
- Add 1 mL 5 mM phosphate buffer.
- Resuspend cells.
- Transfer 100 µL of the cells to a new Eppendorf tube.
- Add 400 µL dH2O.
- Add 500 µL absolute ethanol.
- Mix the content of the tube by vortexing for ~30s.
- Incubate for 20 min @ room temperature on the bench.
- Mark nine empty Eppendorf tubes with a marker, Sa, Sb, Sc, T1a, T1b, T1c, T2a, T2b, and T2c
- Mark nine empty plastic cuvettes in the same way.
- ☕ break until cells are ready. The timing is not critical.
- Add the components in the table to the marked tubes. Volumes are indicated in micro liters (µL). Prepare the tubes in the indicated order top to bottom, add components in the indicated order, left to right. Remember that after the addition of Peroxide, the reaction starts, so make this addition rapidly for all tubes.
| Label | Sample | Water | Cells | Peroxide | Total |
|---|---|---|---|---|---|
| Sa | Standard | 70 | 0 | 140 | 210 |
| Sb | Standard | 70 | 0 | 140 | 210 |
| Sc | Standard | 70 | 0 | 140 | 210 |
| T1a | Test 1a | 0 | 70 | 140 | 210 |
| T1b | Test 1b | 0 | 70 | 140 | 210 |
| T1c | Test 1c | 0 | 70 | 140 | 210 |
| T2a | Test 2a | 35 | 35 | 140 | 210 |
| T2b | Test 2b | 35 | 35 | 140 | 210 |
| T2c | Test 2c | 35 | 35 | 140 | 210 |
- Incubate Eppendorf tubes at 🌡️37 °C in a water bath 🛁 for 10 min. ⏱️ This timing is critical!
- Add 800 µL working solution to each tube.
- Mix by inversion.
- Incubate at room temperature for at least 10 min in the dark 🌙. You can put the tubes in one of the empty drawers in the lab.
- Centrifuge 🌀 for 20 s at top speed.
- Transfer supernatants to the cuvettes with the same marking. Take a picture 📷 of the cuvettes with your phone, upload to Google photos
 .
. - Record the absorbance for each cuvette at 440 nm against air. Position the cuvette as per the instructions for the GENESYS20 spectrophotometer.
- Add the data to the Google Spreadsheet
 .
.
This practical class was based on a combination of methods described in the two publications below:
Trawczyńska, I., & Wójcik, M. (2015). Optimization of permeabilization process of yeast cells for catalase activity using response surface methodology. Biotechnology, Biotechnological Equipment, 29(1), 72–77. link
Hadwan, M. H. (2018). Simple spectrophotometric assay for measuring catalase activity in biological tissues. BMC Biochemistry, 19(1), 7. link
Kaplan, J. G. (1963). THE REVERSION OF CATALASE DURING GROWTH OF YEAST IN ANAEROBIOSIS. The Journal of General Physiology, 47, 103–115. link
Martins, D., & English, A. M. (2014). Catalase activity is stimulated by H(2)O(2) in rich culture medium and is required for H(2)O(2) resistance and adaptation in yeast. Redox Biology, 2, 308–313. link
All absorbance values are taken with a spectrophotometer calibrated against air without a cuvette (Figure 10).
The Standard reaction in Figure 9 contains only hydrogen peroxide and and cobalt(II) carbonate. All of the available peroxide should oxidize cobalt(II) to cobalt(III). The Test reactions contain H2O2 and cells. Some of the peroxide should have been consumed by the catalase in the cells, so the absorbance value at 440 nm should be lower than for the Standard reaction.

Figure 9
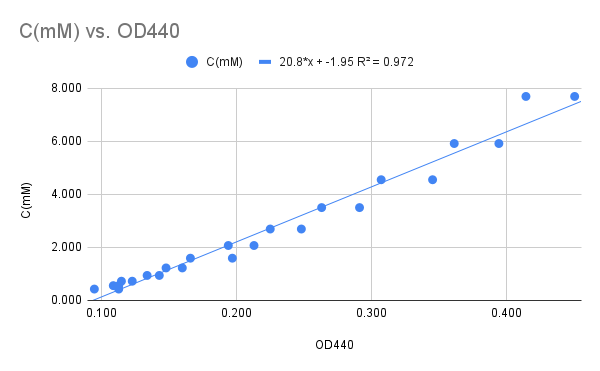
We use a standard curve (Figure 10) to calculate the actual concentration of the samples. The activity is then calculated from the concentration difference between the Standard and the sample divided by the reaction time.
 Figure 10
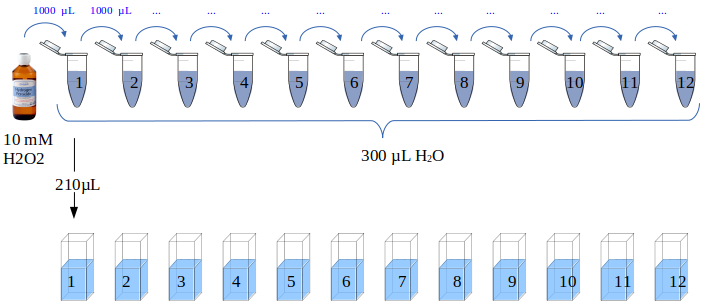
A 10 mM hydrogen peroxide solution was serially diluted (Figure 11) by first preparing twelve Eppendorf tubes with 300 µL of ddH2O. One milliliter hydrogen peroxide was transferred to the first tube, the contents were mixed by pipetting up and down 5-6 times followed by transferring 1 mL to the next tube. This means that the last tube (12) eventually had a final volume of 1.3 ,L while all preceding tubes had 300 µL.
The hydrogen peroxide concentration in the first tube is 1 mL * 10 mM/1.3 mL = 7.6923 mM. The dilution factor is the same for all tubes (1/1.3) so the concentration of each tube can be calculated using the formula

Figure 11
Cuvettes with 210 µL of each dilution were prepared, twelve in total. Working solution (800 µL) (Series#1 and #2 below, Figure 12) was added to each cuvette followed by 10 min incubation at room temperature under darkness. Two replicates were prepared and the absorbance at 440 nm was measured with a GENESYS20 spectrophotometer.


Figure 12
The absorbance readings were collected in the table below.
| Tube | Concentration (mM) | Series#1 | Series#2 |
|---|---|---|---|
| 1 | 7.692 | 0.450 | 0.414 |
| 2 | 5.917 | 0.394 | 0.361 |
| 3 | 4.551 | 0.345 | 0.307 |
| 4 | 3.501 | 0.291 | 0.263 |
| 5 | 2.693 | 0.248 | 0.225 |
| 6 | 2.072 | 0.213 | 0.194 |
| 7 | 1.594 | 0.197 | 0.166 |
| 8 | 1.226 | 0.160 | 0.148 |
| 9 | 0.943 | 0.143 | 0.134 |
| 10 | 0.725 | 0.123 | 0.115 |
| 11 | 0.558 | 0.109 | 0.113 |
| 12 | 0.429 | 0.113 | 0.095 |
The average absorbance was plotted against the hydrogen peroxide concentration resulting in a reasonably linear relationship (Figure 10). The graph follows the linear relationship between Concentration (mM) and A440:
At this point, we have absorbance change or ∆A per 10 min. What we want is µmol / min which is the definition of the classical unit.
The protocol specifies two experiments (Figure 6), Test1 and Test2, where the latter contain half as much cells. If the assay is linear, Test1 should produce twice the absorbance compared to Test2.

Figure 13
dH2O 4 x 40 mL
- 6.7 g/L Yeast Nitrogen Base (YNB) WITHOUT AMINO ACIDS
- 20 g/L glucose
10 x 50 mL glass culture tubes with cotton stopper or aluminium cap
25 mL Ethanol 95-99% (2 courses * 3 shifts * 4 groups * 0.5 mL = 12 mL)
Six empty new FALCON tubes 50 mL
This buffer can be prepared by by mixing two solutions in ultrapure water:
- 100 mL 6.81 g/L KH2PO4
- 100 mL 8.90 g/L K2HPO4
300 mL Sodium bicarbonate (NaHCO3) solution
Prepared by dissolving 24 g (MW 84.01 g/mol) in 300 ml ultrapure water. This solution should be stored at room temperature.
Prepared by dissolving 0.51 g of Co(NO3)2 x 6H2O in 25 ml of distilled water. This solution should be stored at room temperature in the dark.
Prepared by dissolving 0.25 g of (NaPO3)6 in 25 ml of distilled water. This solution should be stored at room temperature.
- Eppendorf tubes 1.5 mL (new, not sterile)
- Blue tips
- Yellow tips
- Plastic cuvettes
- 37 °C water bath
- boat for cuvettes
- microcentrifuge
- vortex
- P1000 pipettes
- P200 pipettes
Estriar as duas estirpes abaixo em meio sólido YPD e incubar a 30 °C por ~48 h.
| Número da Estirpe | Designação da Estirpe | Vetor Plasmídeo | caixa | pos | |
|---|---|---|---|---|---|
| µ1886 | CENPK111-32D | pTA1 | vetor vazio | Björn12 | 35 |
| µ1885 | " | pTA1_TDH3_ScCTT1_PGI1 | vetor de expressão CTT1 | "" | 34 |
Inocular dois tubos de vidro de 50 mL com ~5 mL de meio SD e incubar a 30 °C por ~48 h.
Rotular os tubos 5 e 6 para µ1885 e µ1886, respetivamente. Estas culturas podem ser mantidas a 4-8°C no frigorífico durante ~3-4 semanas.
Esta etapa deve ser realizada na manhã do dia anterior à aula. Inocular dois tubos de vidro de 50 mL com 5-10 mL do mesmo meio usando 100 µL de cada pré-cultura. Rotular os tubos com 5 ou 6.
- 6,7 g/L de Base de Nitrogénio de Levedura (YNB) SEM AMINOÁCIDOS
- 20 g/L de glicose
10 x 50 mL tubos de cultura de vidro com rolha de algodão ou tampa de alumínio
25 mL de Etanol 95-99% (2 cursos * 3 turnos * 4 grupos * 0,5 mL = 12 mL)
Seis tubos FALCON novos e vazios de 50 mL
Este tampão pode ser preparado misturando duas soluções em água ultrapura:
- 100 mL de 6,81 g/L de KH2PO4
- 150 mL de 8,90 g/L de Na2HPO4
300 mL de solução de Bicarbonato de Sódio (NaHCO3)
Preparada dissolvendo 24 g (PM 84,01 g/mol) em 300 mL de água ultrapura. Esta solução deve ser armazenada à temperatura ambiente.
Preparada dissolvendo 0,51 g de Co(NO3)2 x 6H2O em 25 mL de água destilada. Esta solução deve ser armazenada à temperatura ambiente no escuro.
Preparada dissolvendo 0,25 g de (NaPO3)6 em 25 mL de água destilada. Esta solução deve ser armazenada à temperatura ambiente.
- Tubos Eppendorf de 1,5 mL (novos, não estéreis)
- Pontas azuis
- Pontas amarelas
- Cuvetes de plástico
- Banho-maria a 37 °C
- Barcos para tubos
- Microcentrífuga
- Vórtex
- Pipetas P1000
- Pipetas P200
