Workflow - LucPrestin/Hidden-Modularity GitHub Wiki
The workflow we followed has five steps:

At first, we look at the broad features of squeak as mentioned in the scenario overview.
We pick one of them and think about a specific scenario that is part of that feature. This scenario definition includes two parts: a code segment that defines the scenario and a hypothesis of what we expect to see in the trace of that scenario.
We then use the TraceDebugger to trace that code segment.
Afterwords we parse the trace and generate a graph of what communication happened. We use different ways to construct these graphs, each with a different focus. Have a look at the analysis methods for an overview. The graphs on a data level then get exported to a json file from which we import it into a force-directed graph in order to be able to visually inspect it.
Finally, we use that graph to verify or falsify the hypotheses we proposed during the scenario definition. In Addition we explore the graph to maybe stumble upon anything else of interest. The potential insights gained through this process then get check in the squeak code to have a more detailed look at things.
Crossed System Boundaries
During that process we cross several system borders. For the time being it is okay because it allowed us to continue the work on gaining insights but it has down sights too. This lengthens the feedback look quite a lot and results in artifacts of the process being scattered across systems. This is why we see it as an important future work to get around these system borders.
Here they are:
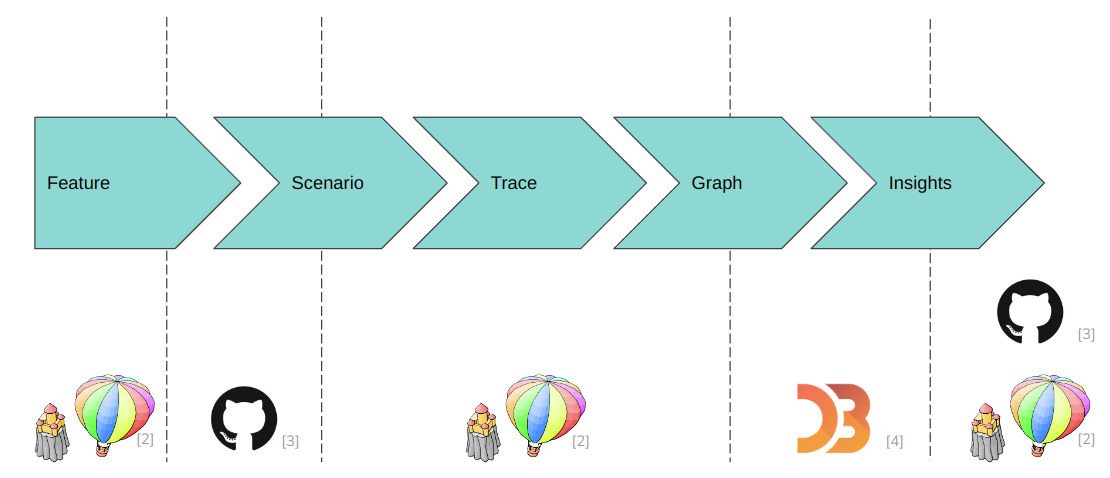
The feature is obviously part of squeak but at the same time, the list of features is documented in this wiki (have a look at the scenarios page).
The scenario is documented in this wiki, but the code is ultimately written in squeak because it needs to be executed there.
The tracing is done completely in squeak.
Generating the graphs from the trace is done from within squeak too. But to visualize it, we need to step out of squeak into a d3-force simulation written in JavaScript.
There we gain most of our insights. But some of them only really come forth when going back into the code and look for how the recognized patterns in the graph were created. Finally, we document all the insights in this wiki.
Example
So, how does this process look in concrete terms? Here is an example for the scenario fetching the google website (with content access):
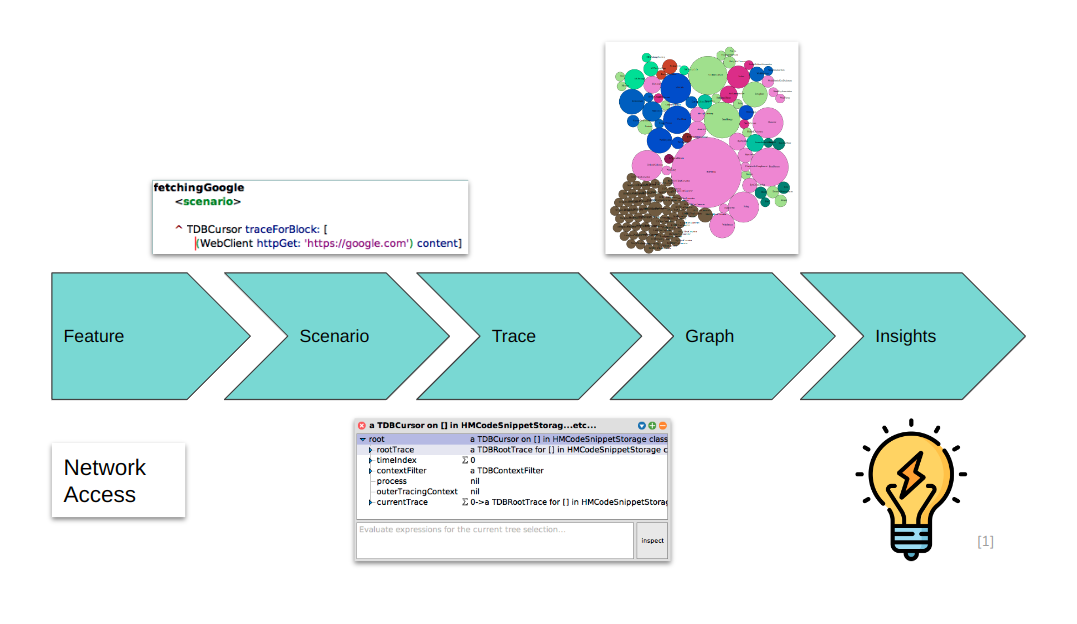
We chose to look into network access by tracing an http-get request that we send to google's main website. Then we extract a graph from it and visualize it. Then, insights follow. For more detail on this scenario, have a look at its detail page.
- https://cdn-icons-png.flaticon.com/512/2779/2779262.png last access: 2022-08-07 22:02
- https://squeak.de/static/img/balloon.svg last access: 2022-08-08 20:26
- https://github.githubassets.com/images/modules/logos_page/GitHub-Mark.png last access: 2022-08-08 20:27
- https://raw.githubusercontent.com/d3/d3-logo/master/d3.png last access: 2022-08-08 20:27