Results and Discussion - HNHalstead/Genome_Analysis GitHub Wiki
Results and Discussion
DEseq2 allows for the visualization of the final results, but also shows statistics in regards to the significance of a gene (Love, 2014). The graphs below are great to visualize the overall results, but looking at the individual sorted tables is still important as that's where we see the actual genes. The statistics that were focused on were the adjusted p-value and the normalized log count of reads of a particular gene. The adjusted p-value shows the significance of change between two genes while taking into consideration the body of comparisons that are taking place at the same time. This allowed genes to be ranked by significance. It is also important to note the log fold changes as they indicate if a gene had higher reads in the serum or in the BHI medium. If a drug were to used against these bacteria instead of vancomycin, it would be more beneficial to have it interact with a gene that:
- Is transcribed at a significantly higher frequency in serum to show that is it necessary in less enriched environments.
- Targets a pathway that will not interact with human metabolic pathways.
- Targets part of one of E. faecium's metabolic pathways that vancomycin does not target as the bacteria already has a "work-around" that let's it still survive in the presence of vancomycin.
- May work against other vancomycin resistant bacteria.
After identifying genes that are of significance can then be investigated further to see their roll in E. faecium E745's metabolic pathways. The functional annotation that was done with eggNog outputs KEGG numbers with the gene names. This allows for easy visualization of such pathways(Kanehisa, 2019).
There are several ways that bacteria can intake genetic material such as with plasmids or prophage integration. Bacterial viruses are able to insert their DNA into the host and replicate as part of the host. This is important to note as other bacteria can then receive the same sequence either as a transferred plasmid or from another prophage of the same type. PHAST annotates potential regions within contigs that may be from prophages and identifies which ones are likely the cause of that sequence being in the host (Zhou, 2011).
DEseq2 Interpretation
resLFC1 <- lfcShrink(dds, coef="condition_t1_vs_control", type="apeglm")
resLFC2 <- lfcShrink(dds, coef="condition_t2_vs_control", type="apeglm")
resLFC3 <- lfcShrink(dds, coef="condition_t3_vs_control", type="apeglm")
The data frames were made into a generalized linear model. It is important to note here that the RNA reads taken from E. faecium grown in BHI were set as the control since we are interested in comparing those read counts against the RNA reads counts from E. faecium taken from human serum. The read counts taken from E.faecium grown in human serum were then labeled as t1, t2, and t3 where t is short for treatment.
res1Ordered <- res1[order(res1$padj),]
res2Ordered <- res2[order(res2$padj),]
res3Ordered <- res3[order(res3$padj),]

resLFC1Ordered <- resLFC1[order(resLFC1$padj),]
resLFC2Ordered <- resLFC2[order(resLFC2$padj),]
resLFC3Ordered <- resLFC3[order(resLFC3$padj),]
Results were ordered by adjusted p-value.
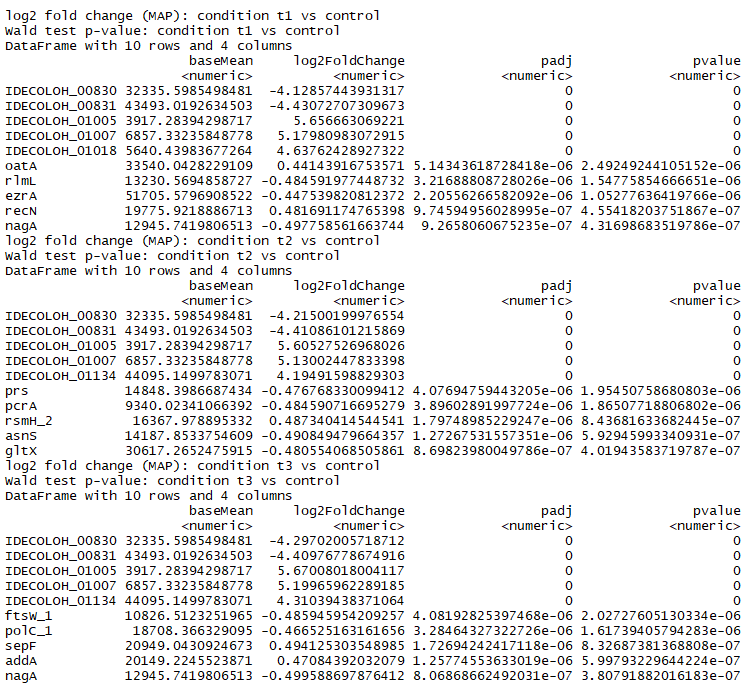
Part of the resulting table from resLFC showing the results of comparing T1 to control, T2 to control, and T3 to control. resLFC1 will give a result table of log fold changes (LFC) of T(treatment) over C (control). Here a positive LFC means T has higher counts than C. A negative LFC means T has lower counts than C. The gene names that begin with IDECOLOH are unidentified genes. These were left in the analysis as they are still important to acknowledge when normalizing and for visualizing the overall results. However as the genes were not identified, there is not much else that can be done with those genes without further testing in a lab. Therefore those genes will not be discussed further here.
In this table genes do not appear to be similar between the treatment groups as far as their log-fold changes and adjusted p-values go, but this is simply because the table is truncated for viewing. The adjusted p-values are so small that it is simply hard to visualize the similarity between the treatment groups in a table. Overall similarity can be seen in plots below.
MA Plots
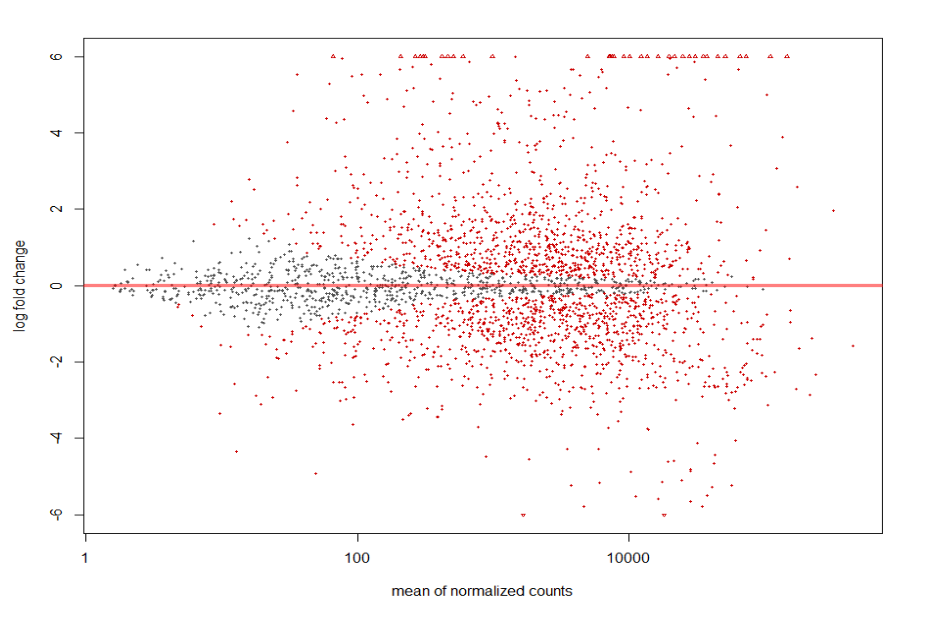
The dots in red in the following plots have p values that are less than or equal to 0.05.
MA plot of Human Serum RNA sequence run ERR1797969 (treatment group) vs BHI RNA sequence runs ERR1797972, ERR1797973, and ERR1797974 (control).
plotMA(resLFC1, ylim = c(-6, 6))
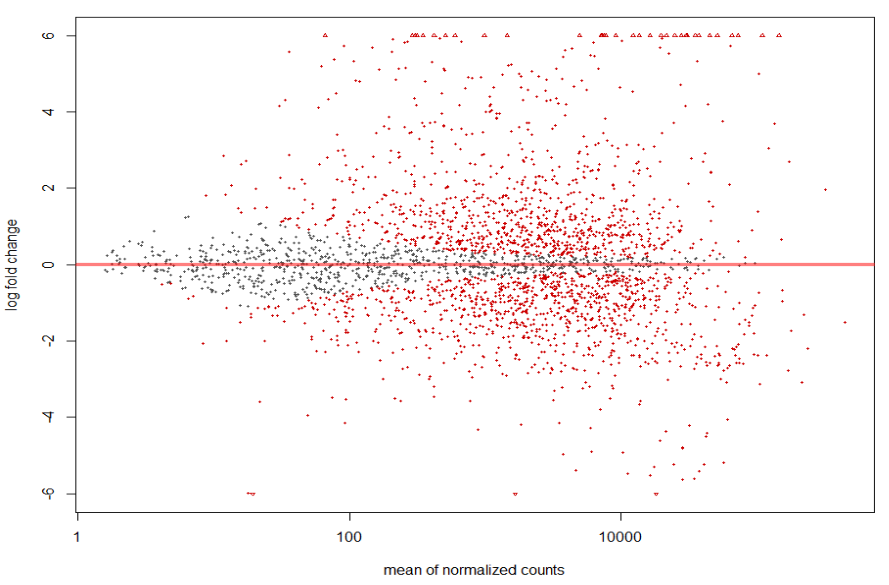
MA plot of Human Serum RNA sequence run ERR1797970 (treatment group) vs BHI RNA sequence runs ERR1797972, ERR1797973, and ERR1797974 (control).
plotMA(resLFC2, ylim = c(-6, 6))
MA plot of Human Serum RNA sequence run ERR1797971 (treatment group) vs BHI RNA sequence runs ERR1797972, ERR1797973, and ERR1797974 (control).
plotMA(resLFC3, ylim = c(-6, 6))
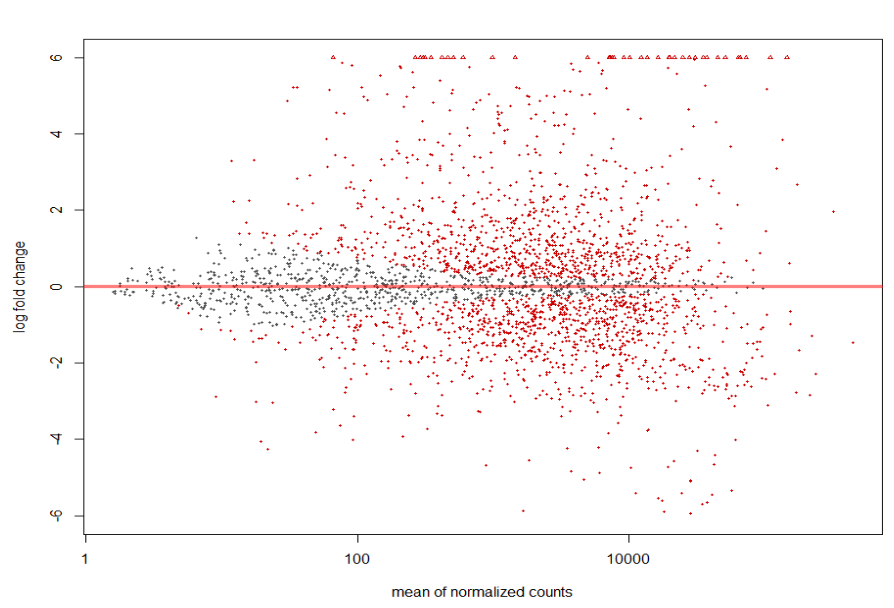
The overall result of the plots is very similar. More of the genes that were deemed significant by their p-value also had larger normalized mean counts and also had a larger log fold change in read counts when compared to the sequences that came from BHI RNA. While the shape of the data in the graphs shows the runs to be quite similar, there are still noticeable differences between runs.
PCA Plot
The PCA plot shows what percentage of variance within data can be explained by a principle component.
pca <- rlogTransformation(dds, blind=TRUE)
plotPCA(pca)
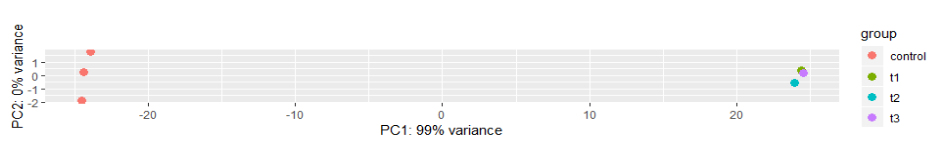 The X axis shows the principle component that is responsible for the most variance in the data. The split from the points and on the left of the graph are between the control group which was made up of BHI RNA reads and the treatment group which was made up of human serum RNA reads.
The second principle component, or cause of variation is along the y access. The reads then show variance between reads, which could have been caused by several factors such as different quality reads, unnoticed changes in conditions, etc. The control group shows more variation than the treatment group. This makes sense as the control group was group was grown in enriched conditions while the treatment group was grown in more restrictive conditions. Having more restrictive conditions means that there are less options for nutrient intake so that organisms grown in those conditions are more likely to express the same genes than those grown in an enriched environment. Those grown in an enriched environment do not have to undergo the same selective and environmental pressures to express the same set of genes and can make better use of their metabolic pathways.
KEGG Pathyway Visualization
Returning to the table in the above section, there are several genes that have:
- A positive log fold change which indicates that those genes are more highly expressed in E. faecium E745 in human serum than in BHI medium.
- A tiny adjusted p-value below 0.05 which indicates that that those genes are significantly likely to not show those log fold changes by chance.
- Been identified in functional annotation such that their pathway can be visualized.
These genes in no particular order are DNA break repair emzyme addA and recN, tRNA methylation enzyme rsmH_2, cell division inhibitor sepF, and O-acetylation of peptidoglycan enzyme oatA which makes the bacterial lysozyme resistant (Kanehisa M, 2019). Lysozyme is naturally produced by the innate immune system so this oatA is a very logical gene to be more highly expressed in human serum. Methylation in bacteria can serve many purposes, such as to mark what genetic material is its own such that it can destroy invading phages. What is most interesting though is that that two of the top genes being expressed are DNA repair enzymes. This would suggest that the DNA is being damaged and therefore is more in need of repair in the human serum than in BHI medium.
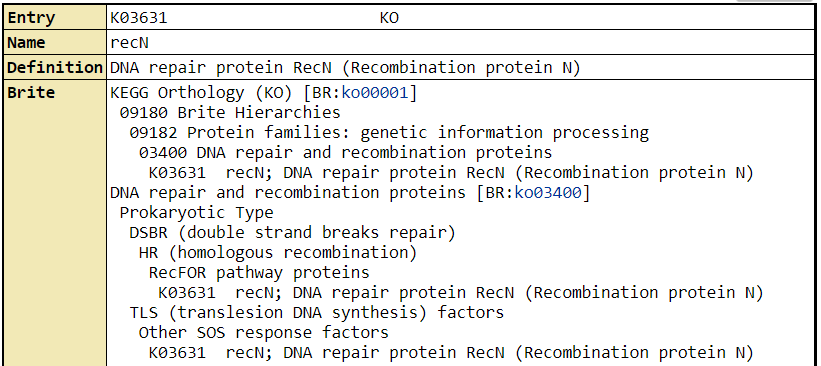
Example result shown by KEGG of recN
Prophages have been shown to be the distributing agent of antibacterial resistance genes to bacteria(Haaber, 2016). They work by integrating their genetic material into the bacteria in such a way that bacteria replicates the phage's nucleotides as if they were its own. Therefore phage integration is important to investigate for antimicrobial resistant bacteria. PHAST works to quickly identify potential regions of a bacterial genome that could have been integrated from a prophage (Zhou, 2011). Identifying the location of resistance genes in prophage regions could help identify how resistance spreads.
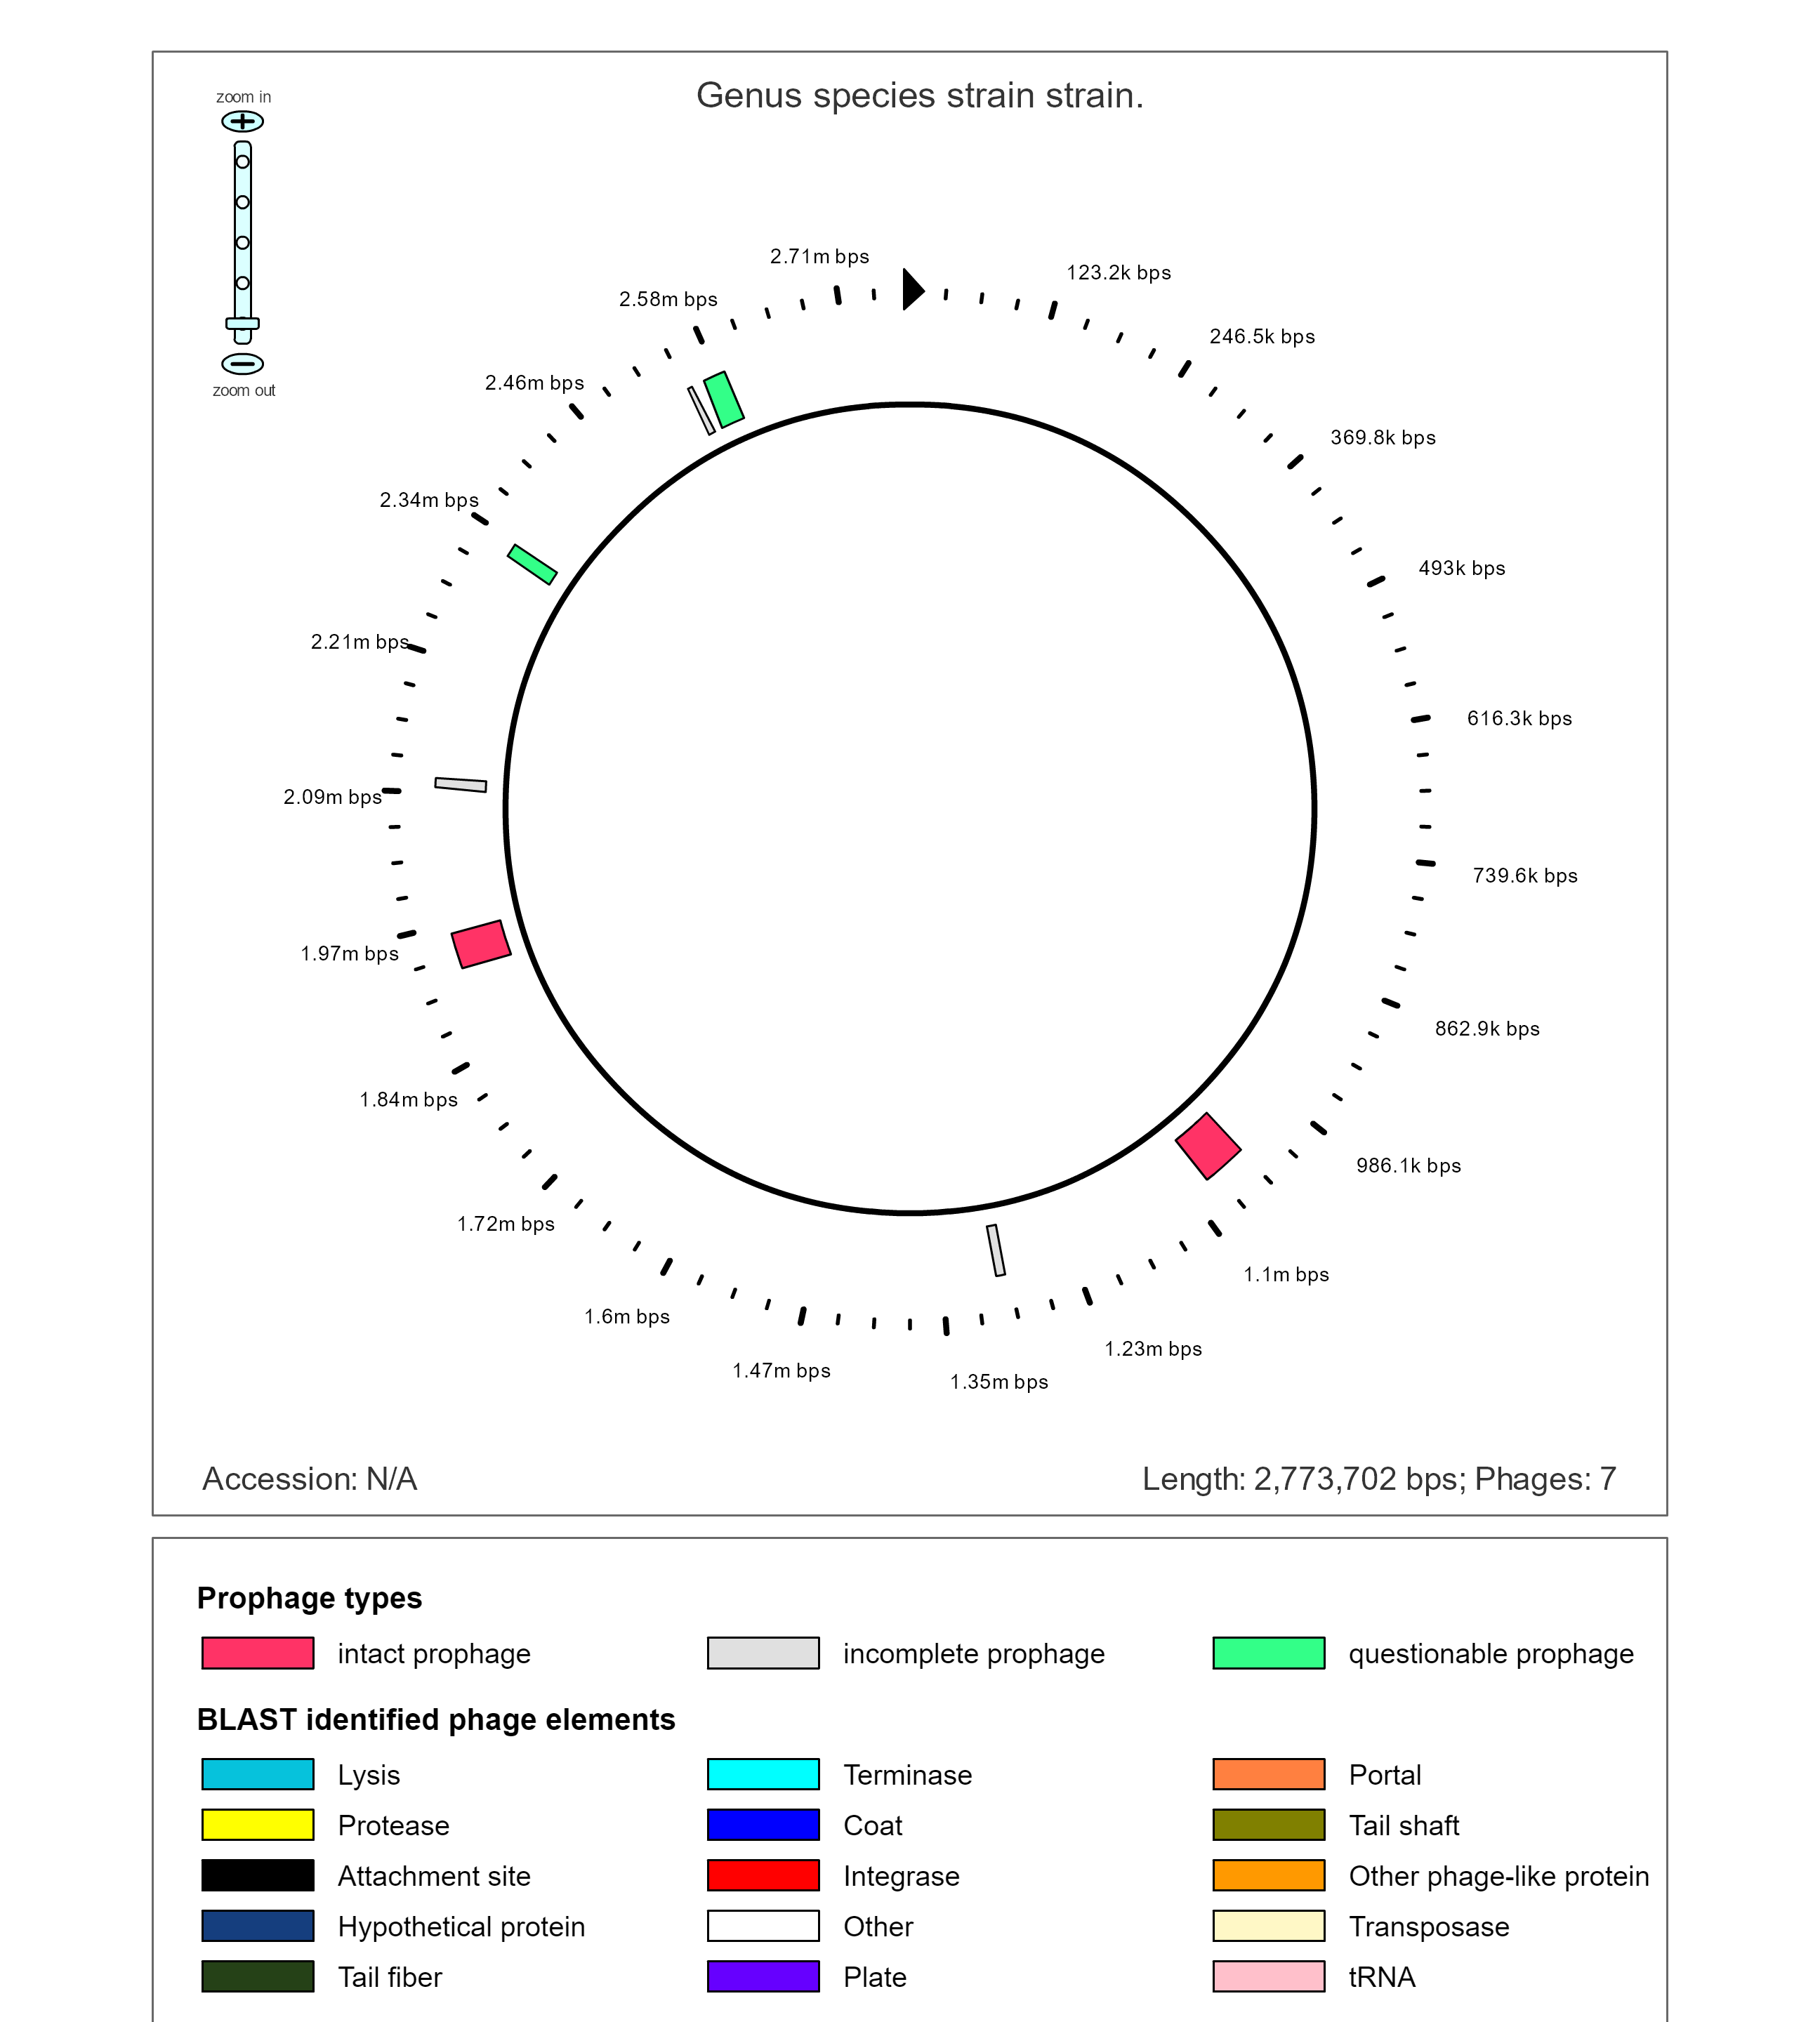
The Genome of E. faecium E745 shows that parts of if are from phages.
The genome shows that there are several genes from the prophage that are transposases, attachment sites, and integrases.
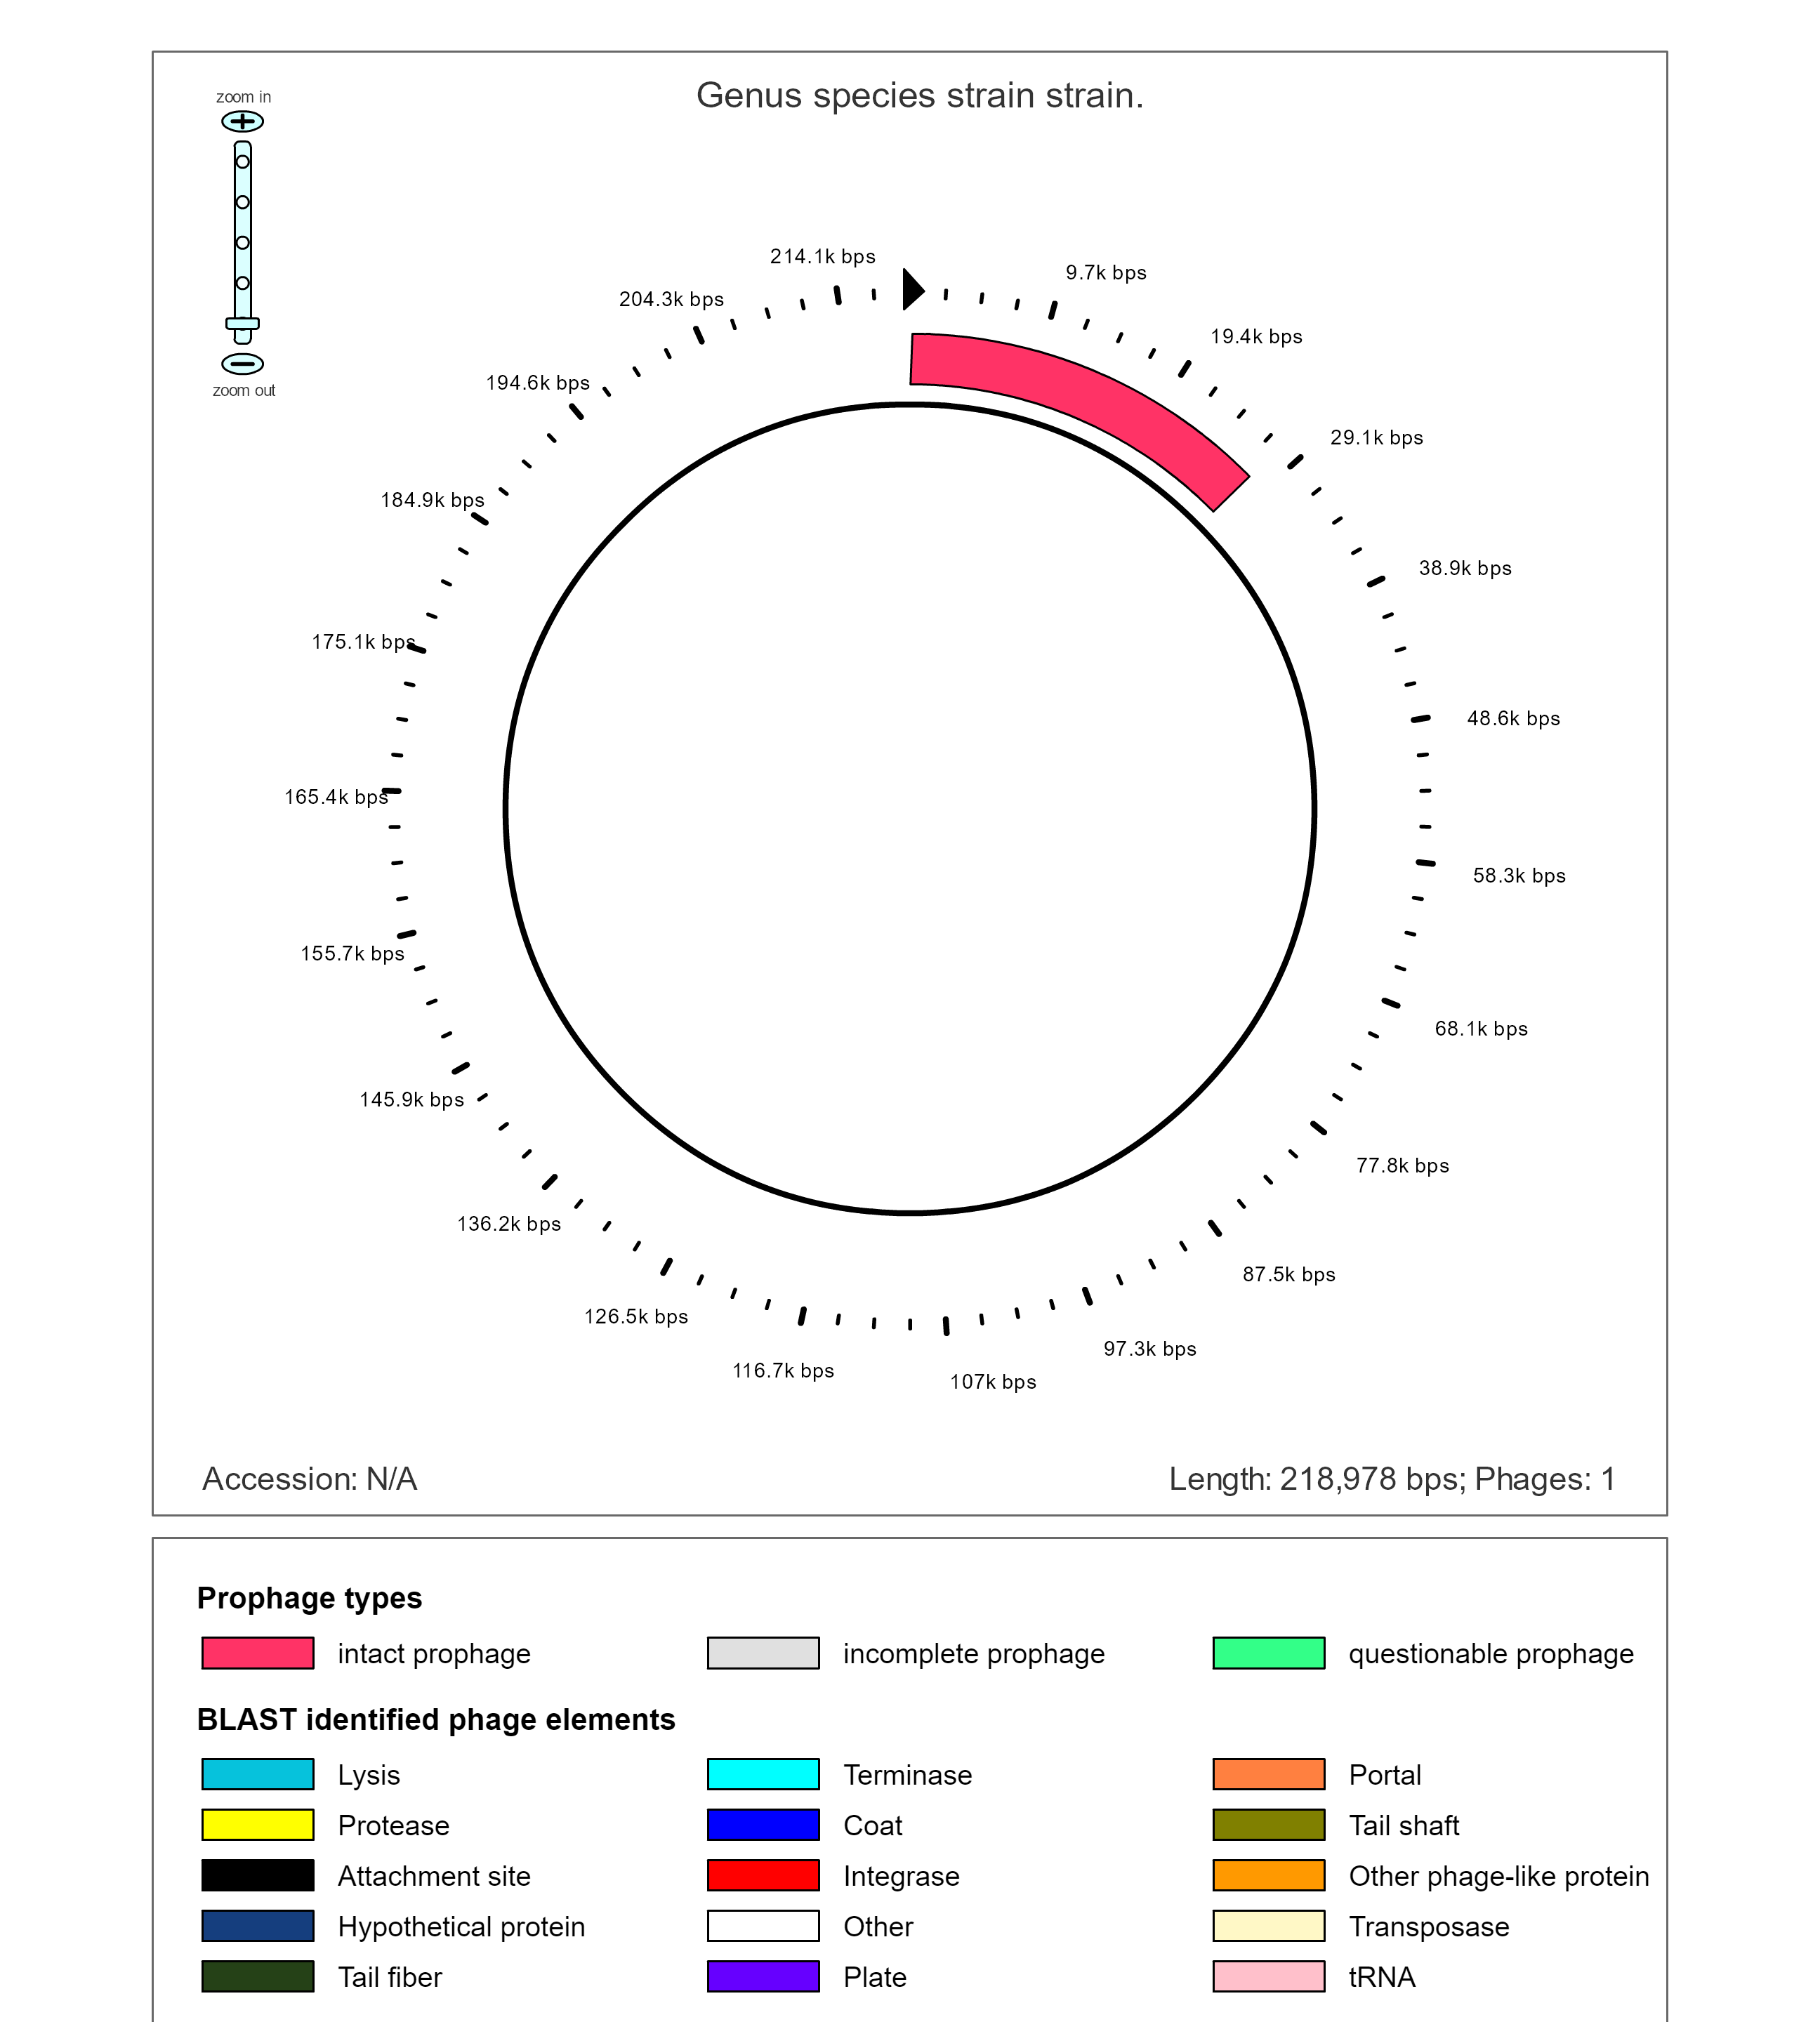
The 7th contig shows a large continuous region of intact prophage within a plasmid. PHAST predicts that this insertion is likely the results of HAGE_Staphy_SPbeta_like_NC_029119.
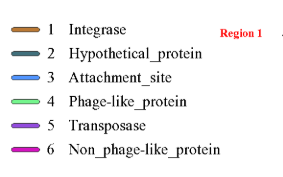
Key to the following diagram

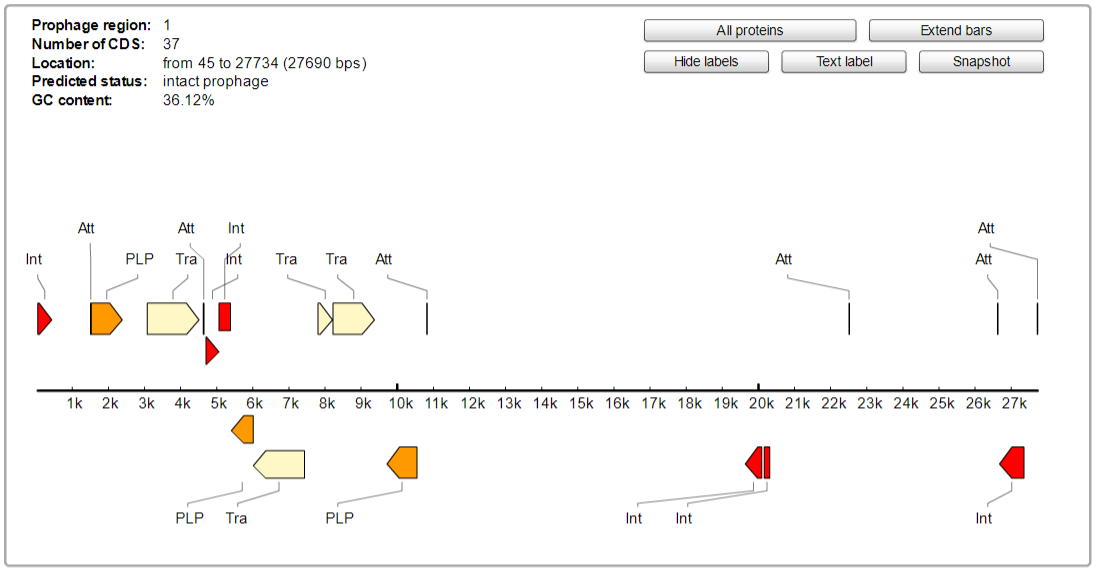
As the prophage region in this plasmid is concentrated in one area, the area of phage DNA can be easily examined more closely. This intact prophase appears to code for several different types of gene functions.
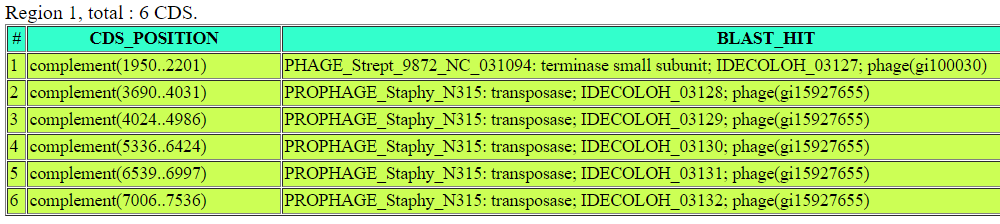
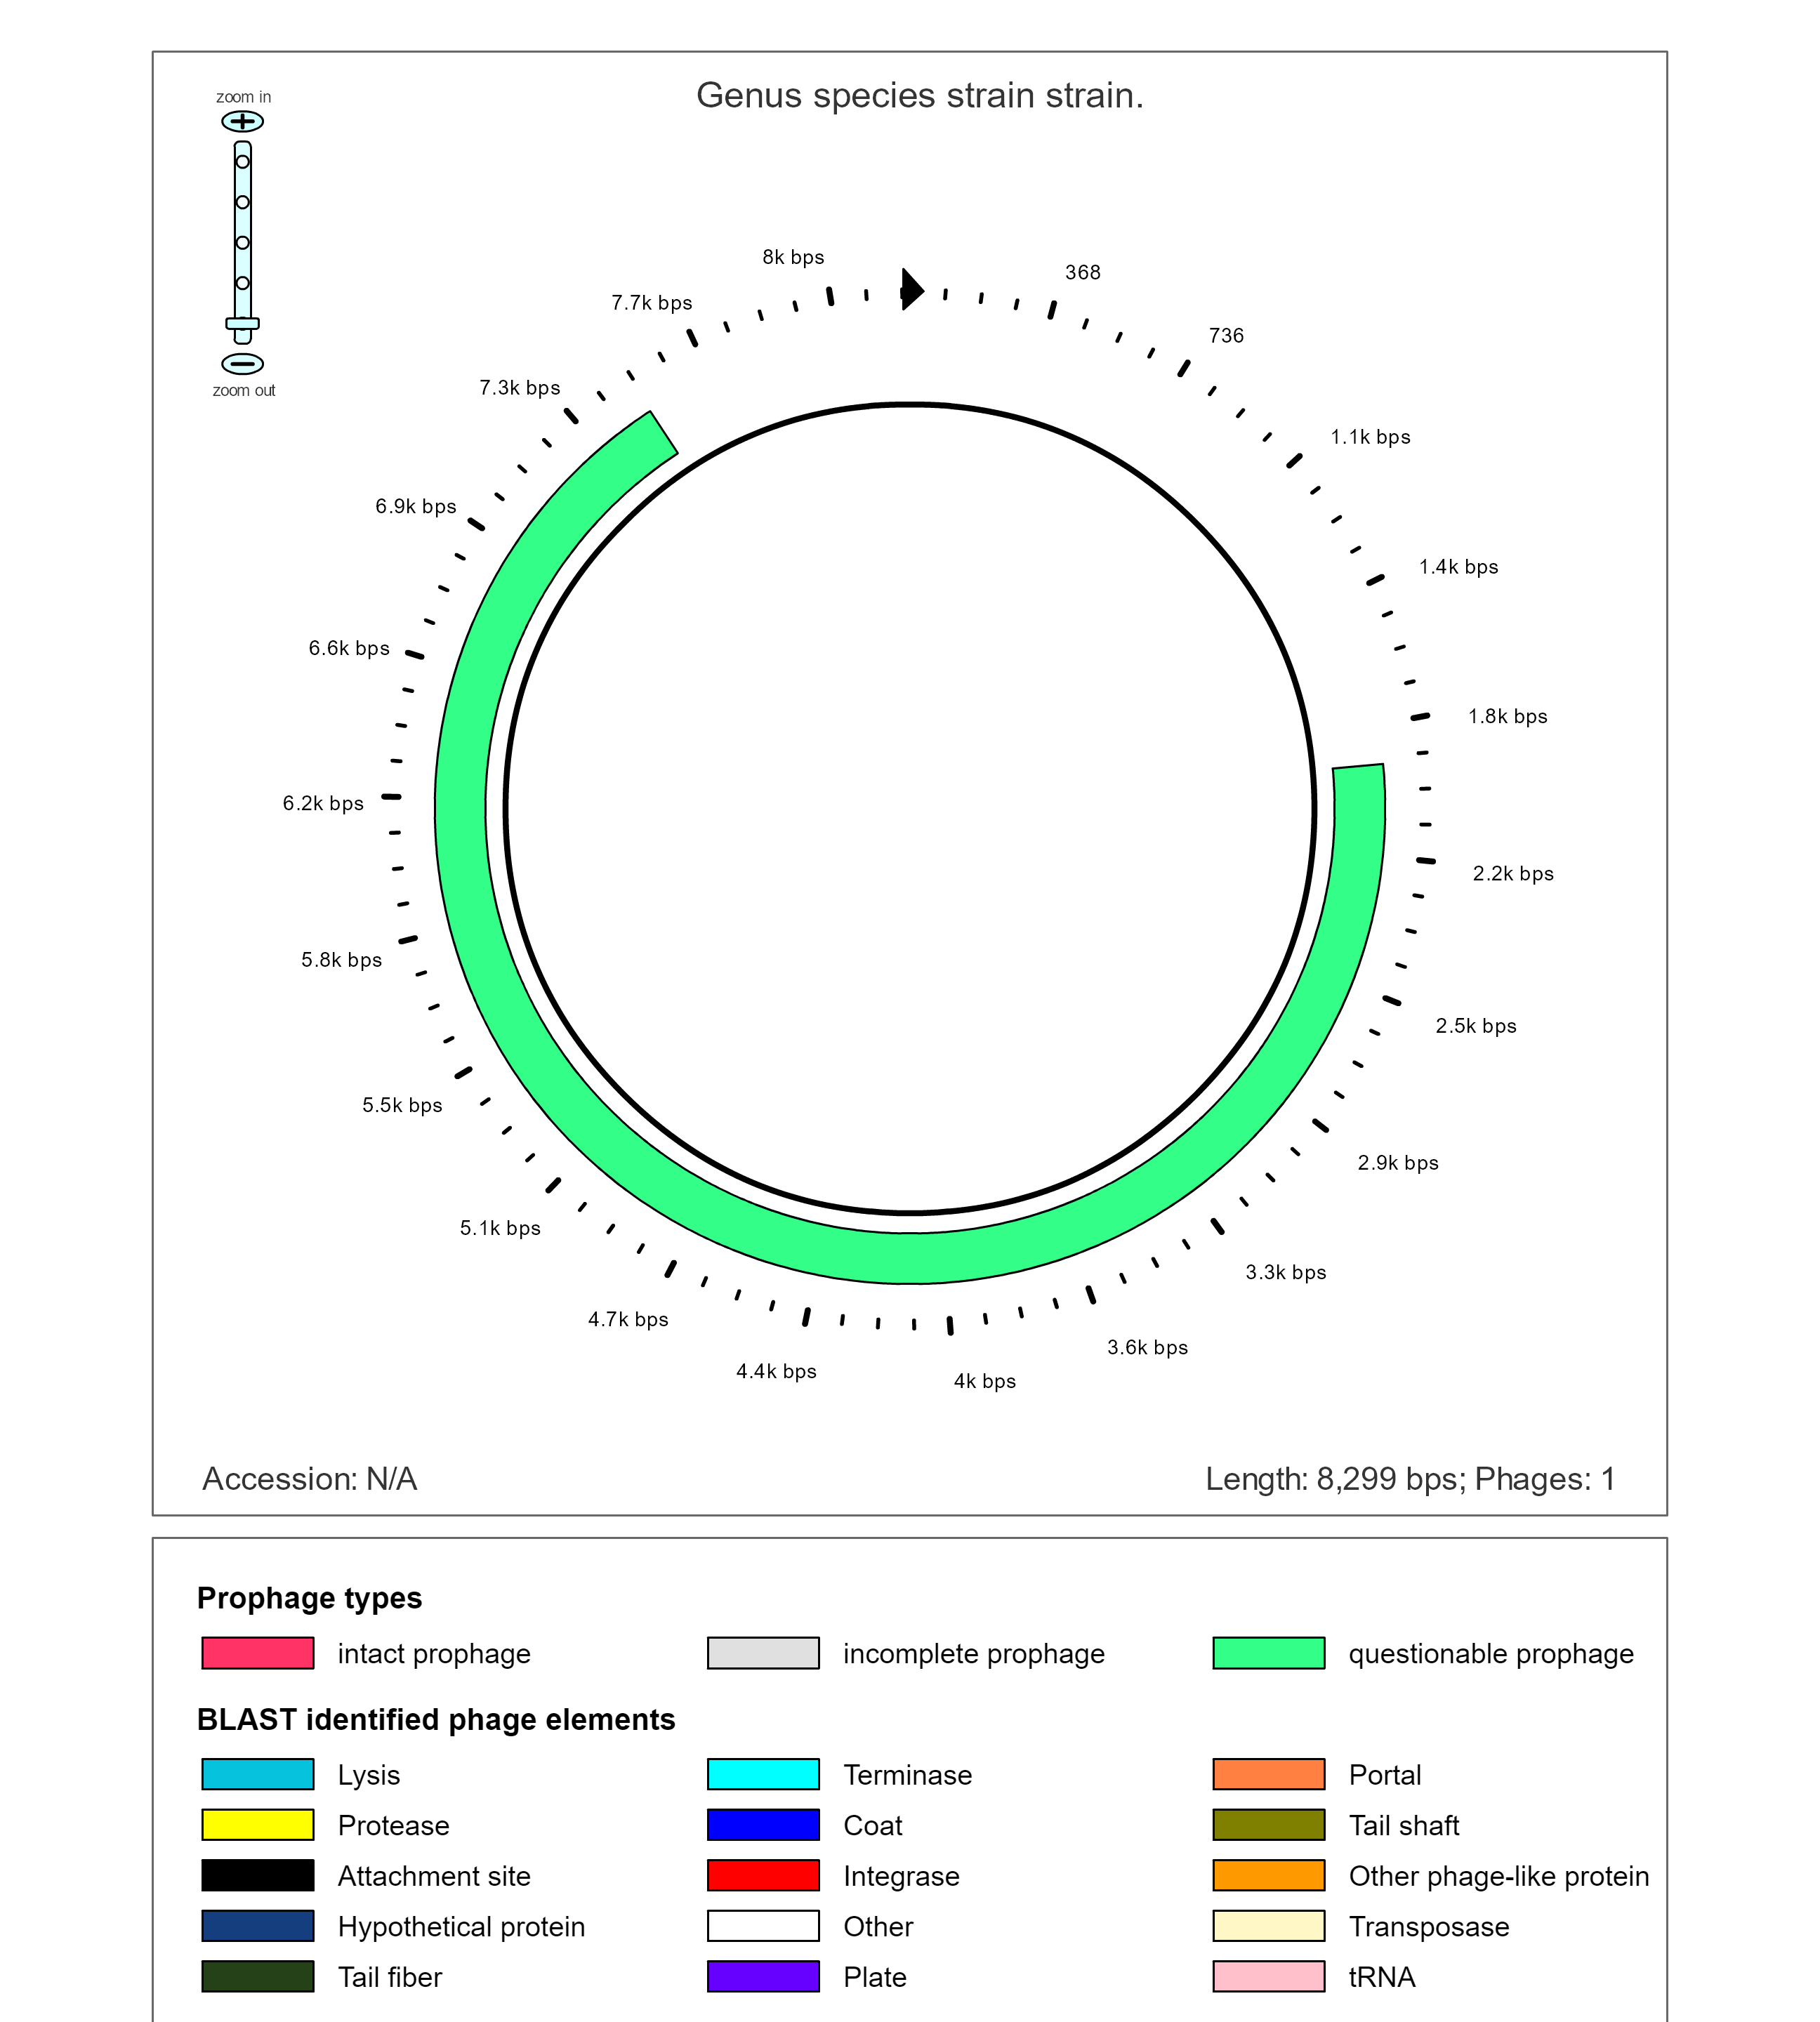 The 8th contig is almost entirely made up a potential prophage. PHAST predicts that this is likely the result of PHAGE_Strept_9874_NC_031023 and PROPHAGE_Staphy_N315.
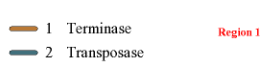
Key to the following Diagram

This prophage insertion appears to be simpler than the others as it only shows terminases and transferases. However...
 The hypothetical genes in this position could not be annotated, potentially because these have not yet been studied.
Conclusion
Antimicrobial resistance is complicated. There are several sources that can help bacteria to avoid succumbing to pharmaceuticals. These elements are often transferable, either in the form of horizontal transfer by plasmid or by infection of a prophage as it integrates itself into the host bacteria. Identifying the types of transferable elements present therefore is just as important as as identifying the genes that play important roles in the survival of antimicrobial resistant bacteria. Here several genes selected for investigation as being required for growth of vancomycin resistant E. faecium E745 in human serum. This was done by comparing the genes expressed in nutrient rich BHI medium to the less nutrient rich human serum. In addition, the genes were looked at to identify the types of transferable elements present in E. faecium. Further investigation will be needed to narrow down the list of essential genes for E. faecium growth in human serum to find the area that would make the most sense for pharmaceuticals to target. It would then be interesting from the perspective of evolution to see where those resistance genes are in regards to the give E. faecium E745 its resistance to vancomycin.