Output documentation and examples - Gu-Lab-RBL-NCI/QuagmiR GitHub Wiki
QuagmiR is a novel algorithm for isomiR analysis. Each miRNA sequence is divided into three regions: 5’ part, 3’ part and a central region. The latter is unique to each miRNA and will be termed as the “motif” (see more). Reads matching a certain motif are as considered potential isomiRs for the corresponding miRNA (Step 1. Motif pull).
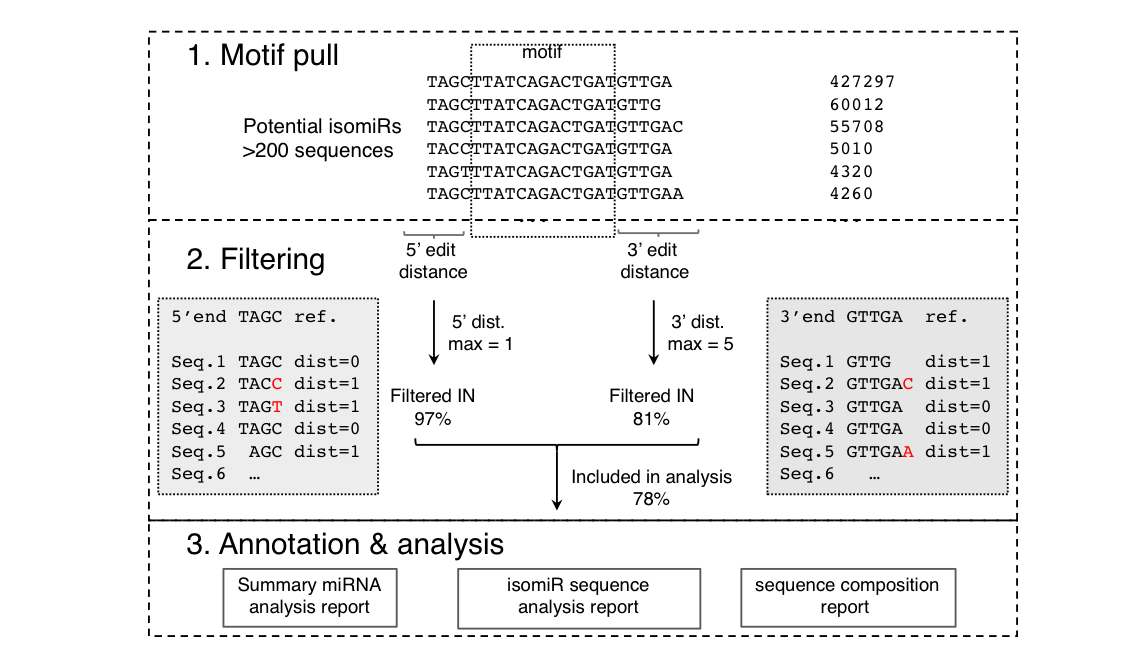
The potential isomiR reads are further filtered according to the nucleotides that precede and follow the motif (5’ part and 3’ part, respectively) (Step 2. Filtering). The sequence pairwise similarity between a read and the reference miRNA is calculated using the Levenshtein distances - the number of deletions, insertions, or substitutions required to transform one string into the other.
Example of Levenshtein distances
Reference sequence: TAGC
Seq.1 TAGC dist=0
Seq.2 TACC dist=1
Seq.3 TAGT dist=1
Seq.4 TAGC dist=0
Seq.5  AGC dist=1
The penalty or distance of any change may be fine-tuned, although the default value is 1. The filtering parameters for the 5' and 3' regions may be set independently to capture the asymmetrical distribution of the sequence heterogeneity. By this approach, users can customize the mapping process to focus on particular types of isomiRs. For example, 3’ isomiRs can be specifically targeted by setting the 5’ distance to 0 and leaving the 3’ distance open to any value (set to -1).
Description of QuagmiR Outputs
Intermediate data
file.collapsed are generated on the first step of analysis and stored under the collapsed folder. They contain the list of all sequences reported on the fastq file and the number of counts for each of them.
7608 TCTTTGGTTATCTAGCTGTATG
14861 TCTTTGGTTATCTAGCTGTATGA
 261 TCTTTGGTTATCTAGCTGTATGAA
  74 TCTTTGGTTATCTAGCTGTATGAAA
   2 TCTTTGGTTATCTAGCTGTATGAAAA
   1 TCTTTGGTTATCTAGCTGTATGAAACCA
   1 TCTTTGGTTATCTAGCTGTATGAAACCG
   1 TCTTTGGTTATCTAGCTGTATGAAAGA
   1 TCTTTGGTTATCTAGCTGTATGAAAGGGTTTGA
   1 TCTTTGGTTATCTAGCTGTATGAAATA
   1 TCTTTGGTTATCTAGCTGTATGAAATCTTGATTTTT
In this example we can see some of the reads pulled with a motif against miR-9.
Isomir summary
The report file.isomir.tsv provides the user with a comprehensive list of the isomiRs detected for each reference miRNA. The descriptor provided are the following:
MIRNAname of the miRNAMOTIFnucleotide sequence used as motif to pull readsCONSENSUSmiRNA nucleotide reference sequence (based on miRBase)TOTAL_READStotal number of reads for that miRNA after the filtering stepTOTAL_ISOMIRStotal number of isomiRs detected for that miRNA after the filtering stepFIDELITY_5P5' isomiRs cleavage fidelity as defined in Gu et al. Cell (2012)A_TAILINGpercentage of reads with A in the tail sequenceC_TAILINGpercentage of reads with C in the tail sequenceG_TAILINGpercentage of reads with G in the tail sequenceT_TAILINGpercentage of reads with T in the tail sequenceSEQUENCE_TRIMMING_ONLYpercentage of reads with trimming, no tail addedSEQUENCE_TRIMMINGpercentage of reads with trimmingSEQUENCE_TAILING_ONLYpercentage of reads with tail added on the top of reference sequenceSEQUENCE_TAILINGpercentage of reads with added tailSEQUENCE_TRIMMING_AND_TAILINGpercentage of reads with both trim and tailTOTAL_READS_IN_SAMPLEtotal number of reads in the sample (fastq file)
MIRNA	MOTIF	CONSENSUS	TOTAL_READS	TOTAL_ISOMIRS	FIDELITY_5P	A_TAILING	C_TAILING	G_TAILING	T_TAILING	SEQUENCE_TRIMMING_ONLY	SEQUENCE_TRIMMING	SEQUENCE_TAILING_ONLY	SEQUENCE_TAILING	SEQUENCE_TRIMMING_AND_TAILING	TOTAL_READS_IN_SAMPLE
mir-9-5p	GGTTATCTAG	TCTTTGGTTATCTAGCTGTATGA	16401	502	1.8017	8.7	5.28	59.6	26.42	8.13	18.05	57.75	67.67	9.92	744379
mir-9-3p	GCTAGATAAC	ATAAAGCTAGATAACCGAAAGT	1321	85	0.1234	16.26	28.53	35.58	19.63	24.21	41.19	1.63	18.61	16.98	744379
Isomir descriptors
The report file.isomir.sequence_info.tsvprovides the user a tabulated description of all the isomiRs detected in a sample and their isomiR features.
MIRNAname of the sequence motif that pulled that readSEQUENCEsequence of that pulled readLEN_READlength (nucleotides) of that pulled readREADSnumber of counts of that pulled read in the sampleRATIOpercentage of counts of that particular isomiR sequence relative to the total number of counts considered for that miRNA in the sampleLEN_TRIMlength (nucleotides) trimmed of that pulled read compared to the reference miRNALEN_TAILlength (nucleotides) tailed of that pulled read compared to the reference miRNASEQ_TAILNucleotide sequence of that pulled read that have been tailed compared to the reference miRNAVAR_5Plength (nucleotides) miscleaved by Drosha or Dicer of that pulled read compared to the reference miRNAMATCHAny other motif where the pulled read is also a matchCPMor Counts per Million of that isomiR relative to the total number of reads in the sampleRPKMof that isomiR relative to the total number of reads in the sampleDISTANCELevenshtein distances of that particular sequence to the reference miRNA for which it has been selected.
MIRNA	SEQUENCE	LEN_READ	READS	RATIO	LEN_TRIM	LEN_TAIL	SEQ_TAIL	VAR_5P	MATCH	CPM	RPKM	DISTANCE		16401
mir-9-5p	TTTGGTTATCTAGCTGTATGAG	22	4774	29.11%	0	1	G	2		269382.6882	291518.1648	3	0	2.664471679
mir-9-5p	TTTGGTTATCTAGCTGTATGAGT	23	2063	12.58%	0	2	GT	2		116408.9832	120497.2899	4	1	17.34650326
mir-9-5p	TTTGGTTATCTAGCTGTATGA	21	2052	12.51%	0	0	-	2		115788.2857	131269.5357	2	2	78.06841046
mir-9-5p	CTTTGGTTATCTAGCTGTATGA	22	1881	11.47%	0	0	-	1		106139.2619	114860.8437	1	3	1.335284434
mir-9-5p	TTTGGTTATCTAGCTGTATG	20	594	3.62%	1	0	-	2		33517.66166	39899.02993	3	4	0.268276325
mir-9-5p	TTTGGTTATCTAGCTGTATGAA	22	484	2.95%	0	1	A	2		27310.68728	29554.83698	3	5	0.310956649
mir-9-5p	TTTGGTTATCTAGCTGTATGAGC	23	282	1.72%	0	2	GC	2		15912.42523	16471.27279	4
mir-9-5p	TTTGGTTATCTAGCTGTATGAGA	23	282	1.72%	0	2	GA	2		15912.42523	16471.27279	4
mir-9-5p	TTTGGTTATCTAGCTGTATGG	21	231	1.41%	1	1	G	2		13034.6462	14777.41849	3
mir-9-5p	TTTGGTTATCTAGCTGTATGAGG	23	217	1.32%	0	2	GG	2		12244.66764	12674.70282	4
mir-9-5p	CTTTGGTTATCTAGCTGTATG	21	217	1.32%	1	0	-	1		12244.66764	13881.81737	2
mir-9-5p	CTTTGGTTATCTAGCTGTATGG	22	176	1.07%	1	1	G	1		9931.159011	10747.21345	2
mir-9-5p	TTTGGTTATCTAGCTGTA	18	148	0.90%	3	0	-	2		8351.201896	11045.74716	5
mir-9-5p	TCTTTGGTTATCTAGCTGTATG	22	146	0.89%	1	0	-	0		8238.347816	8915.302066	1
Nucleotide composition at base-pair level
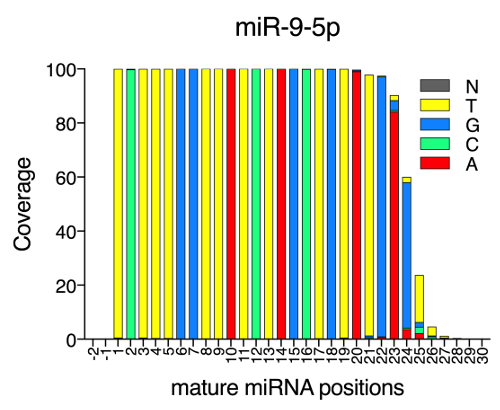
The report file.isomir.nucleotide_dist.tsv provides for each position on the mature miRNA sequence the number of reads covering it and the composition in nucleotides. This allows the user to easily spot any particular position where and editing event takes place or preferred nucleotide tailings by position.
MIRNA	NT_POSITION	A	C	G	T	N	READS
mir-9-5p	-4	0.0	0.0	0.0	1.0	0.0	1
mir-9-5p	-3	0.0	0.0	1.0	0.0	0.0	1
mir-9-5p	-2	0.0	0.0	1.0	0.0	0.0	2
mir-9-5p	-1	0.75	0.0	0.0	0.25	0.0	4
mir-9-5p	0	0.0022	0.0022	0.0	0.9955	0.0	16395
mir-9-5p	1	0.0003	0.9976	0.0006	0.0015	0.0	16395
mir-9-5p	2	0.0006	0.0036	0.0004	0.9954	0.0	16395
mir-9-5p	3	0.0002	0.0021	0.0003	0.9974	0.0	16395
mir-9-5p	4	0.0004	0.0021	0.0002	0.9973	0.0	16395
mir-9-5p	5	0.0	0.0	1.0	0.0	0.0	16401
mir-9-5p	6	0.0	0.0	1.0	0.0	0.0	16401
mir-9-5p	7	0.0	0.0	0.0	1.0	0.0	16401
mir-9-5p	8	0.0	0.0	0.0	1.0	0.0	16401
mir-9-5p	9	1.0	0.0	0.0	0.0	0.0	16401
mir-9-5p	10	0.0	0.0	0.0	1.0	0.0	16401
mir-9-5p	11	0.0	1.0	0.0	0.0	0.0	16401
mir-9-5p	12	0.0	0.0	0.0	1.0	0.0	16401
mir-9-5p	13	1.0	0.0	0.0	0.0	0.0	16401
mir-9-5p	14	0.0	0.0	1.0	0.0	0.0	16401
mir-9-5p	15	0.0002	0.9988	0.0	0.0009	0.0	16401
mir-9-5p	16	0.0005	0.0017	0.0002	0.9975	0.0	16393
mir-9-5p	17	0.0004	0.0002	0.9988	0.0006	0.0	16390
mir-9-5p	18	0.0006	0.003	0.0007	0.9957	0.0	16389
mir-9-5p	19	0.9935	0.0008	0.0043	0.0015	0.0	16342
mir-9-5p	20	0.0004	0.0055	0.0063	0.9878	0.0	16040
mir-9-5p	21	0.0079	0.0008	0.9878	0.0036	0.0	15975
mir-9-5p	22	0.9316	0.0064	0.0407	0.0212	0.0	14790
mir-9-5p	23	0.0585	0.0097	0.8991	0.0327	0.0	9834
mir-9-5p	24	0.0848	0.1026	0.0735	0.7392	0.0	3880
mir-9-5p	25	0.0519	0.1398	0.0652	0.743	0.0	751
mir-9-5p	26	0.1684	0.1158	0.1368	0.5789	0.0	190
mir-9-5p	27	0.0577	0.1731	0.1731	0.5962	0.0	52
mir-9-5p	28	0.16	0.04	0.28	0.52	0.0	25
mir-9-5p	29	0.1667	0.0	0.1667	0.6667	0.0	12
Example on how the nucleotide composition at base-pair level can be represented.
Group results
The group_results allows the user to aggregate results from multiple samples into a single report file. By default the name of this aggregated file is set to cohort1.
An example of this aggregate format looks as follows:
SAMPLE	MIRNA	MOTIF	CONSENSUS	TOTAL_READS	TOTAL_ISOMIRS	FIDELITY_5P	A_TAILING	C_TAILING	G_TAILING	T_TAILING	SEQUENCE_TRIMMING_ONLY	SEQUENCE_TRIMMING	SEQUENCE_TAILING_ONLY	SEQUENCE_TAILING	SEQUENCE_TRIMMING_AND_TAILING	TOTAL_READS_IN_SAMPLE
sample1.fastq	mir-9-5p	GGTTATCTAG	TCTTTGGTTATCTAGCTGTATGA	16401	502	1.8017	8.7	5.28	59.6	26.42	8.13	18.05	57.75	67.67	9.92	744379
sample1.fastq	mir-9-3p	GCTAGATAAC	ATAAAGCTAGATAACCGAAAGT	1321	85	0.1234	16.26	28.53	35.58	19.63	24.21	41.19	1.63	18.61	16.98	744379