Analysis - GeorgeGiannopoulos/StimuliXpert GitHub Wiki
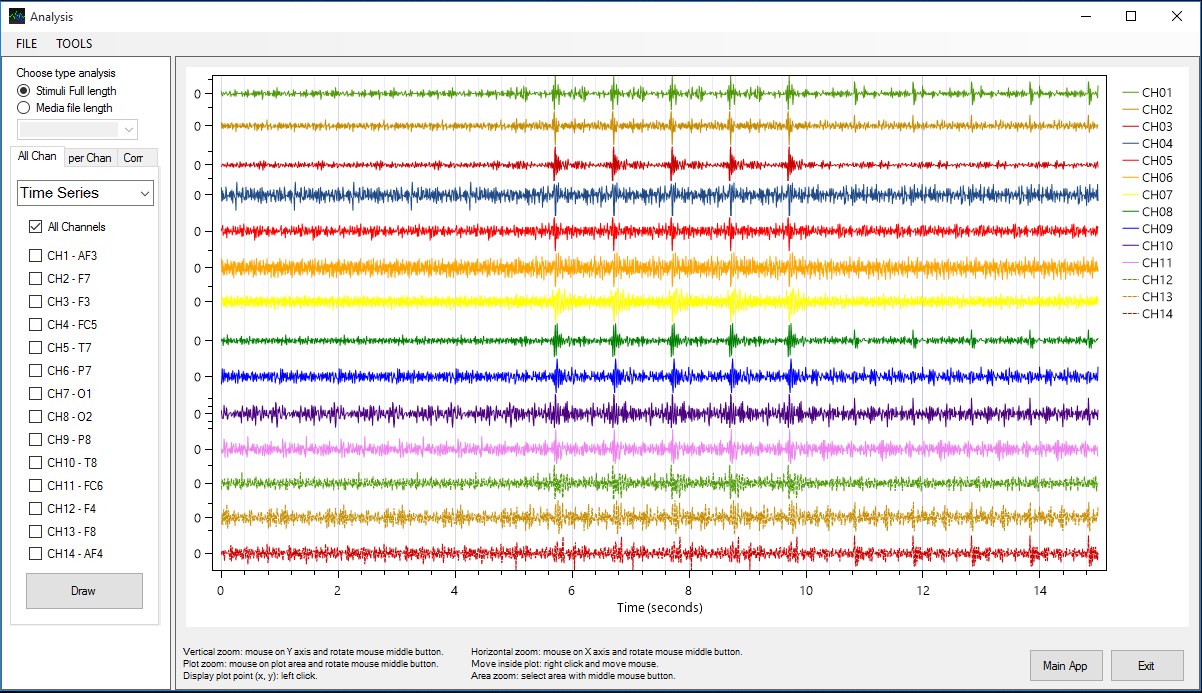
Table of contents
| Analysis | Main Menu | File | Tools | First Panel | Second Panel | Third Panel |
|---|
Analysis
The StimuliXpert contains a variety of tools which can assist in processing the recorded EEG data. These tools are gathered into a new window which can be accessed by clicking the Analysis button. Analysis enables the user to analyze the total EEG signals or to analyze each stimulus file separately. Once the user has selected the experiment file(s) to be processed, he/she can choose:
- 14 Channels analysis
- per Channels analysis
- correlation coefficients analysis
Main Menu
| Button | Action |
|---|---|
| File | Choose a new recorded file or Export results to text or png format |
| Tools | Copy Plot to Clipboard |
File
| Button | Action |
|---|---|
| New | The user can initialize the data displayed by selecting a new log file |
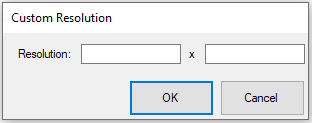
| Export Plot to PNG (1920x1080) | Exports the charts displayed on the right side of the window and stores them in a 1920x1080 PNG file |
| Export Plot to PNG Custom Resolution | Exports the charts displayed on the right side of the window and stores them in a custom resolution PNG file |
| Save correlation coefficients to csv | Save the correlation coefficients to a .csv file |
| Save correlation coefficients to txt | Save the correlation coefficients to a .csv file |
| Exit | Exit the application |
Tools
| Button | Action |
|---|---|
| Copy Plot to Clipboard (1920x1080) | Copies the charts to Clipboard using 1920x1080 resolution |
| Copy Plot to Clipboard Custom Resolution | Copies the charts to Clipboard using custom resolution |
Note: The maximum supported resolution is 8K (7680 × 4320)
First Panel
In the first tab, the user can select the channels that he/she wants to review and then from the drop-down menu he/she can choose between time or frequency analysis. For frequency analysis, the user can select one of five frequency bands. When the user selects a frequency band, then the signal passes through a filter in order to produce the waveform for that particular band.
The bands are five and split the 1Hz - 40Hz band spectrum into five:
| Band Name | Band Frequency |
|---|---|
| Delta | 1Hz - 4Hz |
| Theta | 4Hz - 8Hz |
| Alpha | 8Hz - 13Hz |
| Beta | 13Hz - 30Hz |
| Gamma | 30Hz - 48Hz |
Second Panel
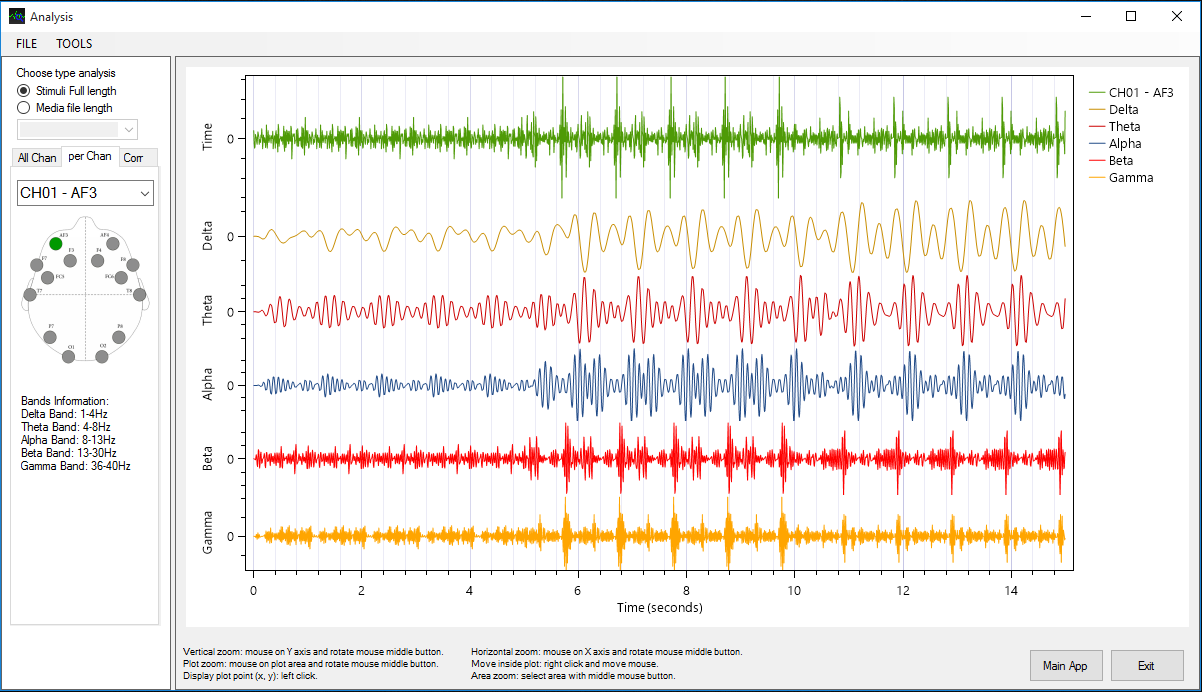
In the second tab, the user can view the analysis results for a channel by selecting this channel from the drop-down menu. The diagrams show waveforms in time analysis (as recorded by Emotiv EPOC) and in frequency analysis on the five bands as described above.
Third Panel
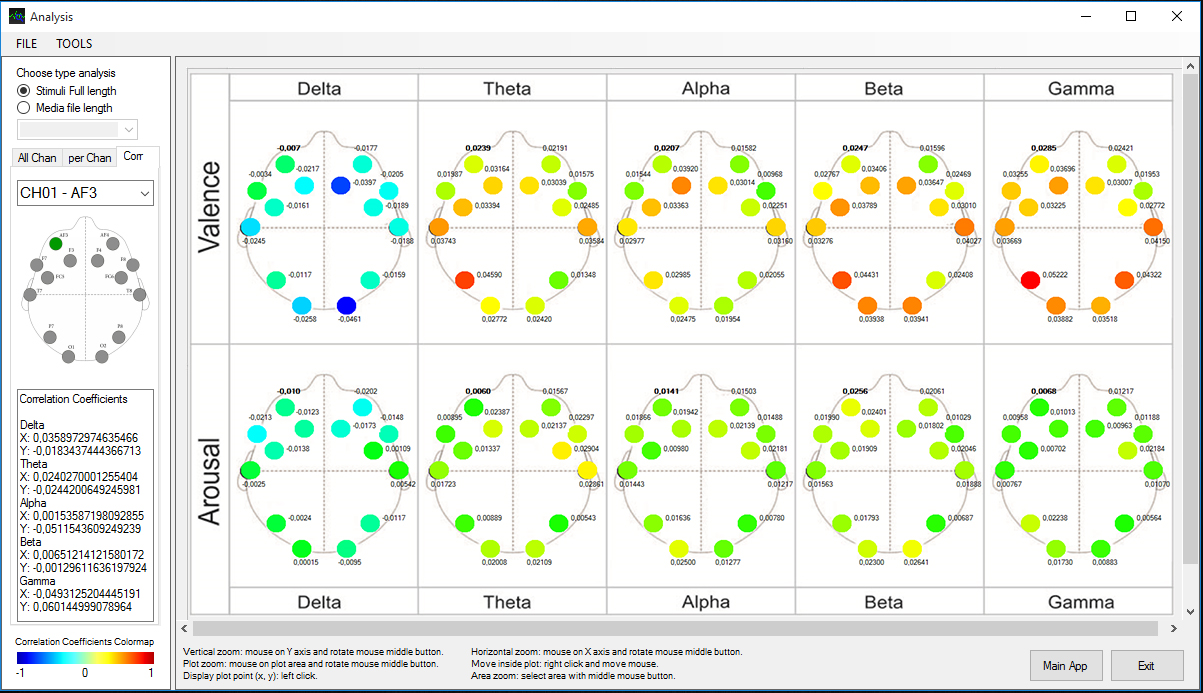
In the last tab, the user can select the desired channel in which he/she wants to review the correlation coefficients of that channel series with the emotional Valence or Arousal as described by the subject during the experiment (using a keyboard, a mouse or a digitizer).
Note: The image shown on this tab illustrates two rows with data and five columns. The rows represent valence and arousal, while the columns correspond to the frequency bands. The colors of the coefficients have been calculated by a process called color map, where the blue color corresponds to values of correlation coefficients close to -1 while the red at values close to 1. The green color indicates almost zero values for the corresponding coefficient correlation.