Viewing Raw Data before Processing - BUNPC/Homer3 GitHub Wiki
We usually view the raw data channel by channel before processing to check the data quality.
The Plot Type Select Window is designed to select what type of data to display. Generally speaking, when a new data set is loaded (which has not yet been processed by HOMER), the OD, Conc, and HRF checkboxes are disabled because those buttons are associated with data that is calculated from the raw signal.
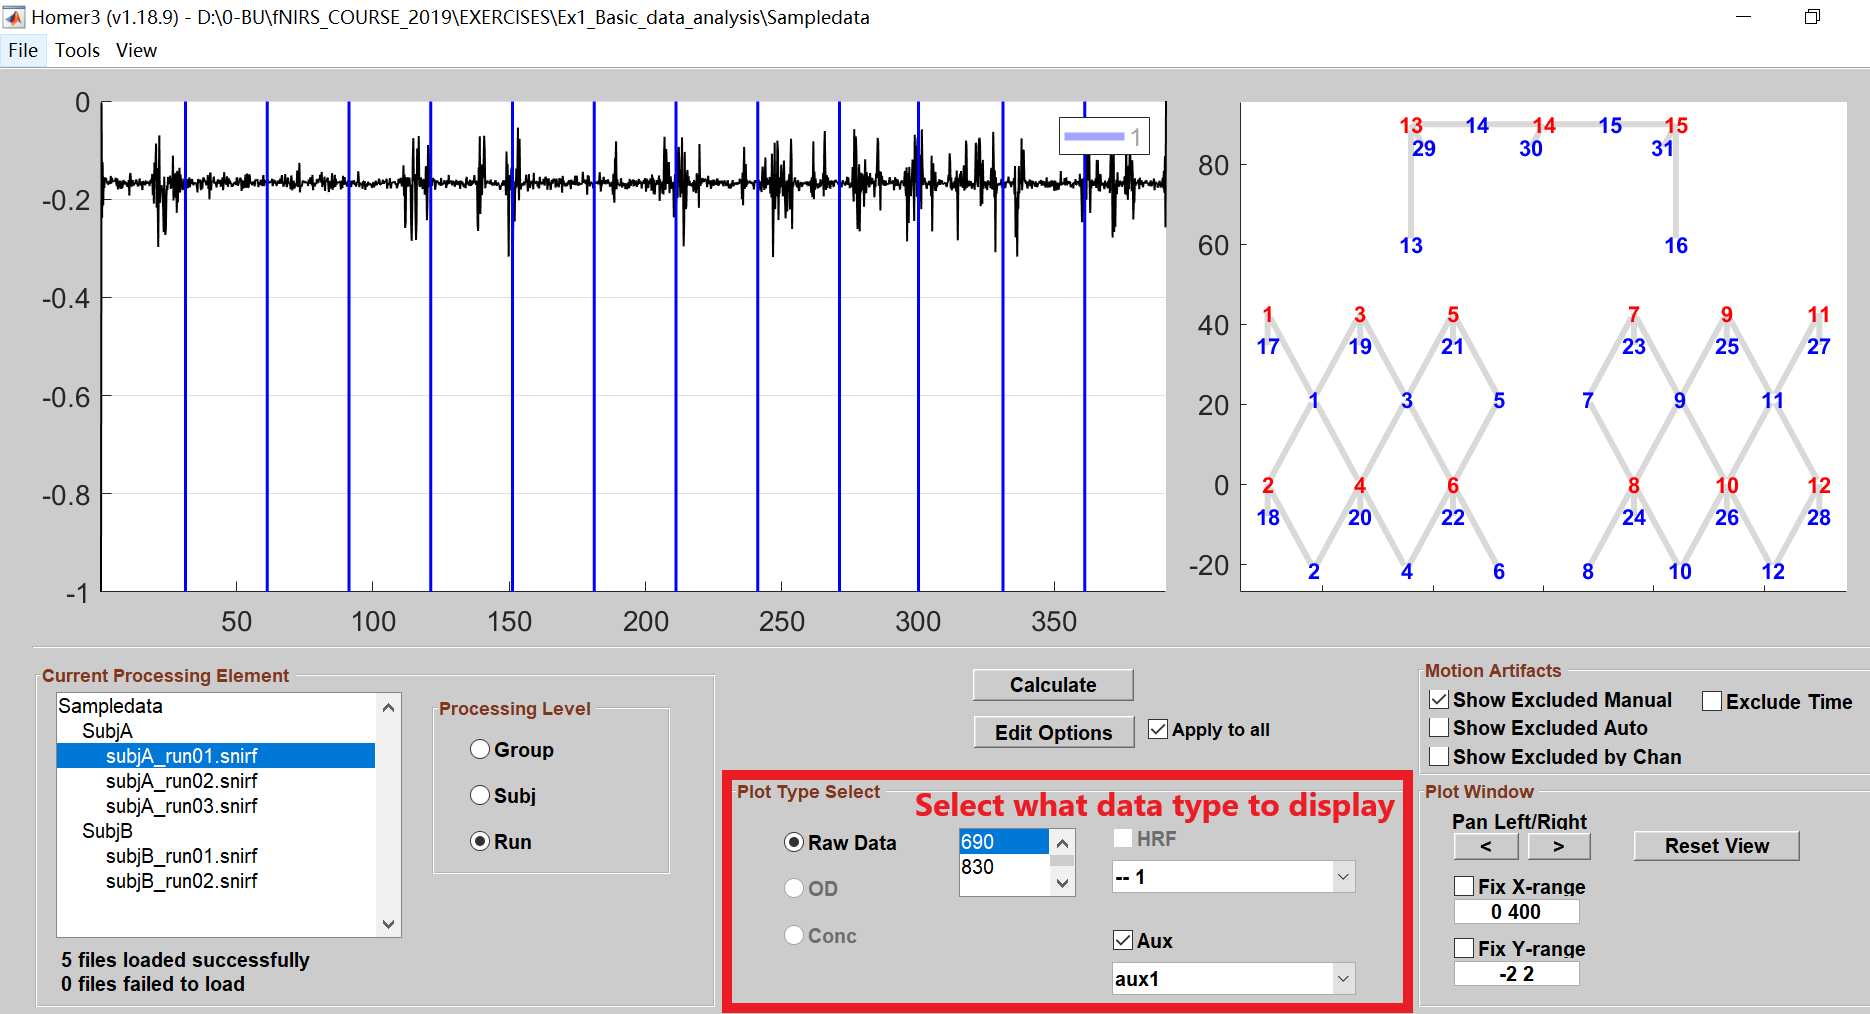
The geometry of sources, detectors and channels are displayed in the Probe Geometry Window, in which red numbers designate sources, blue numbers designate detectors, and gray lines between them represent the measurement channels.
To view the raw data please follow these steps:
(1) Select a snif file you wish to view in the Current Processing Element;
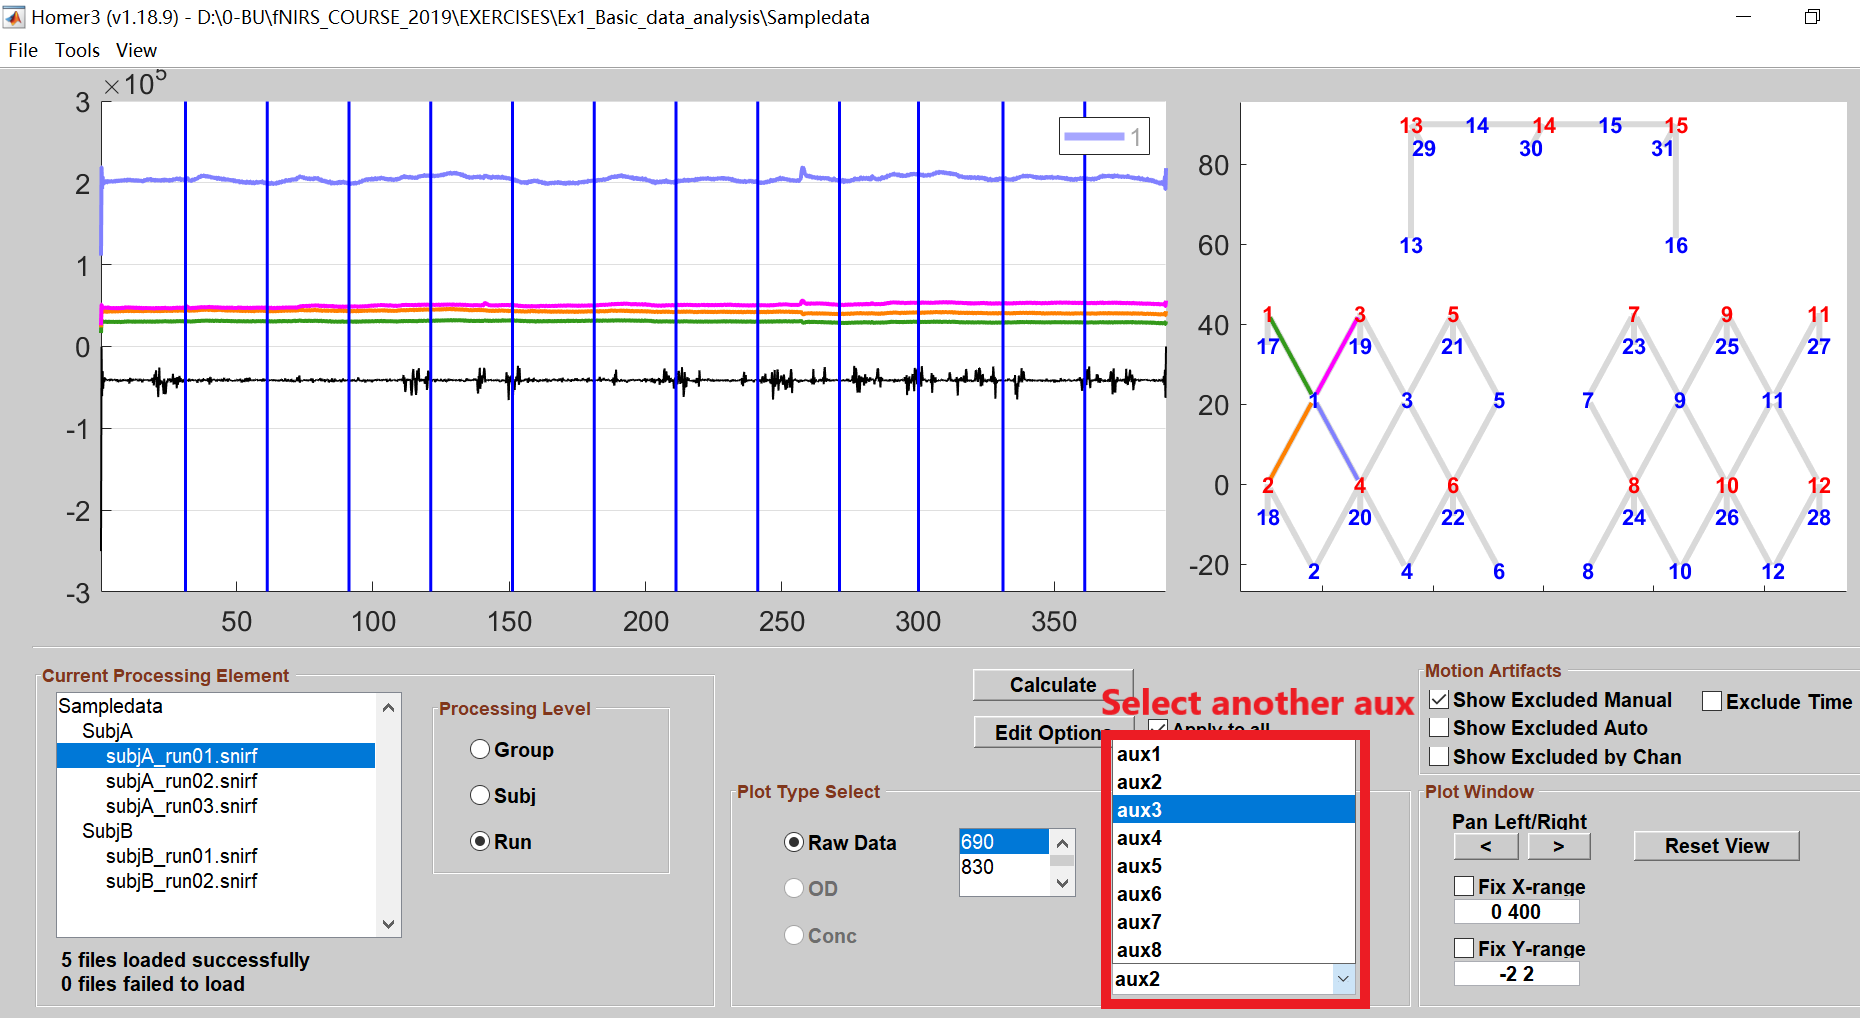
(2) Click on one of the source-detector channels in the Probe Geometry Window, and the raw data of the selected channels will show in the Data Plot Window as follows.
Typically, time courses for several channels are displayed simultaneously, since an optode usually has more than one channel associated with it.

By default, the data of auxiliary signals and stimulus marks are displayed in the Data Plot window as well. For the auxiliary signals, you can un-display it by clicking off the option.

You can also select another auxiliary signal to view it if there are multiple signals.
You can also select one or both of the wavelengths in the center list box to display the raw data. By default, the raw data is displayed at the first wavelength (here is 690nm).

The Plot Window is designed to magnify and pan the data displayed in the Data Plot Window.

- To zoom in the plot, drag the mouse over the data you wish to magnify in the Data Plot Window. Then click on the left or right arrow buttons to pan the zoomed data.
- To zoom out, right-click in the Data Plot Window or scroll down the mouse wheel. You can also click the Reset View button to reset the data display to the entire (original) time course.
- You can also change the range of x-axis or y-axis by clicking on the Fix X-range or Fix Y-range options, and typing numbers in the corresponding text box.