Viewing Processed Data - BUNPC/Homer3 GitHub Wiki
After running the processing stream, the motion artifacts that have been detected automatically can be displayed. To do that, click on the Show Excluded by Chan button. The motion artifacts of the selected channels will be marked in the Data Plot window.

Optical density (OD) can be displayed by
(1) selecting a file in the Current Processing window,
(2) clicking the OD radio button,
(3) selecting one or both of the wavelengths in the list box.
In the example below, the optical density of the two channels is displayed at 690 nm.

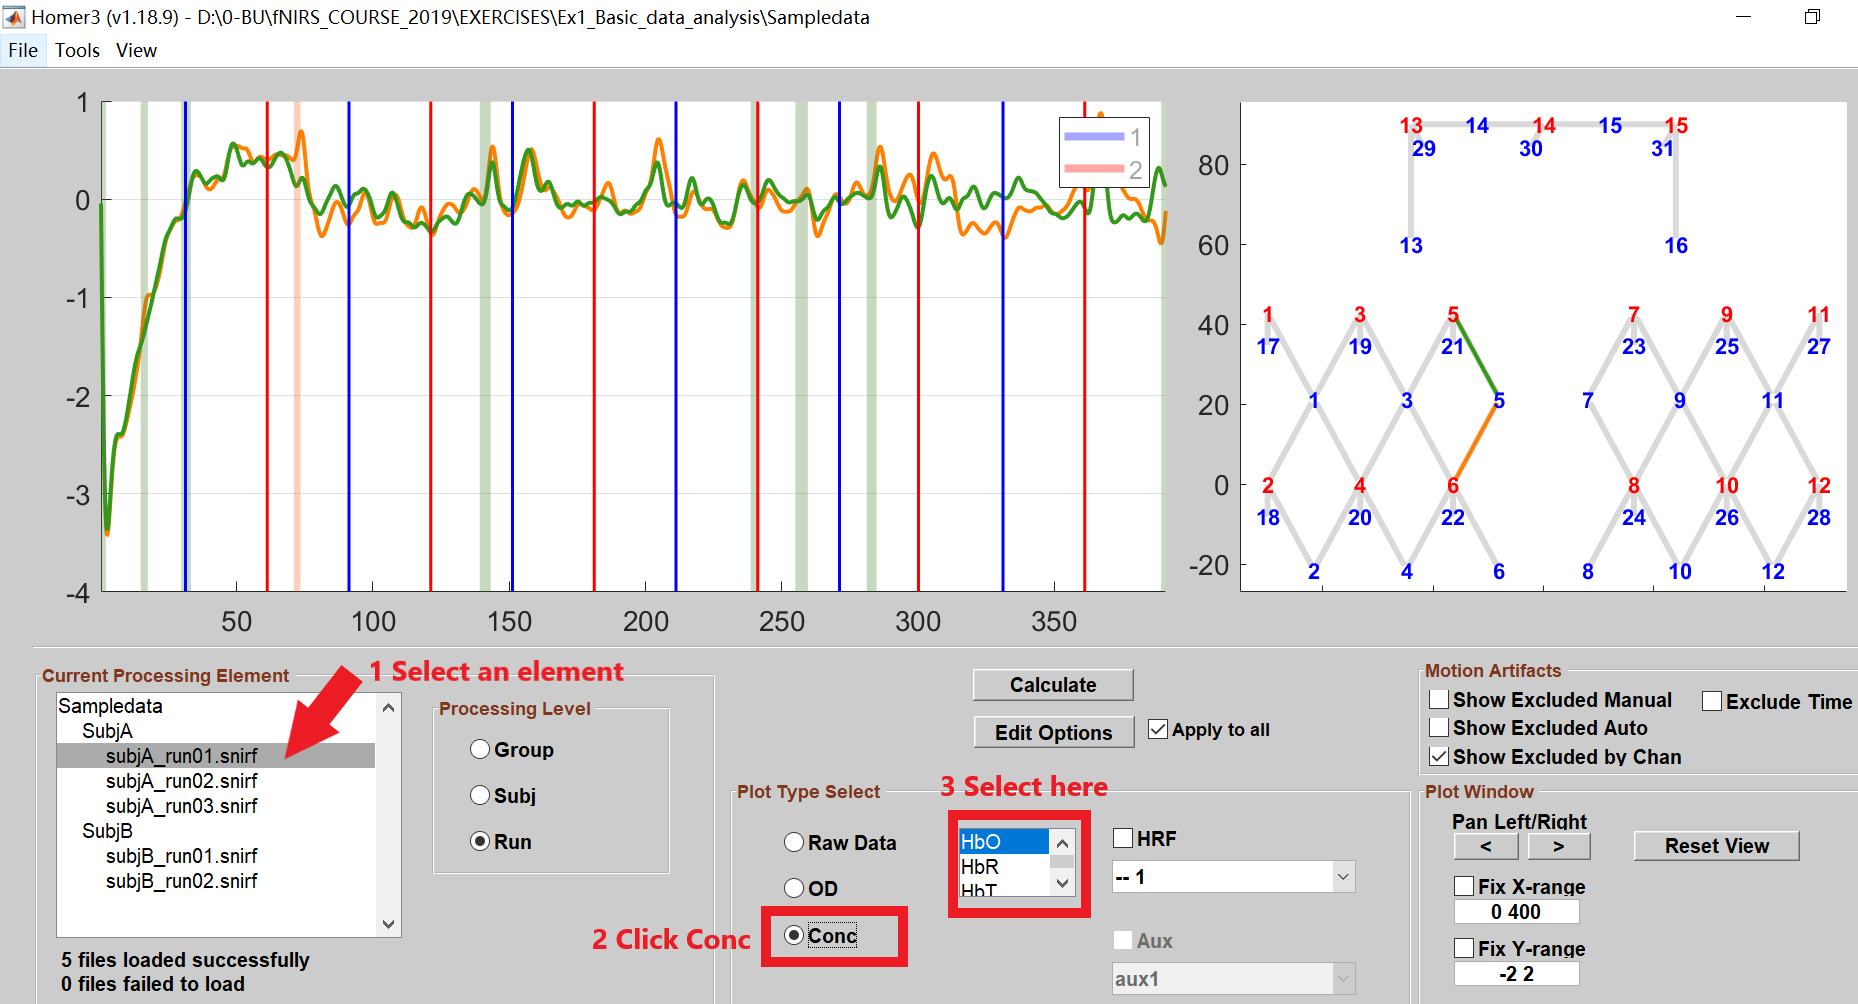
Hemoglobin concentration can be displayed by
(1) selecting a file in the Current Processing window,
(2) clicking the Conc radio button,
(3) selecting one, two or three of the Hb types from the list box.
To view time courses for more than one Hb type, click on the list box selections while holding down the Ctrl key. In the example below, HbO concentrations for two channels are displayed.
After the HRF calculation, the results can be displayed by following these steps:
- Select the element you want to show in the Current Processing Element window (you can select any run, subject, or group element here), then click on the HRF box and the channels as shown below.

- By default, the HbO data will show in the data plot window. You can display the HbR or HbT data by selecting the corresponding options, also display them simultaneously.

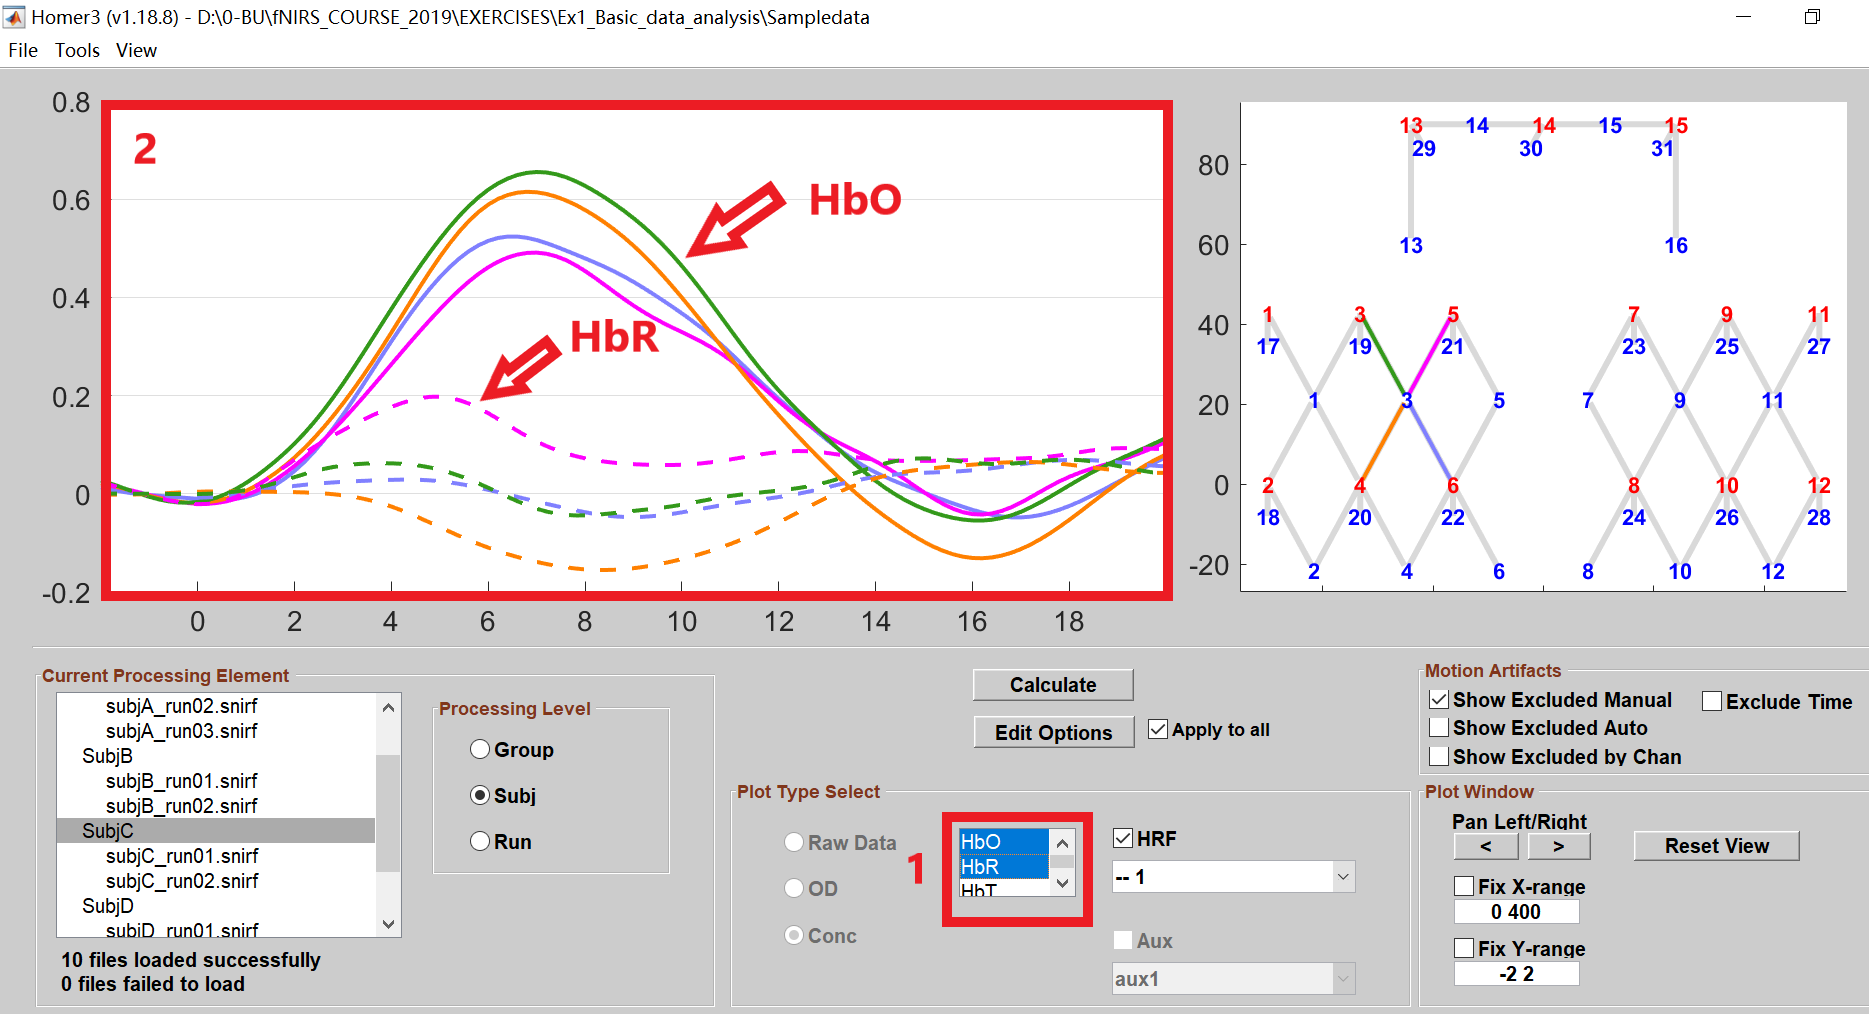
- If you have multiple conditions, Homer3 will display the HRF for the first condition by default. You can also choose other conditions to plot their HRFs.
