Troubleshooting - AtlasOfLivingAustralia/documentation GitHub Wiki
- Table of Contents
- Intro
- Basic service checks, is tomcat/solr/cassandra/apache/cas/mysql/whatever running correctly?
- Basic ports checks, is tomcat/solr/cassandra/apache/cas/mysql/whatever listening correctly?
- Some strategies to solve a service problem
- Tools & Services
- Other resources:
This document tries to document some common problems with LA software and some common tools & strategies to try to solve them. Also it tries to document some common questions/answers like the typical "Is cassandra running?".
A simple check like service tomcat7 status or service cas status etc can give you a minimal info about some service and if is running or not.
Check the follow services are running in your servers:
-
nginxand orapache2 -
tomcat7,tomcat8ortomcat9 postgresmysqlsolrcassandra
Or other ALA services like:
image-servicedoi-serviceala-namematching-serviceala-sensitive-data-service
you can verify too with:
service ala-namematching-service status
journalctl -u ala-namematching-service
If you are using CAS, verify also these services are up and running correctly:
casuserdetailscas-management-
akikeywithservice cas status, etc.
The new image-service > 0.9.2 is also a systemd service, so: service image-service status. Also images depends on the elasticsearch service. Look its status with: service elasticsearch status.
If some of these services are not running (or you want to restart them) you can:
service cas restartservice userdetails restartservice cas-management restartservice akikey restartservice image-service restartservice doi-service restart
journalctl -f -u SOME_SERVICE can provide you some additional log message if something goes wrong. Also you can verify the logs.
Some easy check is to check if that service is listening in some port from the virtual machine. You can use a tool like lsof locally to detect if some service is listening to some port.
Common ports:
-
cassandra: 9042 -
solr: 8983 -
tomcat: 8009, and/or 8080, -
mysql: 3306 -
postgresql: 5432 -
mongo: 27017 -
apikey: 9002 -
cas: 9000 -
cas-management: 8070 -
userdetails: 9001 -
elasticsearch: 9200
Some usage sample:
- Look for
solrprocess pid and find which ports are listen to:
# lsof -p $(pgrep -f solr) | grep LISTEN
java    23141 solr   45u     IPv6          203903883         0t0       TCP localhost:7983 (LISTEN)
java    23141 solr  118u     IPv6          203930236         0t0       TCP *:8983 (LISTEN)
- Find if some process is listening in
cassandraport:
# lsof -i :9042
COMMAND   PID      USER   FD   TYPE    DEVICE SIZE/OFF NODE NAME
java    14626 cassandra   81u  IPv4 909890103      0t0  TCP 172.16.16.52:9042->172.16.16.246:43622 (ESTABLISHED)
java    14626 cassandra   83u  IPv4 909890111      0t0  TCP 172.16.16.52:9042->172.16.16.246:43624 (ESTABLISHED)
java    14626 cassandra  308u  IPv4  22633942      0t0  TCP *:9042 (LISTEN)
Recommendation: Use some monitoring software to periodically auto-check that some service is running and to notify you about service issues. Do these checks externally and internally. An extra process supervision like monit can be also useful to relaunch some dead service for you.
If the services are working and listening as expected you can check if your machines and services communicate correctly each others, and you don't have, for instance firewall issues.
Tool like netcat, curl or even links (a text browser) can be useful, to test if some port is open from some VM to other VM, or some web page is accessible, etc. Samples:
-
netcat:
netcat -v -z a.b.c.d 8983
Connection to a.b.c.d 8983 port [tcp/*] succeeded!
links https://yourbiocache-service
If something goes wrong you can use tools like tcptraceroute (apt install tcptraceroute) to find who is filtering your traffic.
Many times, when you have some service problem, we are trying to test the whole thing.
Imagine a chain of elements like BrowserClient->A->B->C->D->Server that fails (partially or totally).
Or a real chain like:
BrowserClient -> Internet -> CDN -> Proxy (nginx) -> collectory (tomcat) ->
  -> biocache-hub (tomcat) -> biocache-service (tomcat) -> solr & cassandra
and something does not work as expected. This problem can be a detail (some field does not return the value you expect), or more severe (like a total biocache search failure).
We can use different strategies to try to find what is going on.
Try to check first small parts of the chain, like D->Server and later, if works, C->D->Server etc to detect where the problem is. When you think that the problem is solved, tests the complete system.
Using a metaphor: When we have an electrical machine that stops to work, the first thing is verify if there is power in the socket, later the electrical plug, later the cable, and so on... but to try to test the whole machine is like more difficult to know where the problem is.
Other strategy to detect the source of a problem is to check LA logs carefully looking for some Error/exception/etc. Other option if this is not enough is to increase the level of logs in the servers (look for log4j configuration files).
Some good question to ask is if this functionality is working in other portals. Try to make similar queries or try to use the faulty functionality in other bigger portal like: https://ala.org.au and compare the results.
Sometimes a new re-configuration via ansible or an update or a power-outage or a reboot can be a source of problems. So to keep track of your changes in your inventories using git can be very useful.
Recommendation: Use etckeeper to see changes in /etc during time. You can check what changed after re-running ansible. As etckeeper only tracks changes in ... bingo... /etc, you can use plain git in your /data/*/config/ directories to track ansible changes in your configurations and detect new variables introduced by ansible. For instance, after configuring CAS via ansible (or other new service in your node) it's easy to detect our configuration changes via git diff and detect also a missed variable in our inventories:
root@biocache:/data/ala-hub/config# git diff
diff --git a/ala-hub-config.properties b/ala-hub-config.properties
index f7e6ca2..d7f0a96 100644
--- a/ala-hub-config.properties
+++ b/ala-hub-config.properties
@@ -6,17 +6,17 @@ grails.resources.work.dir=/data/ala-hub/cache

 # CAS Config
 serverName=https://biocache.somedomain
-security.cas.casServerName=
+security.cas.casServerName=https://auth.somedomain
 security.cas.appServerName=https://biocache.somedomain
-security.cas.casServerUrlPrefix=/cas
-security.cas.casServerLoginUrl=/cas/login
-security.cas.casServerLogoutUrl=/cas/logout
-security.cas.loginUrl=/cas/login
-security.cas.logoutUrl=/cas/logout
-security.cas.uriFilterPattern=
+security.cas.casServerUrlPrefix=https://auth.somedomain/cas
+security.cas.casServerLoginUrl=https://auth.somedomain/cas/login
+security.cas.casServerLogoutUrl=https://auth.somedomain/cas/logout
+security.cas.loginUrl=https://auth.somedomain/cas/login
+security.cas.logoutUrl=https://auth.somedomain/cas/logout
+security.cas.uriFilterPattern=/admin.*,/alaAdmin.*,/download.*
Sometimes there is an incompatibility between software version that makes that, for instance, biocache-hub, biocache-service and biocache-store generated indexes are not compatible, so the queries don't work, etc.
Sometimes is useful to find for a error log or message in ALA github looking for a issue.
A query like: https://github.com/search?q=org%3AAtlasOfLivingAustralia+%22Unable+to+retrieve+email+from+User+Principal%22 search all github repos for this particular quoted message. This is a fast way to find a message in code or a error message in some issue searching in all the ALA code repos.
A faster way is to add a custom search engine in your chrome/chromium browser like this:
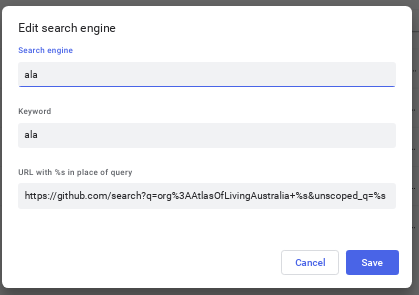
so you can type: ala TAB some query (or some "quoted query") in your chrome browser bar to fast search all ALA repositories.
Look for chrome://settings/searchEngines or right click in the chrome url bar -> Edit Search engines.
Recommendation: You can add a similar search engine for GBIF repos in github, if for example, your LA node uses IPT and you want to search fast for some IPT error. Also useful to add nexus searcher for:
- Search LA components in nexus: https://nexus.ala.org.au/#browse/search=name.raw%3D%s
- Search wars
sha1sumin nexus: https://nexus.ala.org.au/#browse/search=assets.attributes.checksum.sha1%3D%s so you can identify the version of some war
Sometimes we try to find a solution or to find an answer from the community thinking in a solution instead of focusing in the problem itself.
Quoting http://xyproblem.info/, "The problem occurs when people get stuck on what they believe is the solution and are unable step back and explain the issue in full".
When you are stuck in some error, get distance and think if you are focusing the issue correctly.
The easiest way to run LA ansible inventories is via a passwordless ssh key and sudo. [Here] you can check a good tutorial of how to configure it. So some basic checks you should test:
- Is your machine accessible via
ssh? Check if port 22 is accesible. - Has a
ubuntuuser? - Has
sudoenabled?
You can test your initial VM passwordless setup with some ssh command like:
ssh -i ~/.ssh/MyKey.pem [email protected] sudo ls /root
to see if ansible will run without too much pain.
Also a common issue running LA ansible inventories is not configure some var. So you can look for default vars in some role:
grep -ri orgName ansible/roles/biocache*
# or look for defaults values
grep -r "default(" ansible/roles/biocache-service
With an example: imagine the bie-hub service have some wrong url in your generated /data/ala-bie/config/ala-bie-config.properties in your bie-hub machine. Image that is the collectory url that is pointing to .au url instead of using your collectory url. You can do something like:
grep -r url ansible/roles/bie-hub/templates | grep collectory
that returns:
ansible/roles/bie-hub/templates/bie-hub-config.properties:collectory.baseURL={{ collectory_url | default('https://collections.ala.org.au') }}
to know the name of the ansible variable. So you can add collectory_url var to your inventory with the correct url of your collectory.
If something goes wrong running ansible with -vvvv is a good way to get a detailed output of the failed command and output.
Also check more ways to debug not so verbose: https://docs.ansible.com/ansible/latest/user_guide/playbooks_debugger.html
For instance you can get some error like this running ansible:
Running ansible, I reached this step, with the following error: TASK [biocache-db : ensure cassandra 3.x is running] ***************************
fatal: [demo.livingatlas.org]: FAILED! => {"changed": false, "elapsed": 300, "msg": "Timeout when waiting for 127.0.0.1:9042"}
Or after a machine reboot, your cassandra does not start.
Many times this is because the machine hostname does not match with the cassandra configuration. This is typical if you change the hostname of a machine after running ansible LA inventories or if you virtualization system does not persist correctly your selected machine hostname (this happens often using openstack). Just ensure that /etc/hosts and hostname has the same name that the one used in your ansible cassandra inventory.
Sometimes the service cassandra start does not work because the service was not shutdown correctly (if for instance the VM get out of disk). Try to use before service cassandra stop or service cassandra restart.
A typical occurrence search looking for some occurrence id looks like:
# cqlsh
Connected to ALA at 127.0.0.1:9042.
[cqlsh 5.0.1 | Cassandra 3.11.3 | CQL spec 3.4.4 | Native protocol v4]
Use HELP for help.
cqlsh> use occ;
cqlsh:occ> expand on;
Now Expanded output is enabled
cqlsh:occ> select * from occ where rowkey='4497d99a-21b4-40b0-b709-3f6762c36a53';

@ Row 1
(...)
 day_p                                     | 20
 decimalLatitude                           | 42.83
 decimalLatitude_p                         | 42.83
 decimalLatitudelatitude                   | null
 decimalLongitude                          | -1.72
 decimalLongitude_p                        | -1.72
 defaultValuesUsed                         | false
(...)
cqlsh:occ> exit
So there you can detect things like if some field like the collectionUid_p is not null or the institution to detect wrong data mappings.
Or in one line:
cqlsh -e "expand on; use occ; select cl_p from occ where rowkey='4497d99a-21b4-40b0-b709-3f6762c36a53'"
For administration tasks of solr, tunnel through the firewall using SSH by running ssh -Nf -L 8983:127.0.0.1:8983 solrnode.yourdomain.org
and then visiting http://localhost:8983/solr in a browser
It seems that you are trying to import and index something in bie-index but you didn't send to solr any document to index (typically if you don't have a wordpress or some service ready to index).
Access to your server with an url like
- https://index.example.org/solr/bie/suggest?suggest.build=true Test it with:
- https://index.gbif.es/solr/bie/suggest?suggest.q=whatever More info, for instance here.
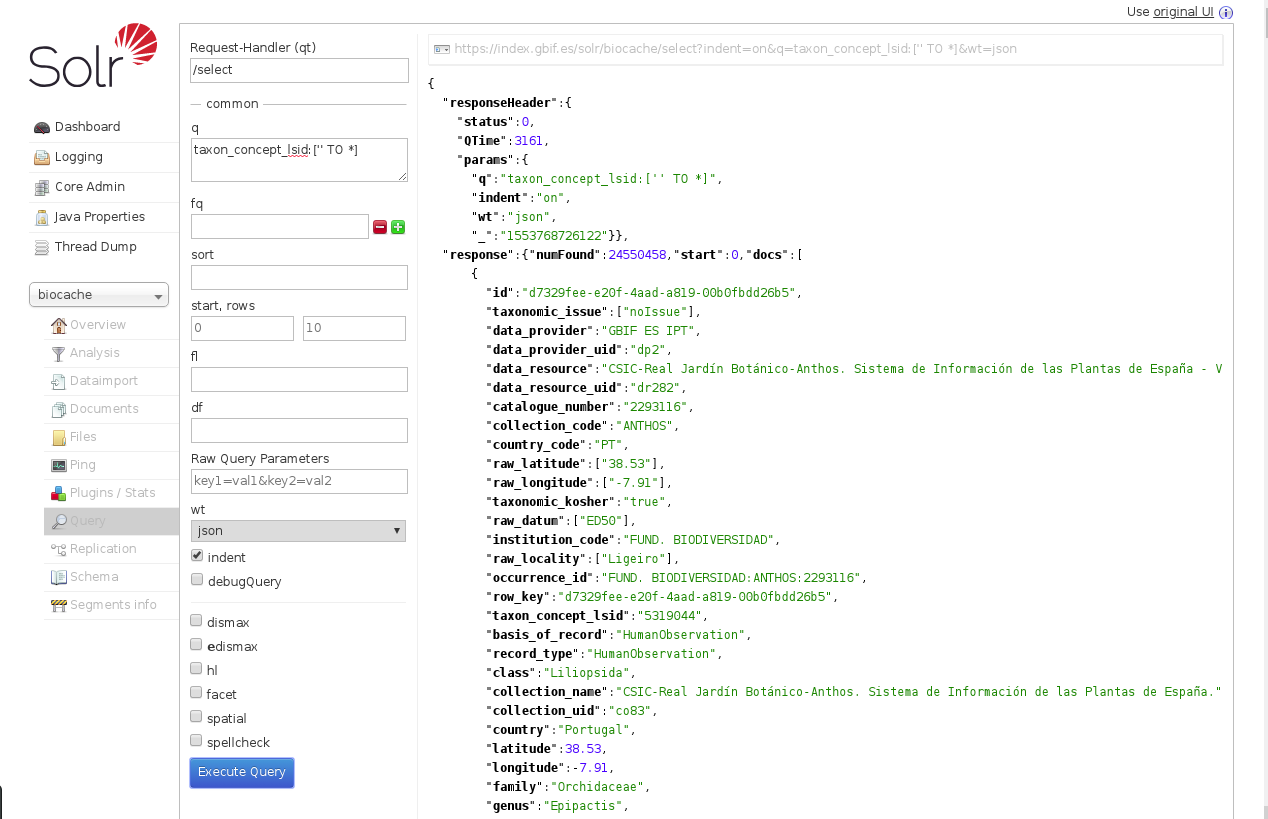
The solr web interface allows to query via a form. This is a good way to test for some indexing of biocache or bie problem.
A basic query like q=*:* to search all occurrences is a good simple test of the health of the index selecting the core you are interested in.
Later you can do more advances queries to check is some field is NULL, or NOT NULL, etc.
Example of basic query in solr to check if taxon_concept_lsid has correct values (NOT NULL):
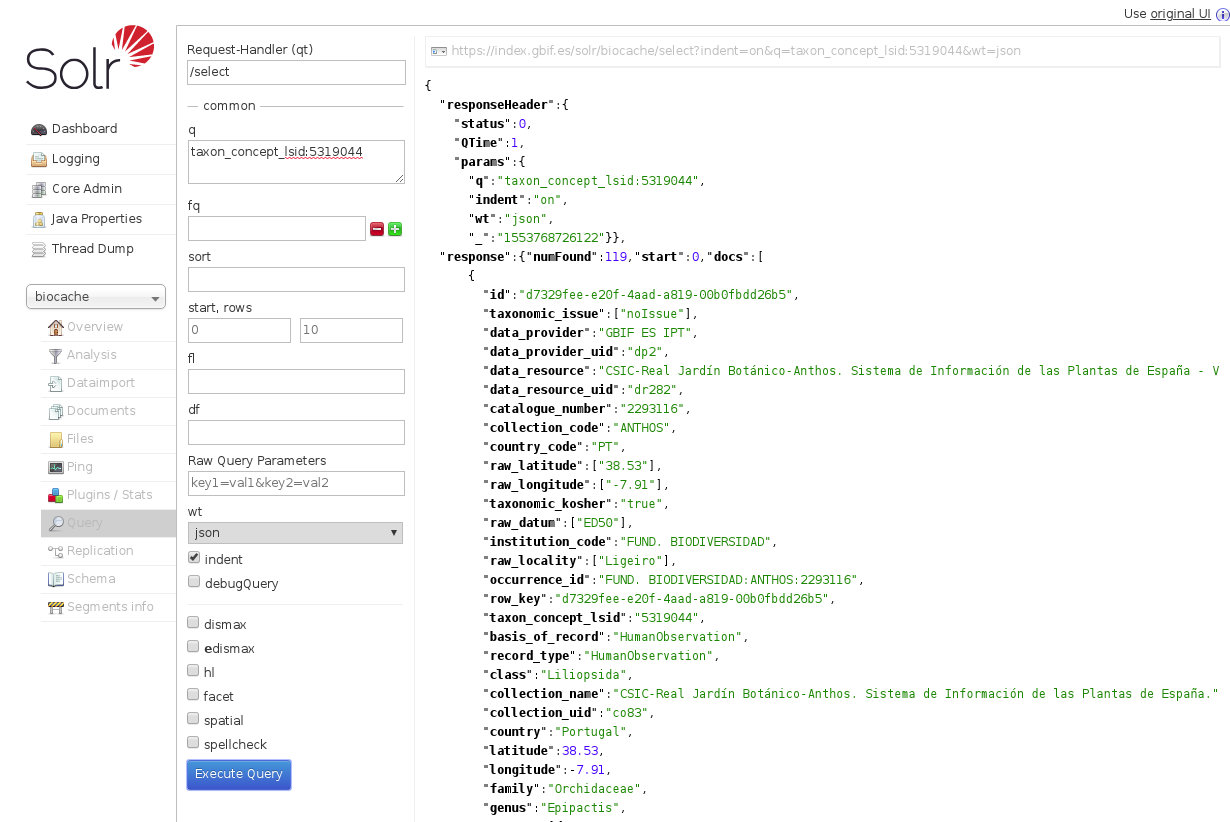
Example of solr query a specific taxon_concept_lsid value:
Sometimes If you want to debug some lucene index (for instance after a biocache-store re-index) a command line tool like clue its useful. Same previous query from the command line using clue:
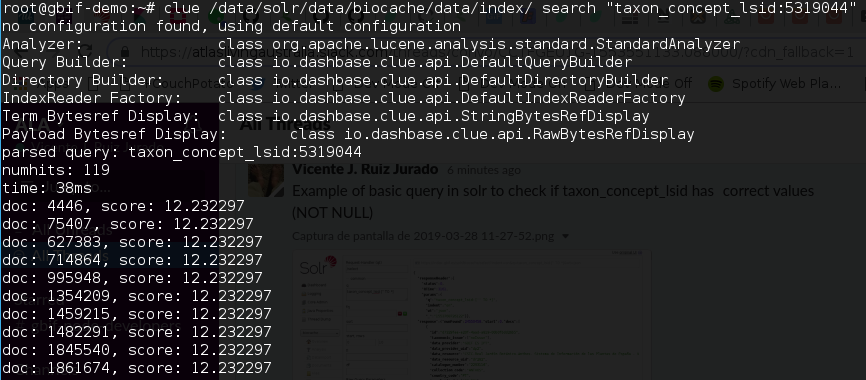
More info: https://github.com/javasoze/clue/
If you do some queries in cassandra and solr and you don't see nothing strange, you can do the same tests via the API, to detect if the API works as expected or not.
See the API wiki page for more info.
If you try to deploy several servers in the same VM, see this section describing how to setup nginx vhost correctly.
If you enable the collectory cache in biocache-service with caches.collections.enabled=true (or caches_collections_enabled=true in your inventory, and you have the collectory and biocache-service in the same server, you can suffer a failed start because you have a circular dependency trying to boot both service at the same time. You'll see in your tomcat's biocache-service.log:
2020-06-03 18:53:43,237 [biocache-ws.l-a.site-startStop-1] ERROR au.org.ala.biocache.util.CollectionsCache (CollectionsCache.java:197) - RestTemplate error: 504 Gateway Time-out org.springframework.web.client.HttpServerErrorException: 504 Gateway Time-out
So, disable the collectory cache.
Despite that weird message, it seems that for some reason biocache-service is not connecting to solr/cassandra at startup. It's somehow also a start dependency problem.
Verify also that the solr cores are correct.
After check that solr and cassandra are working and accessible from you biocache-service VM, you should restart tomcat.
Verify your DNS or /etc/host and check what you have configured in /data/biocache/config for cassandra an solr and try connect with the same names ports. For instance:
$ nc biocache-store.l-a.site 9042 -v
Connection to biocache-store.l-a.site 9042 port [tcp/*] succeeded!

$ nc index.l-a.site 8983  -v
Connection to index.l-a.site 8983 port [tcp/*] succeeded!
Take into account also that cassandra can be more slow starting up that tomcat biocache-service, so this can happen if you start your different servers at the same time and biocache-service starts before your cassandra.
Here you can read more info about how to troubleshoot this biocache-service issue.
This is because the value of sample.fields was set to none in biocache-config.properties file aka sample_fields in your inventory.
You need to get that new layer/field into the solr index, and this is not automatic. Sampling only adds that layer info into cassandra. You have to reindex to get that spatial info into solr.
More info in the sample and index page and in the solr admin page.
You get an error similar to Exception in thread "main" java.lang.Exception: Unable to load resourceUid, a primary key value was missing on record 1
Your resource connection parameters are not configured correctly, check if the DwCtermsthatuniquely identifyarecord is configured correctly:

This is usually a mapping issue. But sometimes if numbers don't match can be an incorrect tabulated data. For instance after renaming some faulty occurrences.txt to occurrences.csv and loading it with libreoffice we see:

⚠️ Legacy: The instructions below apply to legacybiocache-store/biocache-clideployments. For pipelines-based installations, check pipeline logs in HDFS or via the Jenkins for Pipelines jobs.
Change INFO to DEBUG in:

In something like /usr/lib/biocache/biocache-store-2.6.1/etc/log4j.xml or similar version and re-run biocache-cli.
If during the generation of a new index you get this message null has been blacklisted you probably have some empty value in the scientificName column of your DWCA file and this field is mandatory.
If you are using a scientificName in your DWCA including scientificNameAuthoship, you can generate wrong species names in your BIE service with duplicate author names. See this section of nameindexer page for more details.
If you have some unauthorized error, CAS logs has an audit that file that can show you detailed about some lack of roles or perms in your user. For instance, imagine that you have some problem accessing apikey service:
$ grep apikey /var/log/atlas/cas/cas_audit.log
(...)
WHAT: [result=Service Access Granted,service=https://auth.l-a.site/apikey/,principal=SimplePrincipal([email protected], attributes={activated=[1], authority=[ROLE_ADMIN,ROLE_COLLECTION_ADMIN,ROLE_COLLECTION_EDITOR,ROLE_COLLECTORS_ADMIN,ROLE_EDITOR,ROLE_IMAGE_ADMIN,ROLE_SPATIAL_ADMIN,ROLE_SYSTEM_ADMIN,ROLE_USER], city=[Wakanda], country=[WK], created=[2019-04-21 11:04:04], disabled=[0], email=[[email protected]], expired=[0], firstname=[John], givenName=[John], id=[43954], lastLogin=[2019-12-03 07:37:38], lastUpdated=[2019-06-04 19:13:40], lastname=[Ruiz Jurado], legacyPassword=[0], organisation=[GBIF.wk], role=[ROLE_ADMIN, ROLE_COLLECTION_ADMIN, ROLE_COLLECTION_EDITOR, ROLE_COLLECTORS_ADMIN, ROLE_EDITOR, ROLE_IMAGE_ADMIN, ROLE_SPATIAL_ADMIN, ROLE_SYSTEM_ADMIN, ROLE_USER], sn=[Doe], state=[MD], userid=[43954]}),requiredAttributes={}]
(...)
Caused by: org.springframework.beans.factory.UnsatisfiedDependencyException: Error creating bean with name 'pac4jJwtFilter' defined in au.ala.org.ws.security.AlaWsSecurityGrailsPluginConfiguration: Unsatisfied dependency expressed through method 'pac4jJwtFilter' parameter 0; nested exception is org.springframework.beans.factory.UnsatisfiedDependencyException: Error creating bean with name 'pac4jConfig' defined in au.org.ala.web.config.AuthPac4jPluginConfig: Unsatisfied dependency expressed through method 'pac4jConfig' parameter 0; nested exception is org.springframework.beans.factory.UnsatisfiedDependencyException: Error creating bean with name 'bearerClient' defined in au.ala.org.ws.security.AlaWsSecurityGrailsPluginConfiguration: Unsatisfied dependency expressed through method 'bearerClient' parameter 0; nested exception is org.springframework.beans.factory.UnsatisfiedDependencyException: Error creating bean with name 'jwtAuthenticator' defined in au.ala.org.ws.security.AlaWsSecurityGrailsPluginConfiguration: Unsatisfied dependency expressed through method 'jwtAuthenticator' parameter 0; nested exception is org.springframework.beans.factory.BeanCreationException: Error creating bean with name 'oidcProviderMetadata' defined in au.ala.org.ws.security.AlaWsSecurityGrailsPluginConfiguration: Bean instantiation via factory method failed; nested exception is org.springframework.beans.BeanInstantiationException: Failed to instantiate [com.nimbusds.openid.connect.sdk.op.OIDCProviderMetadata]: Factory method 'oidcProviderMetadata' threw exception; nested exception is java.io.IOException: Server returned HTTP response code: 502 for URL: https://auth.l-a.site/oidc/.well-known
If you read the end of the log userdetails get a 502 accesing CAS. Userdetails needs to have CAS running before starting it.
You can experience some throttling issues when trying to upload many requests per second, for instance from iNaturalist.
You can decrease the rate in biocache-store config setting media.store.maxrequests.persec (in ansible: media_store_maxrequests_persec, 10 by default). Notice that this setting seems to be requests/sec/thread so use '--number-of-threads 1' to get ~1/sec. You can increase again later to upload faster from other remote servers.
During the deployment of spatial, geoserver does not start correctly and the deployment of spatial fails. A typical log:
FAILED - RETRYING: [risky-spatial]: wait for geoserver to come up (Ping https://spatial.risky.gbif.pt/geoserver. Check if is spatial.l-a.site in /etc/hosts?) (114 retries left).
Some tips:
- look in the geoserver logs https://github.com/AtlasOfLivingAustralia/documentation/wiki/Logs-location
- Try to access to that
geoserverurl from that VM withwget,curlorlinks. - Verify the resources of the VM (typically memory)
Probably is an SSL issue or (local)
/etc/hostsissue, or something like this. - Assure that tomcat9 has access to the machine's memory by adding the following line to your local-extras.ini:
[spatial:vars]
tomcat_java_opts = -Xmx<Available GB of RAM>g -Xms<Available GB of RAM>g -Xss512k -Djava.awt.headless=true
When I accces to https://myspatial.l-a.site/ws/manageLayers/uploads I get an simple Error page. In the tomcat logs I can see a Wrong magic number, expected XXXX, got YYYY. Goto /data/spatial-data/uploads/ and move the last directory layer you created:
root@vm-022:/data/spatial-data/uploads# ls -lrta
total 44
drwxr-xr-x  2 tomcat7 tomcat7 4096 Apr  8 14:25 1586355605808
drwxr-xr-x  8 tomcat7 tomcat7 4096 Apr  8 14:25 ..
drwxr-xr-x  2 tomcat7 tomcat7 4096 May 29 13:17 1590758233964
drwxr-xr-x  2 tomcat7 tomcat7 4096 May 29 19:33 1590780637924
drwxr-xr-x  2 tomcat7 tomcat7 4096 May 29 19:35 1590780757437
drwxr-xr-x  2 tomcat7 tomcat7 4096 May 29 19:55 1590759518368
drwxr-xr-x  2 tomcat7 tomcat7 4096 May 29 21:44 10001
drwxr-xr-x  2 tomcat7 tomcat7 4096 May 29 21:56 1590768725781
drwxr-xr-x  2 tomcat7 tomcat7 4096 May 29 22:03 1590789492141
drwxr-xr-x 11 tomcat7 tomcat7 4096 Aug  3 15:58 .
drwxr-xr-x  2 tomcat7 tomcat7 4096 Aug  3 18:22 1596470330070
and move it with: mv /data/spatial-data/uploads/1596470330070 /tmp, and refresh the upload page. The error should gone. Verify that the uploaded layer has the correct contents in the zip.
If you get an error like org.geoserver.platform.ServiceException: Could not find layer st_2022 try to use a layer "Diplay name" without underscore. Avoid this:

and use these names without underscore instead:

You can enable flyway debug logs adding to /data/cas/config/log4j2.xml (or similar in other modules):
<AsyncLogger name="org.flywaydb" level="debug" />
The ala-sensitive-data-service package fails to install:
TASK [sensitive-data-service : Install the ala-sensitive-data-service package]
fatal: [risky-nameserver]: FAILED! => {
  ...
  "msg": "'/usr/bin/apt-get ... install 'ala-sensitive-data-service=1.2-SNAPSHOT+0~20230216033437.18~1.gbp9904d8'' failed:
W: --force-yes is deprecated, use one of the options starting with --allow instead.
E: Sub-process /usr/bin/dpkg returned an error code (1)",
  ...
  "stdout_lines": [
    ...
    "ala-sensitive-data-service is already the newest version (1.2-SNAPSHOT+0~20230216033437.18~1.gbp9904d8).",
    "Setting up ala-sensitive-data-service ...",
    "Downloading SDS configs...",
    "dpkg: error processing package ala-sensitive-data-service (--configure):",
    " installed ala-sensitive-data-service package post-installation script subprocess returned error exit status 60",
    "Errors were encountered while processing:",
    " ala-sensitive-data-service"
  ]
}
This happens because the Debian package attempts to configure the ala-sensitive-data-service by downloading some XML files from the SDS service and spatial service.
See the post-install script here: 👉 ala-sensitive-data-service.postinst
If those services (SDS and spatial services) are not running in your portal, the installation will fail.
Workaround:
- Preferred solution: Ensure the SDS and spatial services are already up and running in your environment.
Shortcut:
- Install the package manually with
apt install. When prompted for the SDS URLs, provide the ones from ALA. Once your own equivalent tosds.ala.org.auandspatial.ala.org.auis working, reconfigure the package to use your portal’s URLs.
- https://wiki.apache.org/tomcat/FAQ/Troubleshooting_and_Diagnostics
- https://cassandra.apache.org/doc/latest/troubleshooting/
- https://wiki.apache.org/solr/SolrPerformanceProblems
- https://docs.geoserver.org/latest/en/user/production/troubleshooting.html
- https://docs.geoserver.org/stable/en/user/geowebcache/troubleshooting.html