Dynamic Volume Lines - 3dct/open_iA GitHub Wiki
images/tools_DynamicVolumeLines.png
The comparison of many members of an ensemble is difficult, tedious, and error-prone, which is aggravated by often just subtle differences.
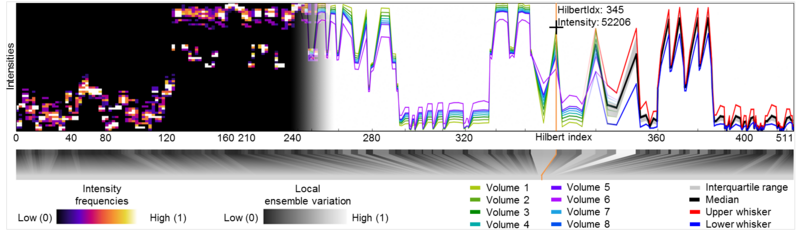
The Dynamic Volume Lines tool allows an interactive visual analysis of sets of 3D volumes. Each volume is linearized along a Hilbert space-filling curve into a 1D Hilbert line plot, which depicts the intensities over the Hilbert indices. We present a nonlinear scaling of these 1D Hilbert line plots based on the intensity variations in the ensemble of 3D volumes, which enables a more effective use of the available screen space. The nonlinear scaling builds the basis for our interactive visualization techniques. An interactive histogram heatmap of the intensity frequencies serves as overview visualization. When zooming in, the frequencies are replaced by detailed 1D Hilbert line plots and optional functional boxplots. To focus on important regions of the volume ensemble, nonlinear scaling is incorporated into the plots. An interactive scaling widget depicts the local ensemble variations. Our brushing and linking interface reveals, for example, regions with a high ensemble variation by showing the affected voxels in a 3D spatial view.
Video: https://youtu.be/rRLddk65Q68
Publication: Johannes Weissenböck, Bernhard Fröhler, Eduard Gröller, Johann Kastner, and Christoph Heinzl: "Dynamic volume lines: Visual comparison of 3D volumes through space-filling curves", IEEE Transactions on Visualization and Computer Graphics, Vol. 25, No. 1, Jan. 2019, doi: 10.1109/TVCG.2018.2864510.
See also the DynamicVolumeLines module code.
Back to Tools.