Baselining ‐ Prophet decomposition - yadijustforfun/SP-transition GitHub Wiki
Prophet Decomposition: Overview
Prophet (developed by Facebook/Meta) is a forecasting tool designed for time series data with trends, seasonality, and holidays. Its decomposition feature breaks down a time series into interpretable components:
- Trend (long-term growth/decline).
- Seasonality (weekly, yearly, or custom patterns).
- Holiday Effects (impact of special events).
- Residuals (noise not explained by the model).
When to Use Prophet Decomposition
-
Interpretability
- You need to understand how trends, seasonality, and holidays affect your data (e.g., retail sales, web traffic).
- Example: Decomposing daily Uber rides to see weekly peaks (weekends) and yearly trends.
-
Forecasting with Regular Patterns
- Works best when data has strong, predictable seasonality (e.g., electricity demand, airline passengers).
-
Handling Missing Data & Outliers
- Robust to gaps and abrupt changes (unlike traditional ARIMA).
-
Quick Prototyping
- Requires minimal configuration compared to SARIMA or deep learning (LSTMs).
-
Including External Regressors
- Can add holiday calendars or custom events (e.g., Black Friday sales).
When NOT to Use Prophet Decomposition
-
High-Frequency Data (e.g., seconds/minutes)
- Designed for daily/weekly/monthly data. Use Fourier transforms or LSTMs for sub-daily patterns.
-
Irregular or Complex Seasonality
- Fails if seasonality changes abruptly (e.g., crypto prices). STL or TBATS may work better.
-
Non-Additive Trends
- Assumes additive seasonality by default (use
multiplicative=Truefor multiplicative trends).
- Assumes additive seasonality by default (use
-
Large-Scale Multivariate Forecasting
- Prophet is univariate. For multivariate dependencies, use VAR or neural networks.
-
Very Short Time Series
- Needs at least 1-2 seasonal cycles (e.g., 2 years of monthly data).
Example: Prophet Decomposition in Python
from fbprophet import Prophet
import pandas as pd

# Sample data (Yahoo Finance-style CSV)
df = pd.read_csv('https://raw.githubusercontent.com/facebook/prophet/main/examples/example_wp_log_peyton_manning.csv')

# Fit model
model = Prophet(seasonality_mode='additive')
model.fit(df)

# Decompose
future = model.make_future_dataframe(periods=365)
forecast = model.predict(future)

# Plot components
fig = model.plot_components(forecast)
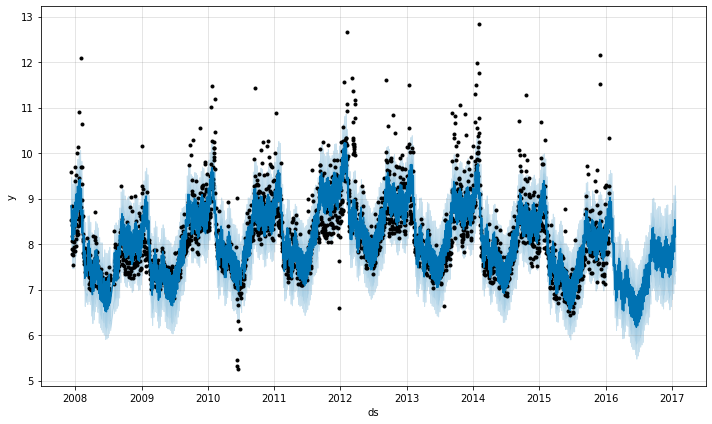
Output Plots:
- Trend (overall growth).
- Weekly Seasonality (e.g., higher usage on weekends).
- Yearly Seasonality (if data spans multiple years).
Alternatives to Prophet
| Use Case | Better Tool |
|---|---|
| High-frequency data | Fourier Methods, LSTMs |
| Complex seasonality | STL, TBATS |
| Multivariate forecasting | VAR, Neural Nets |
| Sparse data | Gaussian Processes |
Key Takeaways
- Use Prophet for interpretable, seasonal, univariate forecasts with holidays.
- Avoid Prophet for high-frequency, multivariate, or irregularly changing patterns.
- Always validate with out-of-sample tests (e.g.,
cross_validationin Prophet).
Controlling Factors in Prophet
How Controlling Factors Are Captured
- Explicit Regressors: Prophet allows direct inclusion of known control variables (e.g., marketing spend, temperature) via
add_regressor(). - Holidays/Events: Modeled as binary indicators (e.g.,
1on Black Friday). - Linear or Nonlinear Effects: By default, regressors have linear effects, but custom adjustments can capture nonlinear relationships.
Why This Works
- Interpretability: Each regressor’s contribution is quantified with clear coefficients.
- Uncertainty Estimation: Provides posterior intervals for regressor impacts (if using MCMC).
- Flexibility: Handles missing data and supports dynamic regressors (time-varying effects).
Can You Read Out Contributions?
- Yes, explicitly:
plot_components(): Visualizes marginal effects of each regressor.- Forecast DataFrame: Columns like
regressor_effectshow the contribution over time.
- Example:
model.plot_components(forecast) # Shows holiday + regressor impacts
When to Use Prophet
- Known controls (e.g., promotions, weather).
- Interpretable forecasts (need to explain driver contributions).
- Univariate time series with external factors.
Limitations
- Univariate only: No native support for multivariate dependencies.
- Linear assumptions: Nonlinear effects require manual feature engineering.
Key Takeaway
Prophet excels when you need transparent, quantifiable control factors (e.g., "Marketing spend increased sales by 10% ± 2%"). Use it for business-friendly explanations over latent methods like ALS.