Calculating Lat Lon areas - wri/gfw-analysis GitHub Wiki
Preliminary considerations
Pixels of datasets stored in lat/ lon have a consistence width and height in degree; however their geodesic area varies depending on latitude -> The further away from the equator, the smaller the pixel area.
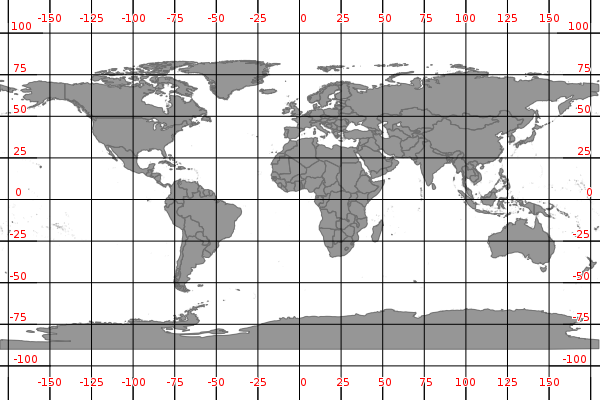
To understand why, have a look at the graphs below.
Graph one shows the earth on a regular lat/ lon grid. Distances between parallels and meridians are equal though-out the grid.
Graph two shows the earth ellipsoid sliced along the meridians. Degrees are represented according to their actual size. Distances between parallels stays equal, distances between meridians changes with latitude.

To conclude, pixels of higher latitude are "strechted" for gap-less visualization when represented in a lat/ lon grid. Pixels at a lower latitude represent a larger area than pixels of similar size at higher latitude.
Unlike for projected datasets, which have metric units, we cannot use normal area calculation tools when working with lat/ long datasets. Output would be in degree which cannot be directly linked to a geodesic area. In fact, we need to calculate areas per pixel.
#Workflow
This tutorial covers the main steps for calculating areas per pixel in ArcGIS using the example of forest loss data.
1) Calculate pixel area for raster dataset
Use the geodesy toolbox to calculate pixel area for any lat/ lon dataset based on geodesic formulars: https://github.com/wri/geodesy
For you convenience, areas for Hanson 2012 and Hanson 2013 global datasets are already precalculated and can be downloaded here.
Area rasters follow the same naming convention as Hanson datasets using upper left corner coordinates as identifier. There is one area tile for each Hanson tile.
2) Define you area of interest
For your area calculation you will need an area of interest. This can be for example a feature class containing one or many polygons.
3) Create mask raster
You will need to create a mask layer from pixels which should be included in the area calculation (ie all tree cover loss pixels for a specific year).
Use the reclassify tool (Spatial Analyst tool -> Reclass -> Reclassify).
Reclass pixels which should not be included in your calulation to NoData, reclass all other values to 1.
For example, if you want to calculate the area for tree cover loss for the years 2006 - 2013, reclass values 0-5 to NoData and 6-13 to 1.
If you want to calculate the area of total tree cover loss, reclass value 0 to NoData and 1-13 to 1
4) Calculate zonal statistics
Calculate zonal statistics (Spatial Analyst Tools -> Zonal -> Zonal statistics as table)
Use the following parameters:
Input raster or feature zone data: Select your feature class (polygon layer)
Zone field: Select an attribute of your feature class which uniquely identifies the zone. A zone can consist of one or many polygons. For the latter, make sure that all polygons for that zone of the same attribute value.
Input value raster: Select you area raster
Output table: Select an output table. This should be located in a file or personal geodatabase.
Ignore NoData in calculation: keep checked
Statistic type: SUM
Environments... -> Raster analysis -> Mask: Select your mask layer
The output will give you the total area of all pixels in you mask layer which fall into your area of interest.
If you want to calculate areas for different years you will need to create mask layers for each year and run the zonal statistic tool several time.
Afterwards you will need to join results into one table. You can to that by creating attribute joins between the output tables using the zone field as join field.