maxbotix recipe - weewx/weewx GitHub Wiki
This is a guide to use a Maxbotix ultrasonic sensor to measure water level. The ultrasonic sensors can measure the amount of water in a tank, the tide height, or even snow depth.
Maxbotix makes many different models of ultrasonic sensor. The sensor capabilities vary in the resolution of measurements, the minimum distance between sensor and object, the maximum range, and the beam width. Other options include the communication protocol and form factor. There are even options for factory-applied coatings to inhibit corrosion.
This guide uses the MB7363 HRXL-MaxSonar-WRLS, which has the following characteristics:
- resolution: 1 mm
- detection: first target
- range: 500-9999 mm
- beam angle: moderate
- read rate: 6 Hz
- communications: RS232
Data collection happens on a computer to which the sensor is attached. The computer can be a raspberry pi, an intel NUC, or any other device that (1) can run weewx, and (2) has a serial port and/or USB port.
Note that this configuration does not have a data logger; when the computer is off, no data are collected. So be sure to put the computer on a UPS that has enough battery to get through the longest anticipated power outage. Even better, put the computer on a battery that is connected to a solar panel or other renewable energy source.
The recipes in this guide assume a Debian-like operating system. The syntax will be slightly different for other operating systems, but the principles and steps are the same.
 MB7363 |
||
 Tide monitoring. Ultrasonic sensor is cantilevered from the back of a utility panel on the ferry dock, about 8 feet above mean high tide. Tide range is 10-12 feet. |
 Tide monitoring. Ultrasonic sensor is mounted under the fixed portion of a dock, about 3 feet from a granite wall. Tide range is 10-12 feet. |
 Tide monitoring. Ultrasonic sensor is mounted under the bridge between shore and granite pier. Tide range is 10-12 feet. |
 Four 500 gallon water tanks, selectively connected by pipes and valves at their bases. Water from a quarry is pumped up a 300 foot hill to these tanks. Each tank has a sensor. |
 Tank sensor. Each sensor points down at the water surface, mounted in a PVC pipe on top of each tank. A single cat5e ethernet cable provides 4 twisted pairs for the signal and ground to each of four sensors. A 5V bus from a step-down transformer provides power to each sensor (the black wires). |
 Tank sensor wiring. There is a 4-port USB-serial adapter that connects a single USB port on the RPi to 4 ultrasonic sensors. There is a pair of twisted pair wires to each sensor, using standard cat5e ethernet cable. Power to each sensor is supplied by a common 5V bus (black wires). |
| cost | description | model | source |
|---|---|---|---|
| $138 | sensor | MB7363 | https://maxbotix.com/products/mb7363 |
| $78 | computer | RPi 3B+ | https://www.amazon.com/ELEMENT-Element14-Raspberry-Pi-Motherboard/dp/B07BDR5PDW/ |
| $10 | wire | https://www.amazon.com/CIMPLE-CO-Thermostat-Residential-Commercial/dp/B07SZ5D3SH | |
| $0.25 - $5 | DB9 connector | https://www.amazon.com/Breakout-Connector-Serial-Terminal-Female/dp/B073RGGDKH | |
| $0.25 - $3 | USB connector | https://www.amazon.com/Jienk-Terminal-Connector-Pluggable-Converter/dp/B0914Y1GXD | |
| $12 | USB-serial | FTDI | https://www.amazon.com/Adapter-Chipset%EF%BC%8CDB9-Serial-Converter-Windows/dp/B0759HSLP1 |
| $40 | 4-port USB-serial | FTDI | https://www.amazon.com/Gearmo-Serial-Windows-Certified-Drivers/dp/B004ETDC8K |
Prices are US$ as of April 2023.
To prototype a system, you might want the DB9 and USB connectors with screw terminals. Later you can replace these with soldered connectors, or connectors with watertight housings.
The sensor terminals are solder-only. Soldering onto these terminals is perhaps the most difficult part of the entire build. Be sure to use flux/resin!
If you have to use a USB-serial adapter, be sure to get a real FTDI-compatible device. Many knock-offs do not have a serial number. That may be OK if your system has only one sensor, but if you ever have to use multiple sensors, you will want the serial number so that you can uniquely identify each sensor.
Connect the sensor to a serial port on the computer. For the RS232 part, there are two approaches: (1) direct serial connection, or (2) serial via USB-serial adapter.
The sensor requires 5V power, so get that from one of the USB ports on the computer, or use a transformer to step down from your 12V or 24V supply.
If you have the external temperature sensor, then connect that as well.
 wiring diagram, with temperature sensor |
||
 MB7363 wiring. You will need three conductors: 5V power, ground, and signal. Adding temperature correction will require one more conductor. |
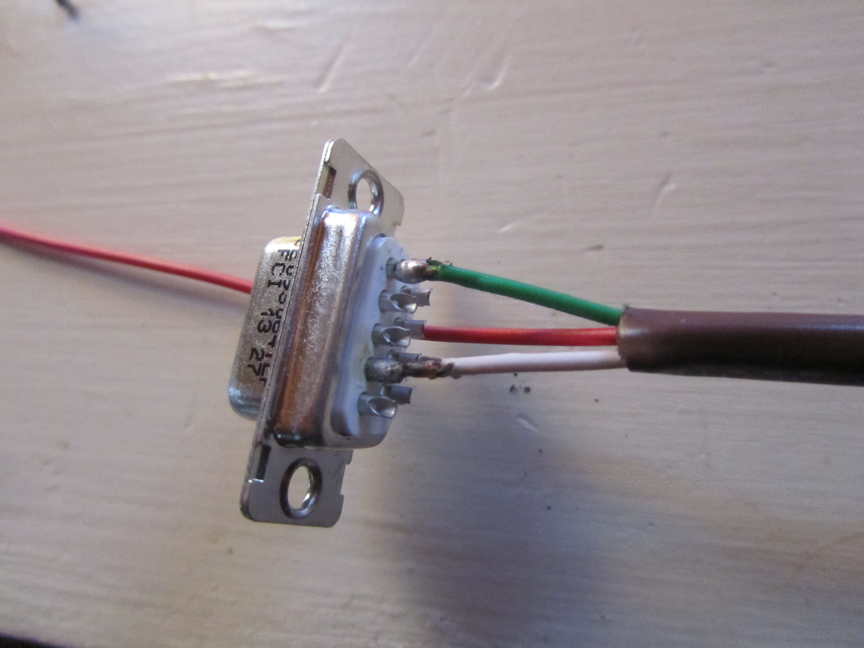 DB9 connector. Use only two pins on a DB9 connector: RXD and GND. |
 Power from USB. One approach for power is to use the 5V pin from a USB port. If you do this and a USB-serial adapter, then you'll end up with two USB connectors at the computer end, then three wires going to the sensor. |
 Ultrasonic sensor wiring with an external temperature sensor. |
 This example draws power from a USB port on the computer, and does signaling using a serial port. |
Verify the sensor operation by reading directly from the serial port. The screen tool is perhaps the easiest way to do this. If it is not already on your system, install it with your system's package manager:
sudo apt install screen
The first thing you must do is determine to which port the sensor is connected. If the sensor is connected directly to a serial port, then the port will be /dev/ttyS0 or /dev/ttyS1 on most x86_64 systems running linux. On ARM systems running linux, the serial port will be /dev/ttyAMA0 or /dev/ttyS0, or there might be a symlink /dev/serial0 or /dev/serial1.
Assuming that the sensor is connected to the first serial port, then invoke screen with the port as the only arguement, like this:
sudo screen /dev/ttyS0
The sudo is probably necessary, since non-privileged users are typically not allowed to write to the serial ports in a default system configuration.
When screen is running, you should see output like this:
R1034
Place an object in front of the sensor, then move it closer to and further from the sensor. You should see the number change as you move the object.
To quit screen, type ctrl-a k, then type y in response to the prompt.
When you install weeWX, select Simulator when prompted for the station type. You will change it later to Maxbotix.
# Install weeWX
wget -qO - http://weewx.com/keys.html | sudo apt-key add -
wget -qO - http://weewx.com/apt/weewx.list | sudo tee /etc/apt/sources.list.d/weewx.list
sudo apt-get update
sudo apt-get install weewx
First install the weewx-maxbotix extension, configure it to use the port that you identified when you tested the sensor, verify that the weewx-maxbotix driver emits the correct data, then configure a weewx database to receive the data.
When you configure the weewx-maxbotix extension, you must specify two things: (1) which port to use, and (2) the sensor type. The sensor type determines the minimum and maximum ranges, as well as the units of measurement.
# Shut down weeWX
sudo systemctl stop weewx

# Install weewx-maxbotix extension
sudo weectl extension install https://github.com/matthewwall/weewx-maxbotix/archive/master.zip

# Configure weewx to use the maxbotix sensor
sudo weectl station reconfigure
Now verify that the driver can read the sensor.
# Verify that the weewx-maxbotix driver can read the sensor
sudo PYTHONPATH=/usr/share/weewx python /usr/share/weewx/user/maxbotix.py --port /dev/ttyS0 --test-sensor
# If that worked, then verify that the driver emits packets
sudo PYTHONPATH=/usr/share/weewx python /usr/share/weewx/user/maxbotix.py --port /dev/ttyS0 --test-driver
In order to retain data, you must either add a column to an existing weewx database, or create a new weewx database with only the range data for the sensor. The instructions below are for the latter.
The following changes go in the weewx configuration file. Specify a simple range schema in the DataBindings, and specify a bespoke maxbotix database in the Databases stanza.
[DataBindings]
    [[wx_binding]]
        database = archive_sqlite
        table_name = archive
        manager = weewx.manager.DaySummaryManager
        schema = user.maxbotix.schema

[Databases]
    [[archive_sqlite]]
        database_name = maxbotix.sdb
        database_type = SQLite
Run weewx directly to see what the driver is feeding into weewx.
sudo weewxd /etc/weewx/weewx.conf
You should see output something like this:
LOOP:   2023-04-24 10:59:03 EDT (1682348343) 'dateTime': '1682348343', 'range': '225.31496062992125', 'usUnits': '1'
LOOP:   2023-04-24 10:59:04 EDT (1682348344) 'dateTime': '1682348344', 'range': '224.37007874015748', 'usUnits': '1'
LOOP:   2023-04-24 10:59:05 EDT (1682348345) 'dateTime': '1682348345', 'range': '223.4251968503937', 'usUnits': '1'
LOOP:   2023-04-24 10:59:06 EDT (1682348346) 'dateTime': '1682348346', 'range': '224.37007874015748', 'usUnits': '1'
Now that the data collection is working, run weewx as a daemon:
sudo systemctl start weewx
The last thing to do is verify that you can see the data in reports. You will have to add a range field to any textual displays, and configure the ImageGenerator to plot the range over time. You can do this by extending the Seasons skin, or you can create a standalone skin just for plotting whatever it is that you are measuring.
TODO: add instructions for extending seasons
TODO: add a sample 'tide' skin
If you use the weeWX reporting infrastructure, you should end up with plots something like this:

If you configure weewx to feed the data into influx (use the weewx-influx extension), then you can see the data in grafana like this:

For tide monitoring, I find it useful to record both loop data and archive data. This is especially useful when a station is first installed - you an use the high-frequency sampling to see if there are reflections or water-surface reflections that might be skewing any 5-minute averages.
After all that work comes the easy (?) part - calibrating to any offsets, and possibly transforming the data into units that are easier to understand.
For a tide station, you will want to convert the measurement to a unit system for your region, and you will want to apply an offset so that the measurement is relative to some baseline, such as mean high or mean low tide.
For a tank sensor, you will probably want to convert to litres or gallons.
Although you can do conversions within weewx (see the StdCalibrate section of the weewx configuration), you might want to do it at the display level instead. The guiding principle here is to keep the data measurements as 'clean' as possible, and apply any transformations as late as possible in any processing.
Snow measurements are more complicated. The ultrasonic sensor will measure snow depth, but there are many types of snow. A given depth of wet snow is not the same as the same depth of dry snow. So consider adding a rain bucket with heater so that you measure not only snow depth, but also water volume. Also, you will probably want some way to clear the snow deck, or otherwise accurately measure snow deltas. That way you can isolate one day's snowfall from possibly ocompacted snow from previous days.
Do not embed the sensor in a small-diameter pipe. Ensure that the sensor is spaced sufficiently far from any walls or other obstructions that might interfere with the ranging. See the Maxbotix specification for each sensor to see how wide/narrow the nominal beam is.
Remember that every sensor has a minimum range. For many of the sensors, that is around 30 cm. In practice, this often means that you will have to mount the sensor above or outside the tank in which you are trying to measure, typically with a pipe to provide the extension.
When deploying sensors in a corrosive environment, apply a thin silicone coating to the sensor membrane.
 Corrision from chlorine. This sensor was deployed 2 feet above the maximum water level in a tank of fresh water. Chlorine was added to the water as it was pumped into the tank, at an amount specified by the state to ensure quality drinking water. This is corrosion after 4 years of sensing, with the tanks empty during the winter months. |
 Corrosion from exposure to saltwater spray. This sensor was mounted 2 feet above the mean high tide level. The salt encrustation developed after only 6 months, and pitted the sensor membrane to the point where it would no longer range. The spider was also interfering with the ranging. |
When measuring in cold temperatures, consider adding the external temperature sensor (also sold by Maxbotix). The speed of sound in cold air is not the same as the speed of sound in warm air, and an external temperature sensor lets the maxbotix sensor adjust its measurements based on the air temperature.