Logging, Monitoring and Tracing with ELK - vinhtbkit/bkit-kb GitHub Wiki
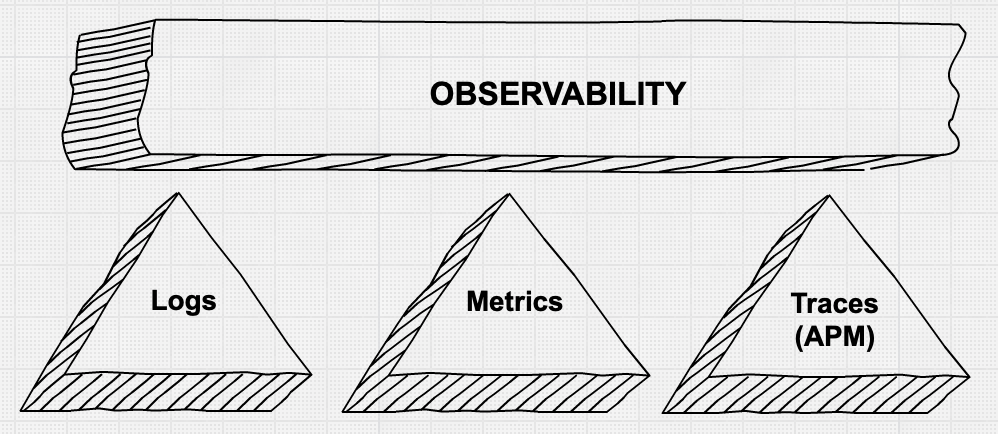
Three Pillars of Observability
Source: https://www.elastic.co/blog/observability-with-the-elastic-stack
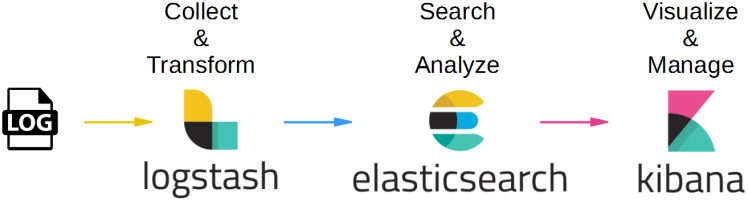
ELK Stack Overview
Logstash
It is a data processing pipeline tool that collects, transforms, and enriches data from multiple sources and sends it to Elasticsearch or other destinations.
Elasticsearch
Free Java-based, open source, RESTful search engine designed, built, distributed and licensed by Apache. It can perform diverse indexing, search and analysis functions using common RESTful APIs and JSON files.
Index
It is a data structure used by Elasticsearch to store and manage data. It contains a collection of documents, which are stored and indexed based on their content.
Kibana
It is a data visualization and exploration tool that provides an interface to analyze and visualize data stored in Elasticsearch. It helps users to create interactive dashboards, charts, and graphs to explore and analyze data.
Why ELK?
Scalability
Elasticsearch is designed to be highly scalable and can handle large volumes of data with ease. This makes it a great choice for organizations that need to store and analyze vast amounts of data.
Real-time analytics
Elasticsearch provides real-time search and analytics capabilities, allowing users to monitor and analyze data as it's generated. This makes it an ideal tool for use cases that require real-time monitoring, such as cybersecurity and website analytics.
Data visualization
Kibana provides a powerful interface for creating custom dashboards, visualizations, and reports. This makes it easy for users to explore and analyze data and share insights with others.
Open source
The ELK stack is open source and freely available, making it accessible to organizations of all sizes and budgets. It also has a large and active community of users and developers, which means that there are a lot of resources available to help users get started and troubleshoot any issues.
Flexibility
The ELK stack is highly customizable and can be tailored to meet the specific needs of different organizations and use cases. For example, Logstash can be configured to collect data from a wide range of sources, while Elasticsearch can be configured to store data in a variety of formats and structures.
Logging with ELK
Monitoring with ELK
Log Monitoring
With Logstash and Elasticsearch, the ELK stack can be used to monitor logs generated by servers, applications, and other systems. Log data can be collected using Beats or other log collectors, then processed and indexed in Elasticsearch for easy searching and analysis. Kibana can then be used to visualize log data and identify patterns, anomalies, and issues.
Metric Monitoring
The ELK stack can also be used to monitor system and application metrics using Metricbeat or other collectors. Metric data can be collected and indexed in Elasticsearch, and visualized in Kibana to track trends and identify performance issues.
Infrastructure Monitoring
With the help of various Beats modules, the ELK stack can be used to monitor infrastructure, including servers, containers, cloud services, and network devices. This can help identify issues and anomalies, and facilitate troubleshooting and performance optimization.
Alerting
ELK stack can be configured to send alerts based on predefined thresholds, patterns, or anomalies. This enables proactive monitoring and can help reduce response time to issues or anomalies.
Distributed Tracing
Why
Latency tracking
One user request or transaction can travel through many different services in different runtime environments. Understanding the latency of each of these services for a particular request is critical to the understanding of the overall performance characteristics of the system as a whole, and provides valuable insight for possible improvements.
Root cause analysis
Root cause analysis is even more challenging for applications that build on top of large ecosystems of microservices. Anything can go wrong with any of the services at any time. Distributed tracing is of crucial importance when debugging issues in such a system.
Basics

Open Tracing

The OpenTracing Data Model
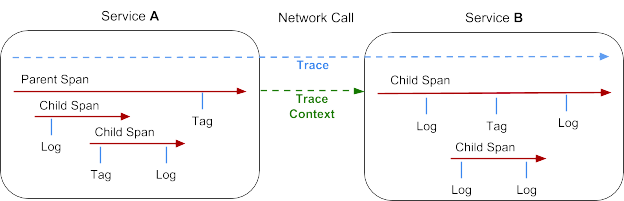
Trace
Represents a transaction as it moves through a distributed system. It can be thought of as a directed acyclic graph of Spans.
Span
Represents a logical unit of work that has a name, start time, and duration. Spans may be nested and ordered to model relationships. Spans accept key:value tags as well as fine-grained, time-stamped, structured logs attached to the particular span instance.
Trace context
Trace information that accompanies the distributed transaction, including when it passes the service to service over the network or through a message bus. The context contains the trace identifier, span identifier, and any other data that the tracing system needs to propagate to the downstream service.
Elasticsearch APM

APM Agent
They instrument your code and collect performance data and errors at runtime. This data is buffered for a short period and sent on to APM Server.
APM Server
Receives trace data from the agents and processes it to create a transaction trace. It also correlates trace data from different sources to create a complete view of a transaction as it passes through different services and components.