Example data set using Fiji - vanTeeffelenLab/ExTrack GitHub Wiki
Once you have installed Fiji and the TrackMate-Extrack plugin (see https://github.com/vanTeeffelenLab/ExTrack/wiki/Install-ExTrack-with-Fiji to proceed to the installation), downdload the TrackMate xml file simulated_tracks.xml (https://github.com/vanTeeffelenLab/ExTrack/blob/main/simulated_tracks.xml).
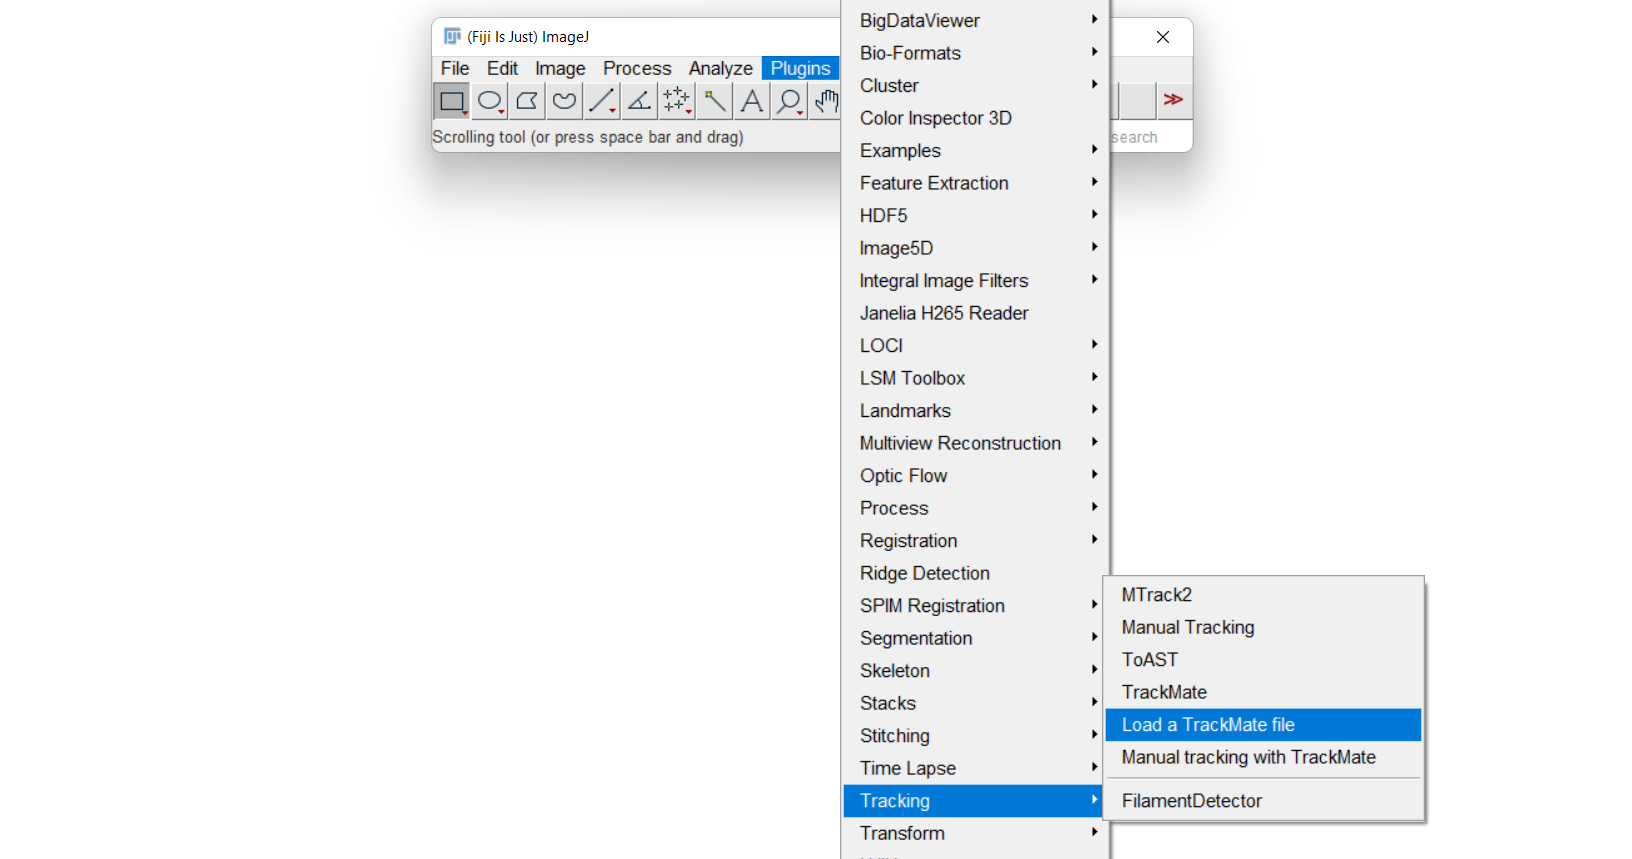
Open Fiji, in Plugins scroll to select Tracking, then Load a TracMate file:
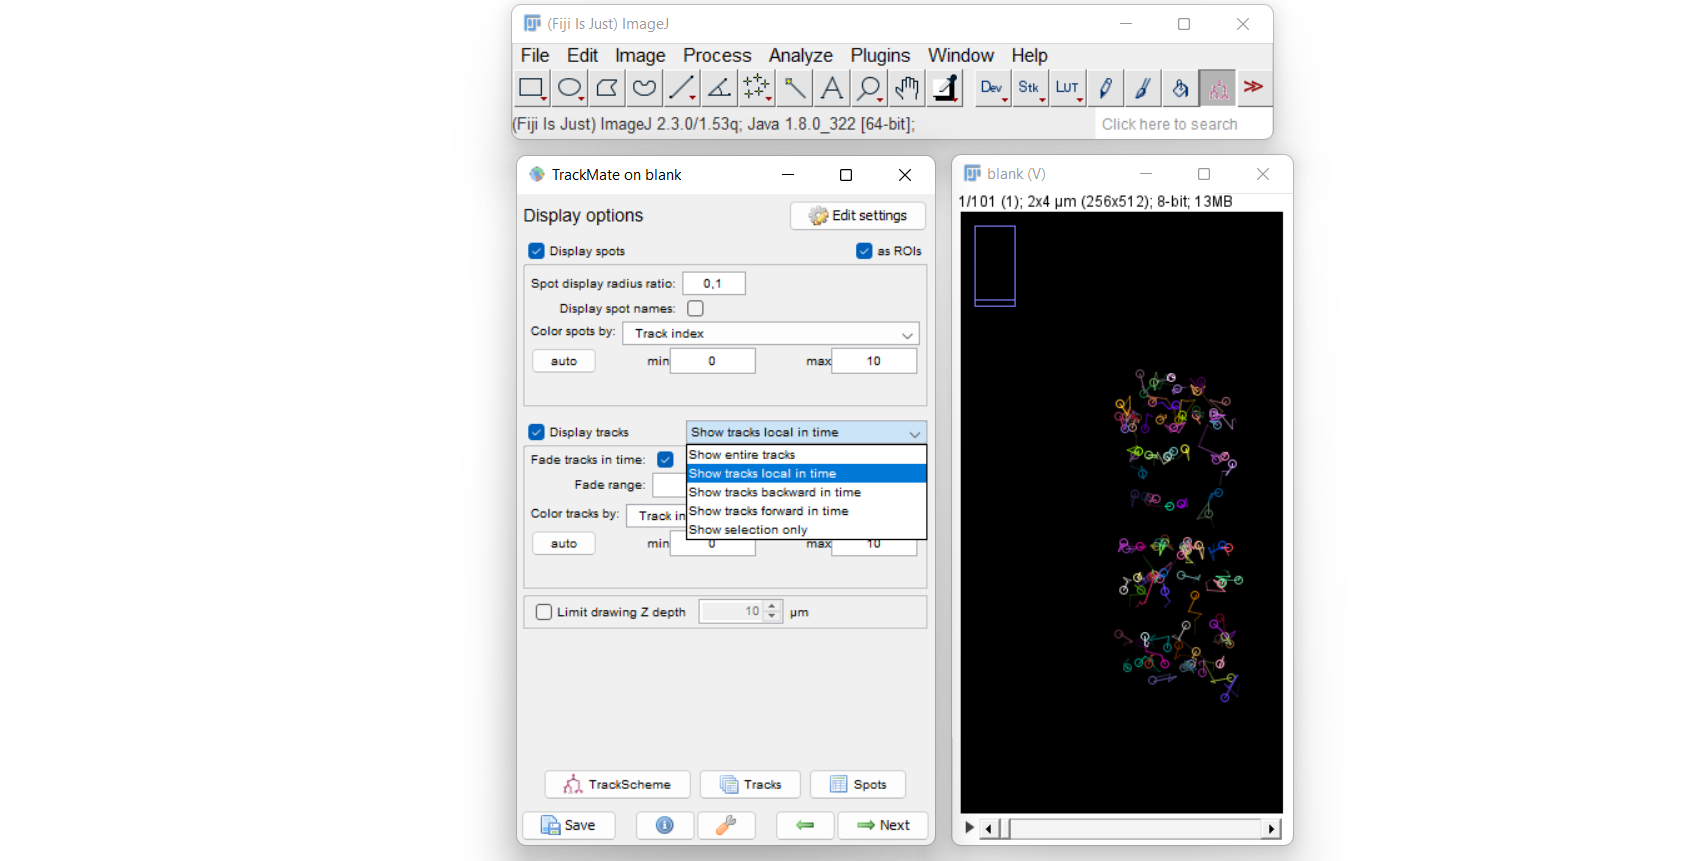
Open the file simulated_tracks.xml. Raw tracks colored according to track ID will then appear.
Display mode can be tuned changing Show tracks local in time to Show tracks backward in time with fade range of 30 time points, for instance, to see the 30 last displacements of tracks.
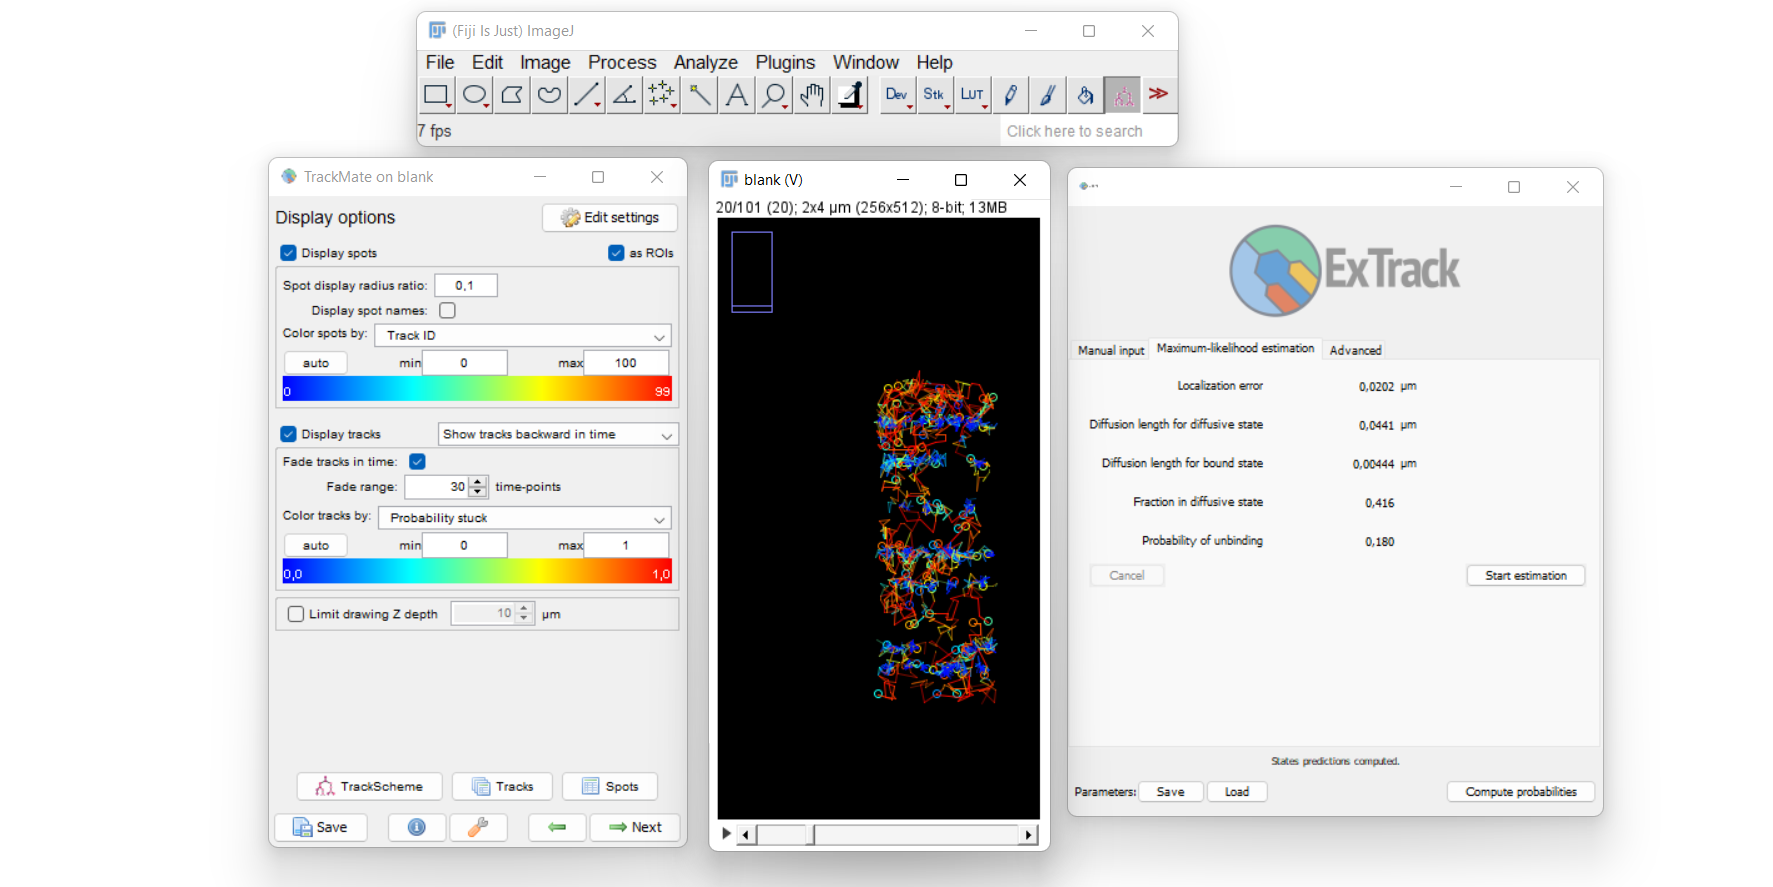
Click on Next and Next again, Chose the action Compute ExTrack probabilities and click on Execute. An additional window for ExTrack opens:
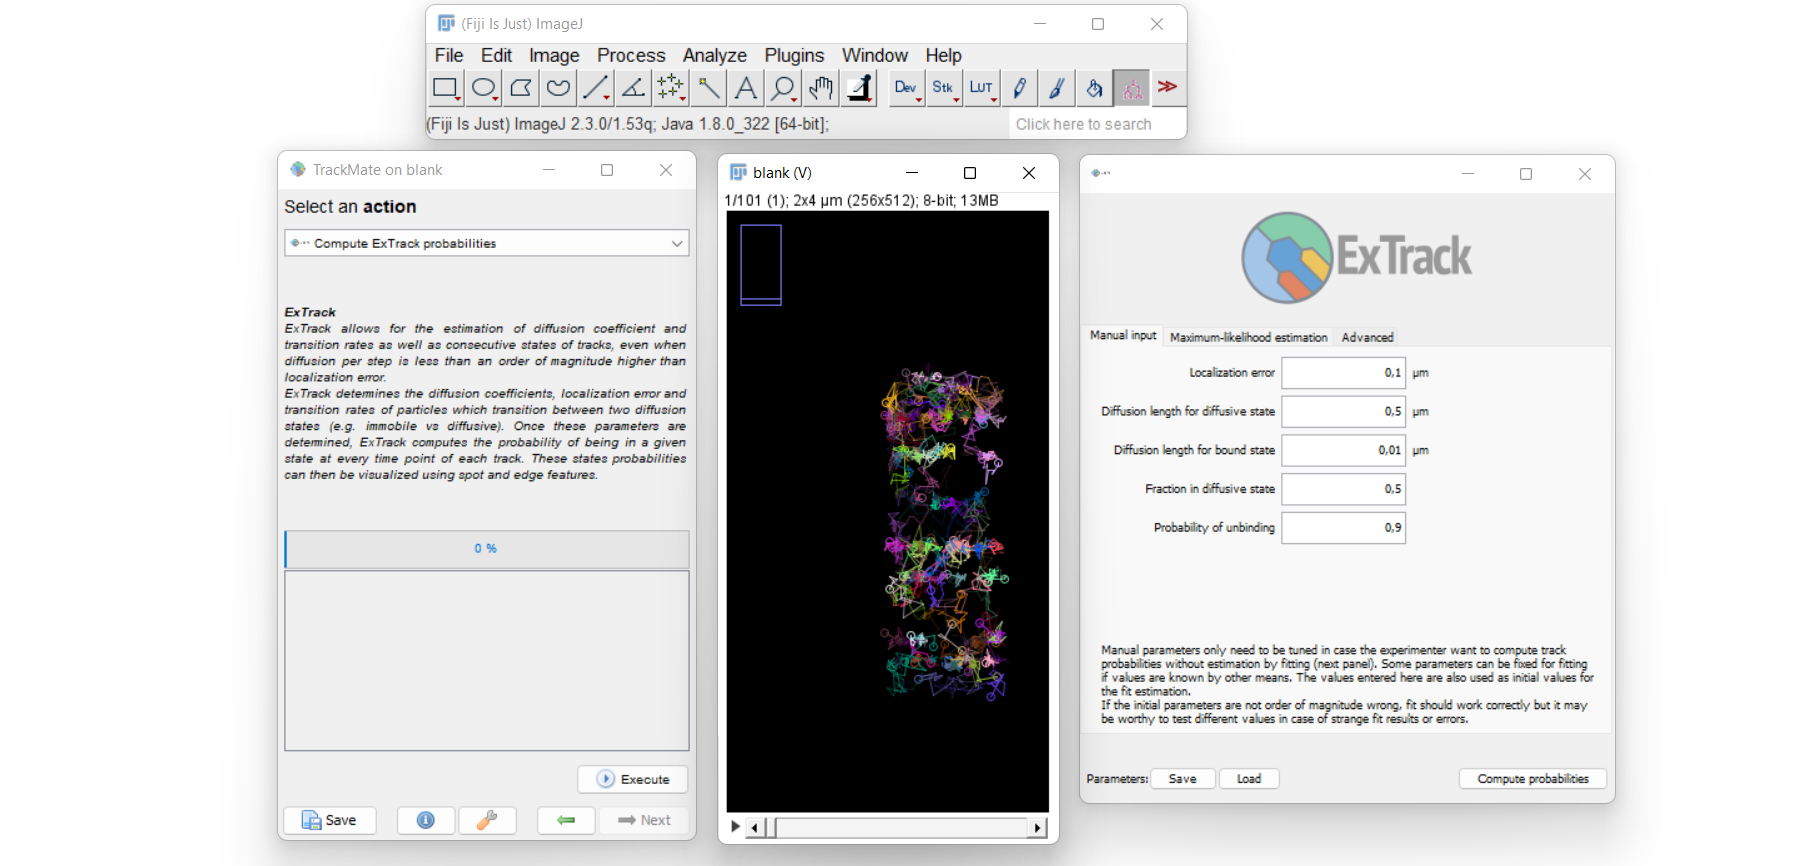
In Advanced, set N. sub steps to 1 as more is not necessary. In Maxumum-likelihood estimation, click on Start estimation
Parameters shoud converge as followed:
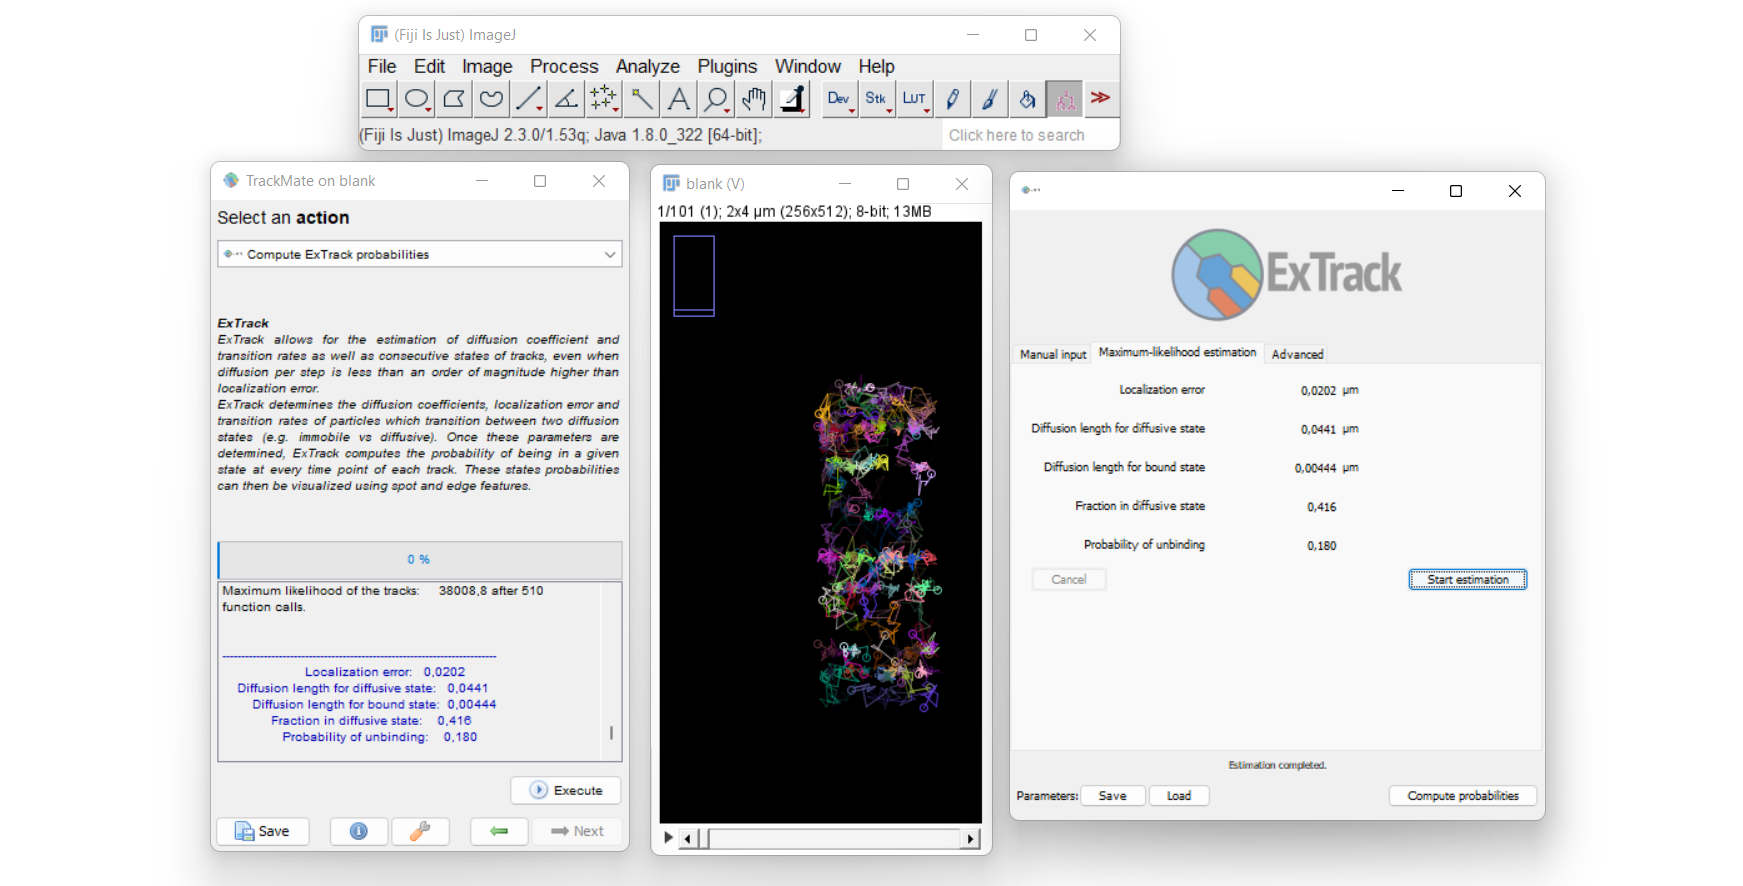
Note that contrary to the Python version, the TrackMate version of ExTrack can revert bound and diffusive states. If NaN values appear, close and Reopen the window using Execute.
Manual estimates of parameters can be specified in Manual input to facilitate fitting. Note that float number use comma and not dots (e.g. 0,2).
Once the fit is performed, click on Compute probabilities. On the TrackMate window, click on the button <== (left from Next) twice to come back to the display options.
In color tracks by, scroll to the top of the list and scroll down to find the spot feature Probability stuck and set its maximum value max to 1. Tracks are then displayed with respect to their state probability:
The resulting overlay can be saved by using the TrackMate window: From the Display options, click on Next twice to show the action panel, select the action capture overlay and Execute.