slow "requiring reboot" page (bsc#1022286) - uyuni-project/uyuni GitHub Wiki
Intro
Bug reference: https://bugzilla.suse.com/show_bug.cgi?id=1022286
Description:
I get occasional and intermittent slow system response (specifically to listing systems requiring a reboot)
— a colleague
Solution
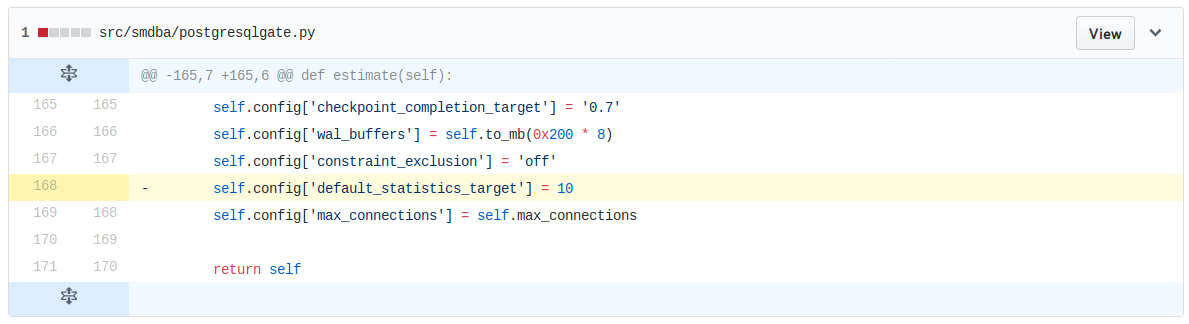
One-line fix, and it's a deletion!
images/bsc1022286-one-line-fix.png
Corresponding PR: https://github.com/SUSE/smdba/pull/18
Improved version: https://github.com/SUSE/smdba/pull/19
Digging
- thankfully we got SSH access, checking frequently raised the chance to be there when it happens, since it's intermittent
- thankfully another colleague also saw the same problem on a test host, in the end I could reproduce the slowness reliably there
- the "Requiring Reboot" page URL (https://HOST/rhn/systems/RequiringReboot.do) points to struts-config.xml, which points to RequiringRebootSetupAction which points to the having_errata_with_keyword_applied_since_last_reboot mode query
- luckily it's this query being particularly slow, I could find out easily by simply running it in
spacewalk-sqlon the command line:
SELECT id, name, selectable
FROM allServerKeywordSinceReboot
WHERE user_id = 2 AND org_id  = 1 AND keyword = 'reboot_suggested';
allServerKeywordSinceRebootis a not-too complex view over many tables, some of which can grow pretty big. Source:
    SELECT DISTINCT s.id,
        s.name,
        ( SELECT 1
               FROM rhnserverfeaturesview sfv
              WHERE sfv.server_id = s.id AND sfv.label::text = 'ftr_system_grouping'::text) AS selectable,
        s.org_id,
        ek.keyword,
        usp.user_id
       FROM rhnserver s,
        rhnerrata e,
        rhnserverinfo si,
        rhnserverpackage sp,
        rhnpackage p,
        rhnerratapackage ep,
        rhnerratakeyword ek,
        rhnuserserverperms usp
      WHERE usp.server_id = s.id AND si.server_id = s.id AND sp.server_id = s.id AND p.evr_id = sp.evr_id AND p.name_id = sp.name_id AND ep.errata_id = e.id AND ep.package_id = p.id AND (to_date('1970-01-01'::text, 'YYYY-MM-DD'::text) + numtodsinterval(s.last_boot, 'second'::character varying)) < timezone('UTC'::text, sp.installtime) AND e.id = ek.errata_id;
- discarded hypothesis 1: lock contention on some tables, I could exclude that by using mgr-db-locks. No locking could be detected at all
- discarded hypothesis 2: caching effects. Those follow a regular pattern: the first time a query is executed is slow, immediately after it's fast. Was not the case here. Moreover changing caches size in
postgresql.confdid not make a difference - actual cause was apparent by examining output from the
ANALYZEcommand that shows the query plan. There is a amazing tool to look into that called PEV (Postgres Explain Visualization). - to prepare input for PEV, save the query you want to analyze with an
EXPLAINpreamble to a file, in this case:
cat >explain.sql <<EOF
EXPLAIN (ANALYZE, COSTS, VERBOSE, BUFFERS, FORMAT JSON)
  SELECT id, name, selectable
    FROM allServerKeywordSinceReboot
    WHERE keyword = 'reboot_suggested';
EOF
- run the file directly in
psql, asspacewalk-sqlwould break the JSON format needed by PEV:
export PGUSER=`grep -oP "db_user ?= ?\K.*" /etc/rhn/rhn.conf`
export PGPASSWORD=`grep -oP "db_password ?= ?\K.*" /etc/rhn/rhn.conf`
export PGDATABASE=`grep -oP "db_name ?= ?\K.*" /etc/rhn/rhn.conf`
psql --quiet --no-align --tuples-only --file=explain.sql > explain.json
- upload the result JSON into PEV. In this case the output is below:
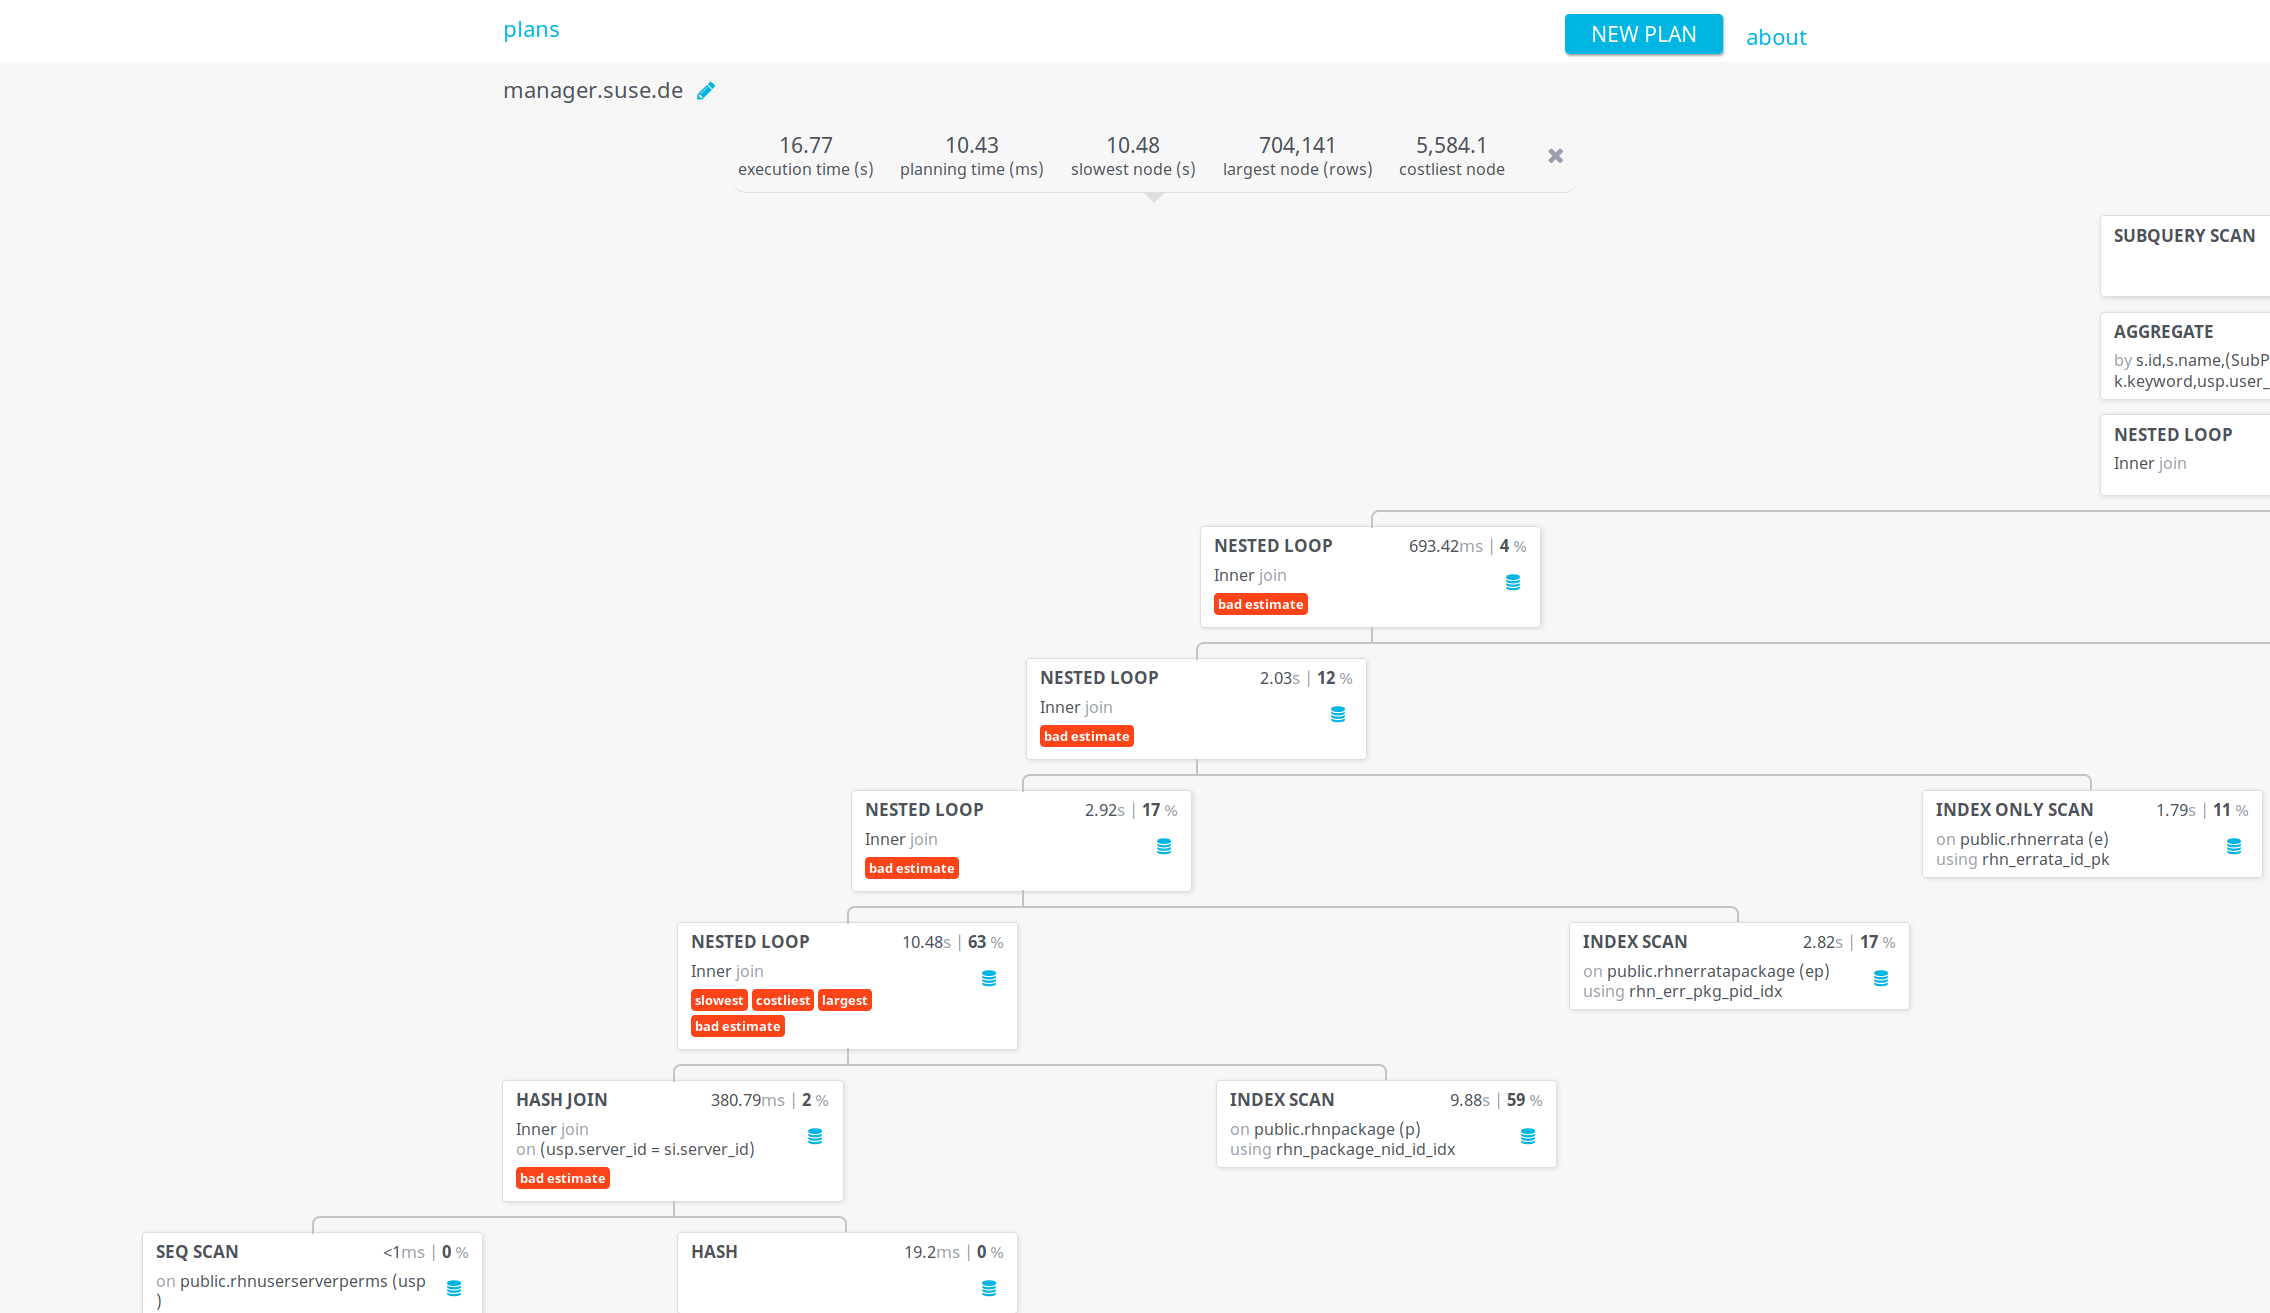
- clicking on the most problematic node reveals more detail:
images/bsc1022286-pev-bad-detail.png
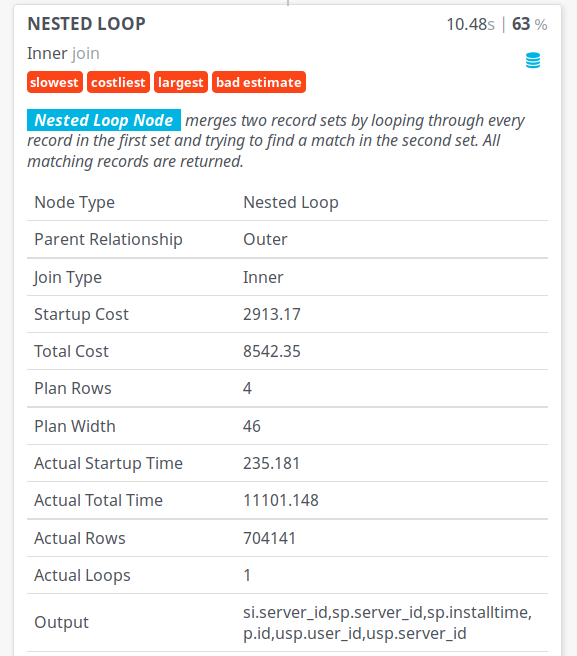
- partial conclusions:
- Postgres used a nested loop algorithm here to solve a
JOINclause, and this takes the vast majority of time- this is consistent with the output of
top, that shows Postgres fully utilizing one core (only version 9.6 added use of more than one CPU core in the context of one query, disabled by default). CPU-bound queries are typically a sign of something bad at the database level, which is naturally supposed to be IO-bound - Nested loops only make sense for small numbers of rows - Postgres here estimated 4 rows while actually 704141 were processed (off by 5 orders of magnitude). No wonder this is flagged as "bad estimate" by PEV!
- this is consistent with the output of
- we have a query planner problem here - estimates were way off
- Postgres used a nested loop algorithm here to solve a
- hypothesis 3: statistics are outdated. I excluded this analyzing one by one all of the involved tables - situation did not improve. Example benchmark:
time psql --username=susemanager --quiet --no-align --tuples-only --file=explain.sql > explain.json

spacewalk-sql --select-mode - <<<"ANALYZE rhnfeature;"
time psql --username=susemanager --quiet --no-align --tuples-only --file=explain.sql > explain.json

spacewalk-sql --select-mode - <<<"ANALYZE rhnservergrouptypefeature;"
time psql --username=susemanager --quiet --no-align --tuples-only --file=explain.sql > explain.json

...
- hypothesis 4: statistics are not fine-grained enough. I proved this changing the default_statistics_target one by one on all of the involved tables - situation did improve. Example benchmark:
time psql --username=susemanager --quiet --no-align --tuples-only --file=explain.sql > explain.json

spacewalk-sql --select-mode - <<<"SET default_statistics_target = 100; ANALYZE rhnfeature;"
time psql --username=susemanager --quiet --no-align --tuples-only --file=explain.sql > explain.json

spacewalk-sql --select-mode - <<<"SET default_statistics_target = 100; ANALYZE rhnservergrouptypefeature;"
time psql --username=susemanager --quiet --no-align --tuples-only --file=explain.sql > explain.json

...
Checking results
manager:/tmp # time psql --username=susemanager --quiet --no-align --tuples-only --file=explain.sql > explain.json

real	0m14.597s
user	0m0.023s
sys	0m0.004s

manager:/tmp #

manager:/tmp # spacewalk-sql --select-mode - <<<"SET default_statistics_target = 100; ANALYZE rhnerratapackage;"
SET
ANALYZE

manager:/tmp # time psql --username=susemanager --quiet --no-align --tuples-only --file=explain.sql > explain.json

real	0m0.101s
user	0m0.025s
sys	0m0.000s
14s down to 0.1, success!
Root cause
smdba was first written back when Postgres 8.4 was in use. At that time, recommended default for default_statistics_target was 10. As of Postgres 9.0, the default was changed to 100 and still is now. This requires a little bit more ANALYZE time, but query plans are more accurate.