Debugging With JLink - uw-advanced-robotics/taproot GitHub Wiki
The J-Link offers a second way to debug the MCB. This tutorial will first cover why you would use a J-Link over an ST-Link, a setup guide, and debugging-related information.
- Read Debugging Safety Information.
- Read the ST-Link Tutorial.
The ST-Link is an effective tool for uploading code to an MCB and for step-through debugging. While debugging embedded systems, however, it is sometimes useful to watch variables while the code is running, that is, without pausing execution. This is the main reason why our team has J-Links. You are able to watch variables "live" at fast rates. There is software to support the ST-Link for live variable debugging, but it is not compatible with C++ and the ST-Link's data transfer speed is quite slow compared to the J-Links we have. In addition to live variable watching, we use a stand alone graphical debugger called Ozone which provides the same features present in VSCode's Cortex-Debug extension.
- Watch variables live without having to pause the program.
- Graph primitive types live.
- Export graphed variables in csv format.
- Use unlimited breakpoints.
- Breakpoints are buggy (more on this here).
- Somewhat cumbersome to use since it is not built into VSCode.
- Somewhat antiquated and annoying user interface.
If you have not done so already, download and install the software. You will need to install the J-Link Software and Documentation Pack. Please do not download the beta version. Once downloaded, run the installer.
In the repository's project folder you are working in, build the debug version of the code. To do so, in VSCode, type ctrl + shift + p, then select "Tasks: Run Task", then "Build - Debug".
Open Ozone. This is a stand alone graphical debugger. It is a bit old and not as nice as VSCode, but it gets the job done.
You should see a prompt like what is shown below. Select "Create new project".

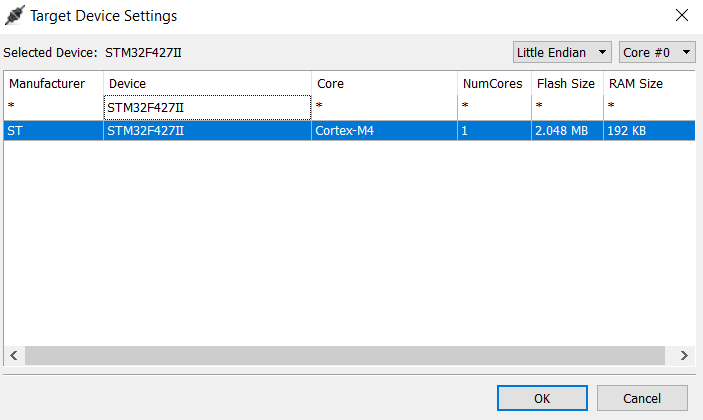
From here you will be prompted to select a device. Below "Device", click the "...".

Into the search window that pops up, type in "STM32F427II" and double click on the result.
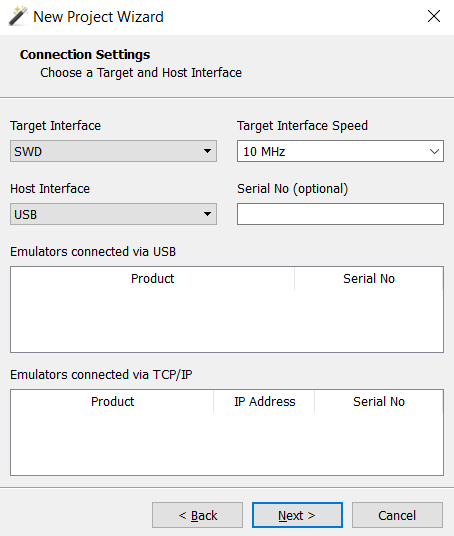
Click next (no Peripherals are necessary).
The next page will prompt for connection settings. Select "SWD" for "Target Interface" and "USB" for
"Host Interface". For "Target Interface Speed", no particular speed is required, but 10 MHz is
what I use. The final settings are below.
Click next. The setup will now prompt you for ELF file. In the project file you are working in, find
the .elf file associated with the build you just completed above. For taproot, this file will be
located in the folder test-project/build/hardware/debug and will be called mcb-project.elf.
Select "Finish" and then save the newly created project file (ctrl+S, then save this project anywhere you would like so you don't have to go through this setup any time you want to debug.
You can now start debugging in Ozone. First lets go through the basic procedure for debugging, then we can cover some important information that you should now to be successful while debugging.
-
Connect a J-Link to the MCB and your computer. The J-Link does not provide power to the MCB, so external power must be provided. Either plug in the MCB to a battery or use the micro USB port on the MCB.

-
In your Ozone project, click on the green power button in the top left of the screen. If the debugger asks about emulation settings, the J-Link is not connected properly. Once you press the green power button and the J-link has connected, the
.elfwill be flashed to the MCB. It will automatically erase and overwrite previously written code. -
The green button should have now been replaced by a red power button. See the image below. To the right of the power button, you should see a play button, a reset button, a step over, step into, and step out of button. You will see that the green highlight indicates where in the program the debugger is paused. Currently, it is paused at the start of the
main()function.

-
If you want to set any breakpoints, do so now. To set a breakpoint, click on one of the grey circles to the next of your code. To start running the program click the run button next to the power button.
-
When you are done running and want to end the debug session, if you are running your code on a robot controlling motors, turn off power to the motors. This will insure none of the motors spin out of control when you end the debug session. Next, click on the red power button in the upper left. Finally, clear all breakpoints. If any breakpoints are left in Ozone while uploading code during the next debug session, this will result in bricking the MCB.
- To avoid confusing, when you build your code, make sure when you do so it has updated in Ozone.
If you don't build the version of code the produces the
.elffile you originally associated with Ozone, Ozone will not detect changes you have made. You will then be confused because your updated changes won't appear in the Ozone graphical user interface. - Don't edit files directly in Ozone unless you know what you are doing (I don't so I just edit in VSCode).
- Always, always always remove all breakpoints before uploading code. This is probably the most important thing on this list. The way Ozone works, if you upload code with breakpoints set in the Ozone debugger, you have now uploaded faulty code that will likely hang at random places in memory. You have effectively bricked the MCB. It is useless until you can wipe its memory again, which isn't hard but its annoying (see how to wipe an MCB) If I want to se a breakpoint, I upload the code to the MCB (step 2 of how to debug) then set the breakpoint after uploading. While executing, once the breakpoint has been utilized and I don't need it anymore, I remove it. Be sure to keep track of what breakpoints you have set so you don't forget to remove them. In fact, if I know I'm just going to be doing a bunch of step through debugging I'll use an ST-Link.
- If you ever are asked to upload new firmware to the J-Link, don't.
Here we will cover some tips and tricks for debugging using Ozone and the J-Link, including how to watch variables, how to graph variables, and how to find files.
For any of these instructions, if it is required for you to see a particular panel and the panel is not present in your Ozone, at the top of Ozone, click "View," then select the necessary panel by name.
To add a particular variable to the "watch list," right click on a variable and select "Watch." This will add the variable to the "Watched Data" panel on the right of the Ozone IDE. If the thing you added was an object or other complex data structure, you can expand it to see its contents.
Alternatively, in the "Watched Data" panel, double click on the box below below any variables that are already watched in the "Expression" column and type in the name of the variable.
While watching variables, it is important to note that while code is running these will not be updated unless you turn refresh on (right click on a watched variable in the "Watched Data" panel, find "Refresh Rate", and set the rate from "Off" to a desired rate - I haven't found the rate setting to be important). Also when refresh is on, a variable will only refresh when you hide it from view in the "Watched Data" panel. For example, if I am watching some array, I expand the array to see its contents at the time I expanded it, then I compress the array and expand it again to see the contents at some later time. If you are watching a primitive type, you can either hide it from view by scrolling away from the variable until it is hidden from view and then move it back into view or by removing the variable from the watch panel and adding it again. Variables will however be updated during each step while using step through debug features.
Right click on a variable either in the "Watched Data" panel or somewhere in code, and select the "Graph" option. Only primitive data types less than eight bytes can be graphed. You will see the data real time in the "Data Graph" panel (usually at the bottom of Ozone).
In the "Data Graph" panel, you can see three tabs, "Setup", "Samples", and "Graphs." "Setup" will allow you to watch variables update without a graph, "Samples" stores arrays of previous data samples for the variables you are graphing, and "Graphs" shows the data being graphed.
To remove things from the "Data Graph" panel, in the "Setup" tab, right click on the expression you would like to remove and select "remove."
I have found that on my computer, if you have more than 3-4 variables in the "Data Graph" panel, you will experience significant lag and Ozone tends to crash. If you experience lag with only a few variables being graphed, try decreasing the sampling frequency "Sampling Freq.:" option in the "Data Graph" panel.
In the "Source Files" panel, directly under the word "File" at the top of the panel, you can click,
search, and view files by name. Only files that have been built and are present in the .elf file
associated with the Ozone project will show up here.