Network Inventory (runZero) - uthomelabs/guides GitHub Wiki
As Homelabs / HomeProd grows, you'll eventually want to get a handle on everything that is out there. If you are an enterprise, this is even more important to keep tabs on what is being introduced into your environment. It is literally CIS Control #1.
We are going to use a could-based tool called runZero (Formally rumble.run). (The irony is not lost we are using a cloud-based tool in a community known for HomeLabs and running it yourself; however you still have to deploy a local connector)
- A Linux box (or container)
- LXC is great for this
- 1 CPU Core
- 512MB of ram
- Install chrome so you can get screenshots of the web portals it finds
- A runZero account
Head out to https://www.runzero.com/try/signup/ and get signed up. Once you sign up for the free-tier and get logged in, on the left hand side there is an option for "Deploy -> Deploy explorers"
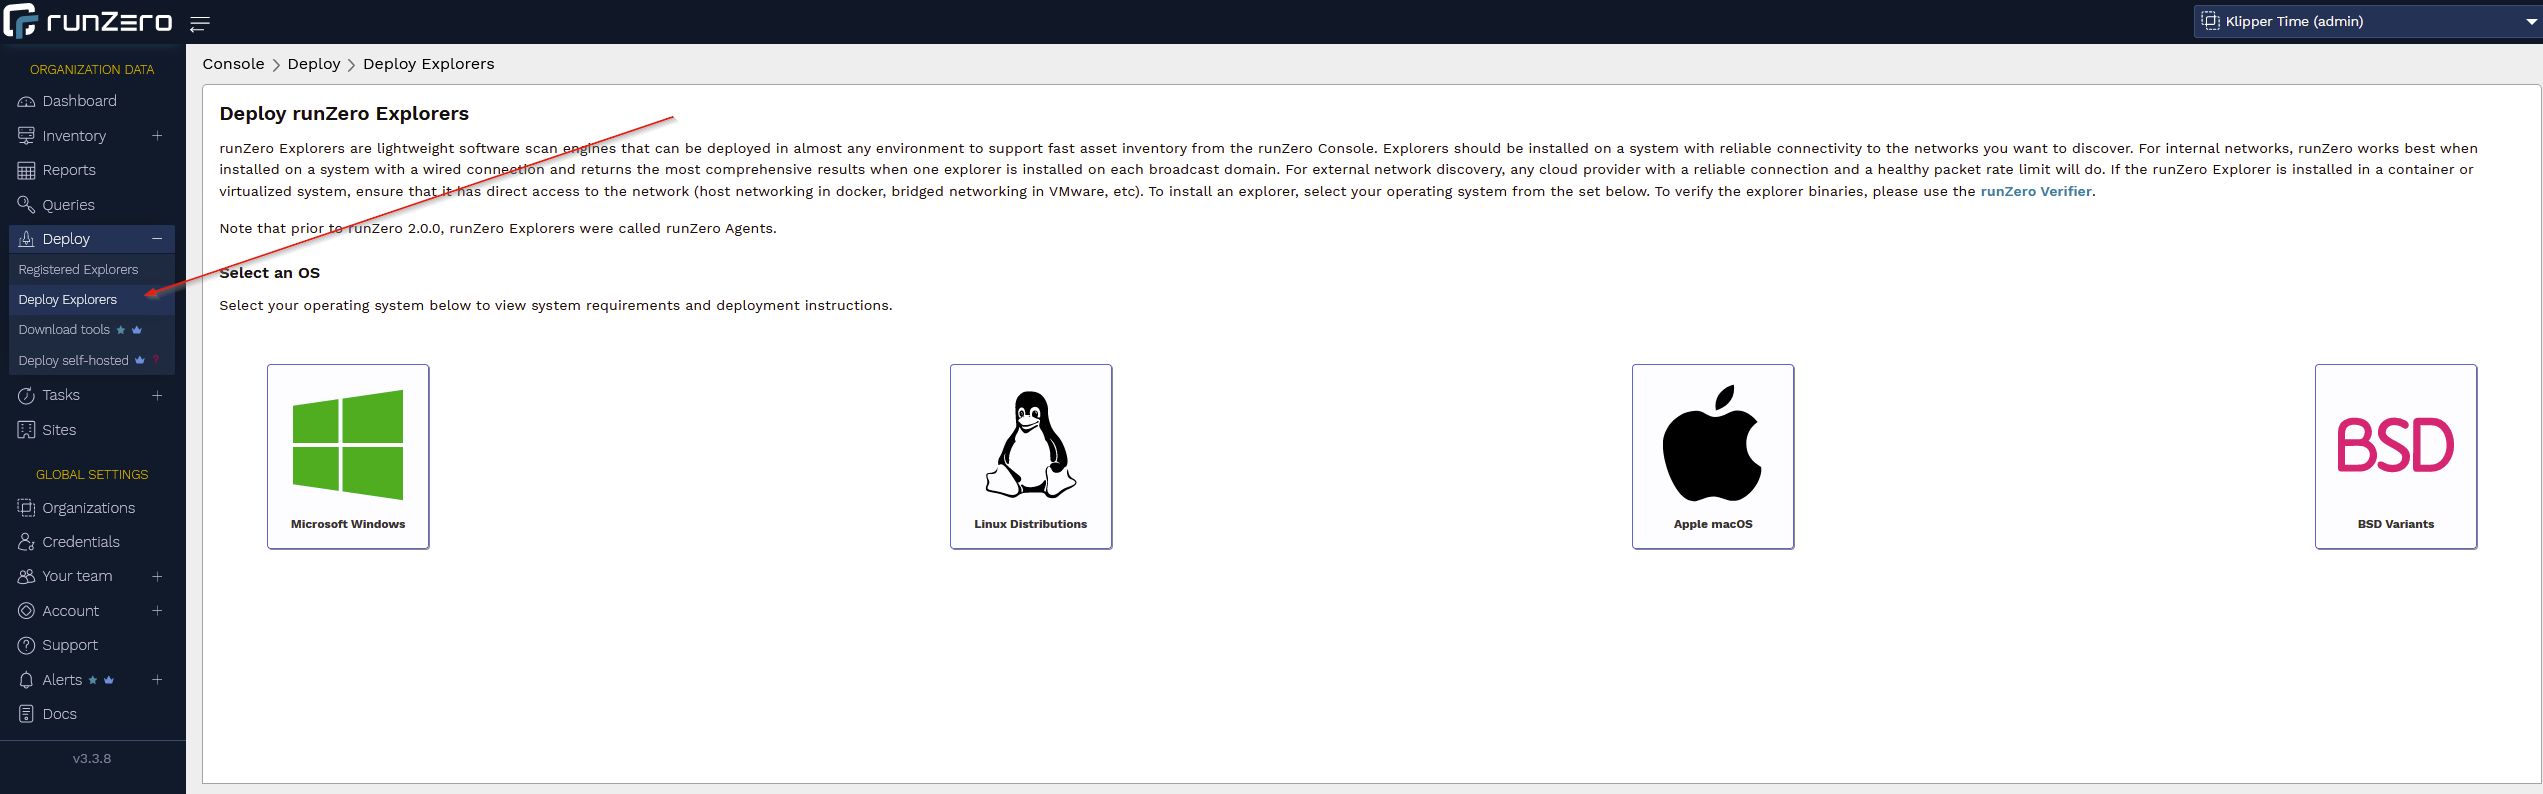
You can choose whatever OS you like here, but this guide is going to do it on Linux.
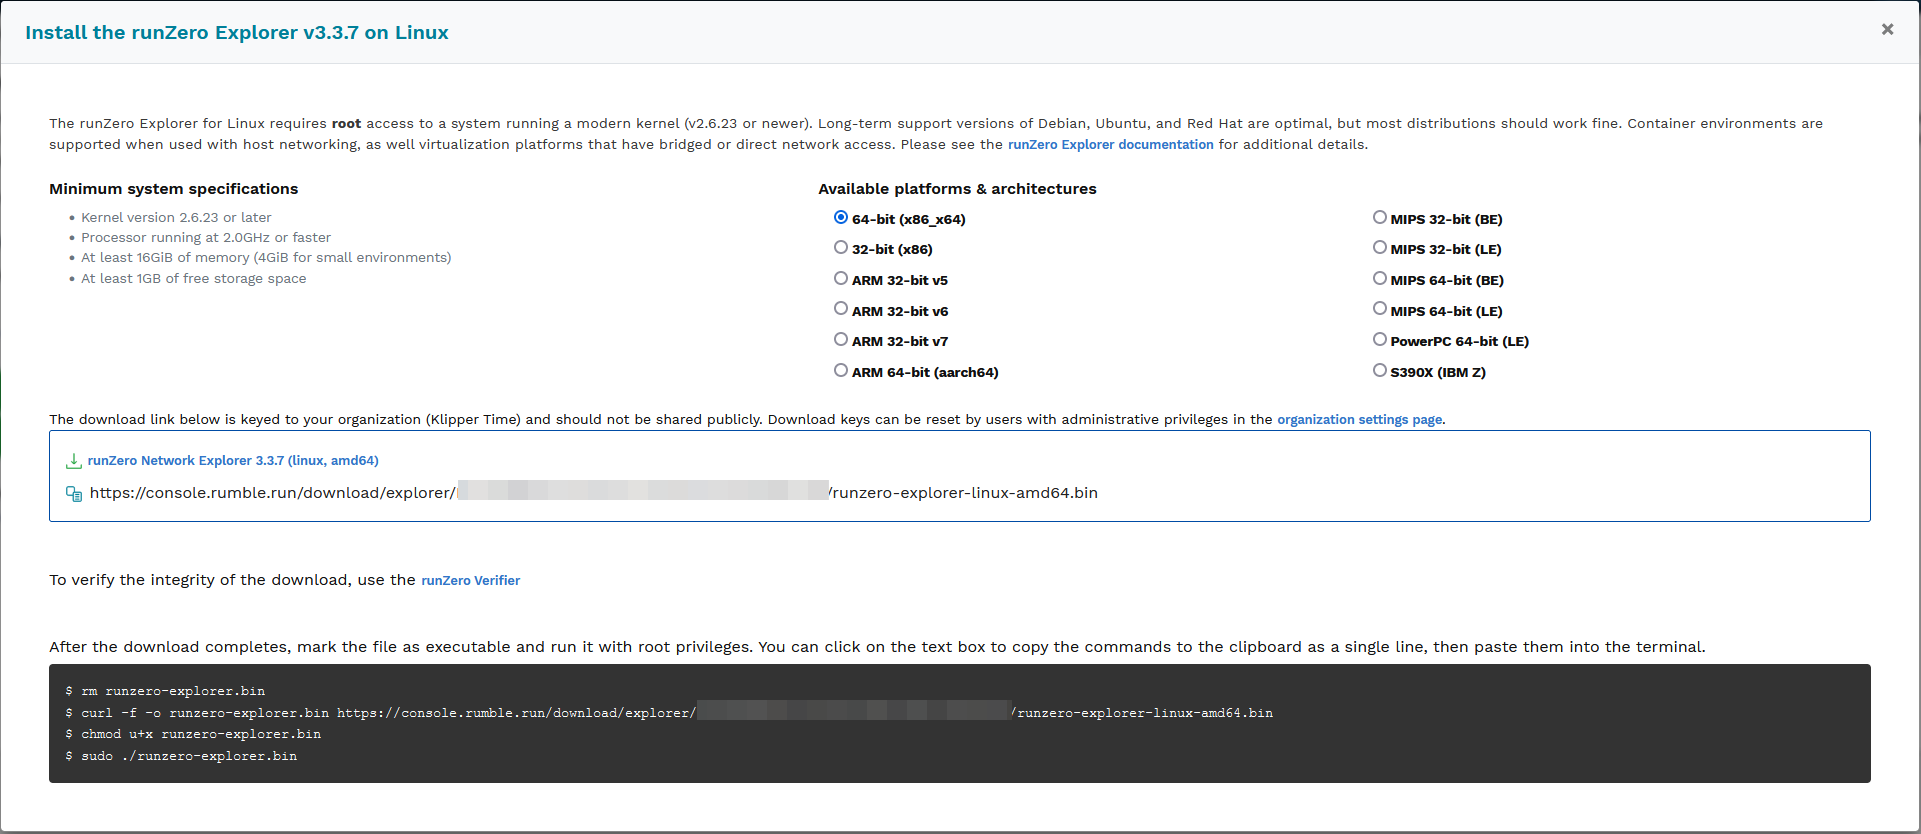
Choose your options, and then wget the .bin file listed in the middle section. Be careful, this download URL is customized for your implementation. Once you get the .bin file downloaded, perform the steps as instructed. Please note, you may need to resolve some dependencies (installing curl or wget for example). That is easily accomplished by:
sudo apt-get install <package>
Let's get chrome installed so we get screenshots of web pages being hosted on our local network
sudo wget https://dl.google.com/linux/direct/google-chrome-stable_current_amd64.deb
sudo dpkg -i google-chrome-stable_current_amd64.deb
Now that chrome is installed, we can get runZero setup
sudo wget <url>
sudo chmod u+x <bin file you downloaded>
./ <bin file you downloaded>
Once the installation completes, you'll be greeted with some ASCII art that shows the runZero log, a well as what instance it has connected to.
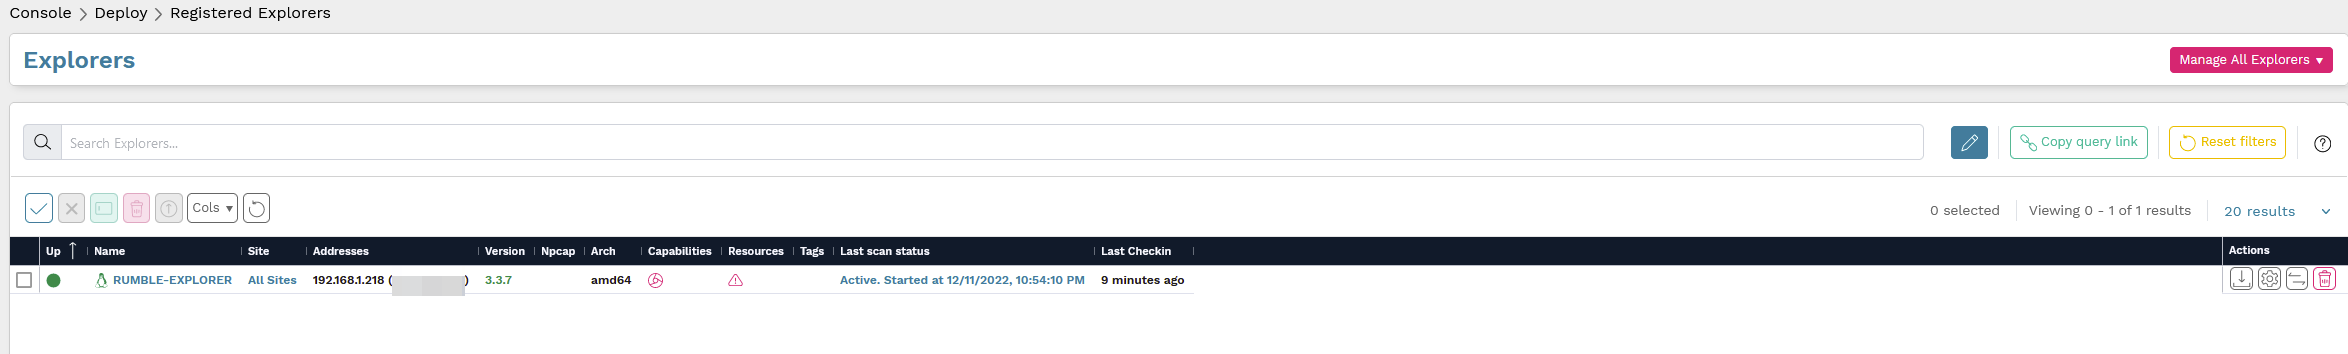
You can verify the installation by browsing to Deploy -> Registered Explorers
Now with your explorer deployed, you are ready for your first scan.
In the WebUI, browse to Tasks -> Scheduled From here, you can configure your first standard scan. The defaults are good enough for now (you can tweak them later) but go ahead and deploy a scan for the local subnet and feel free to make it recurring on whatever cadence you like.
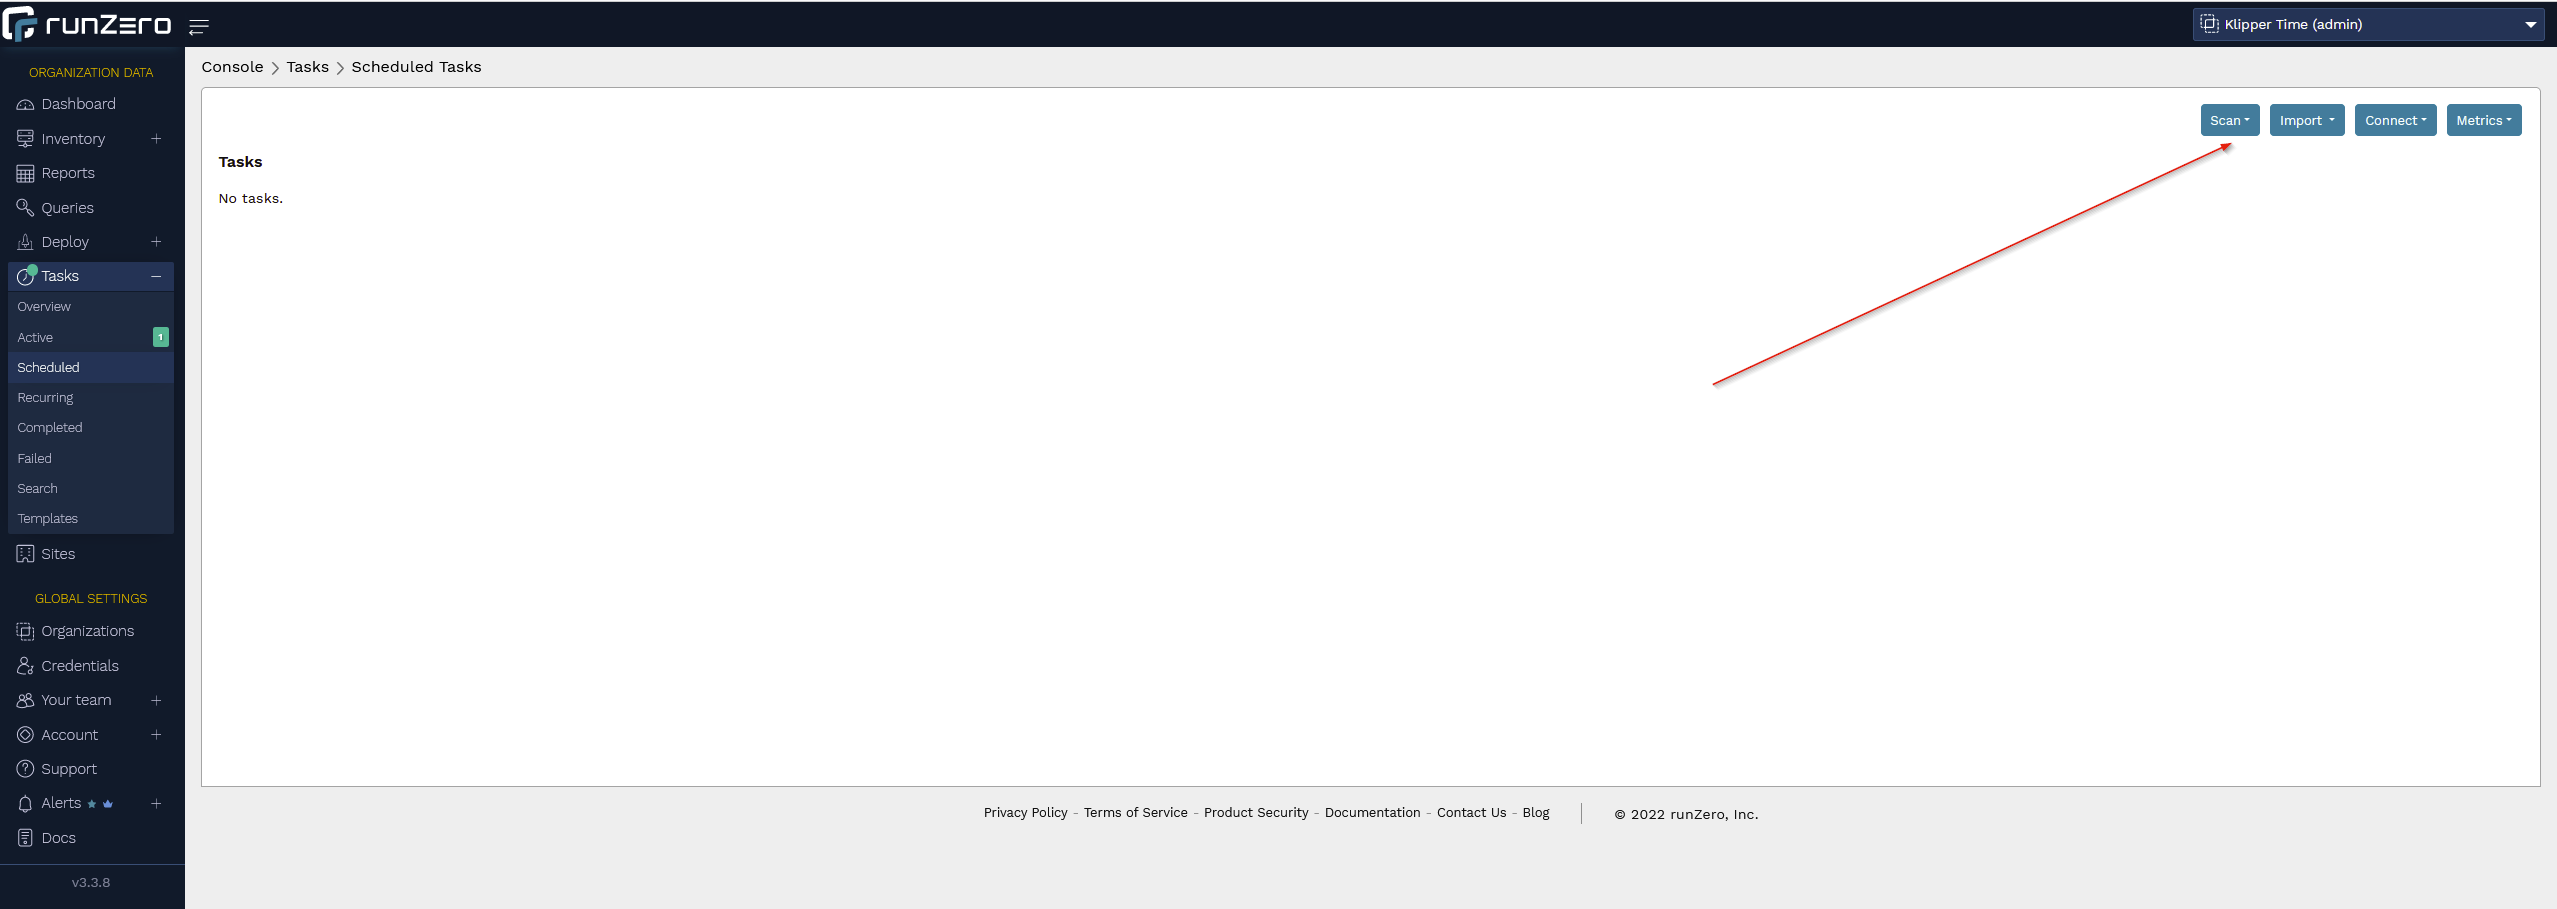
After selecting your options, the default 'ok' is to kick off the scan. Go ahead and do so, and wait about 5 minutes or so.
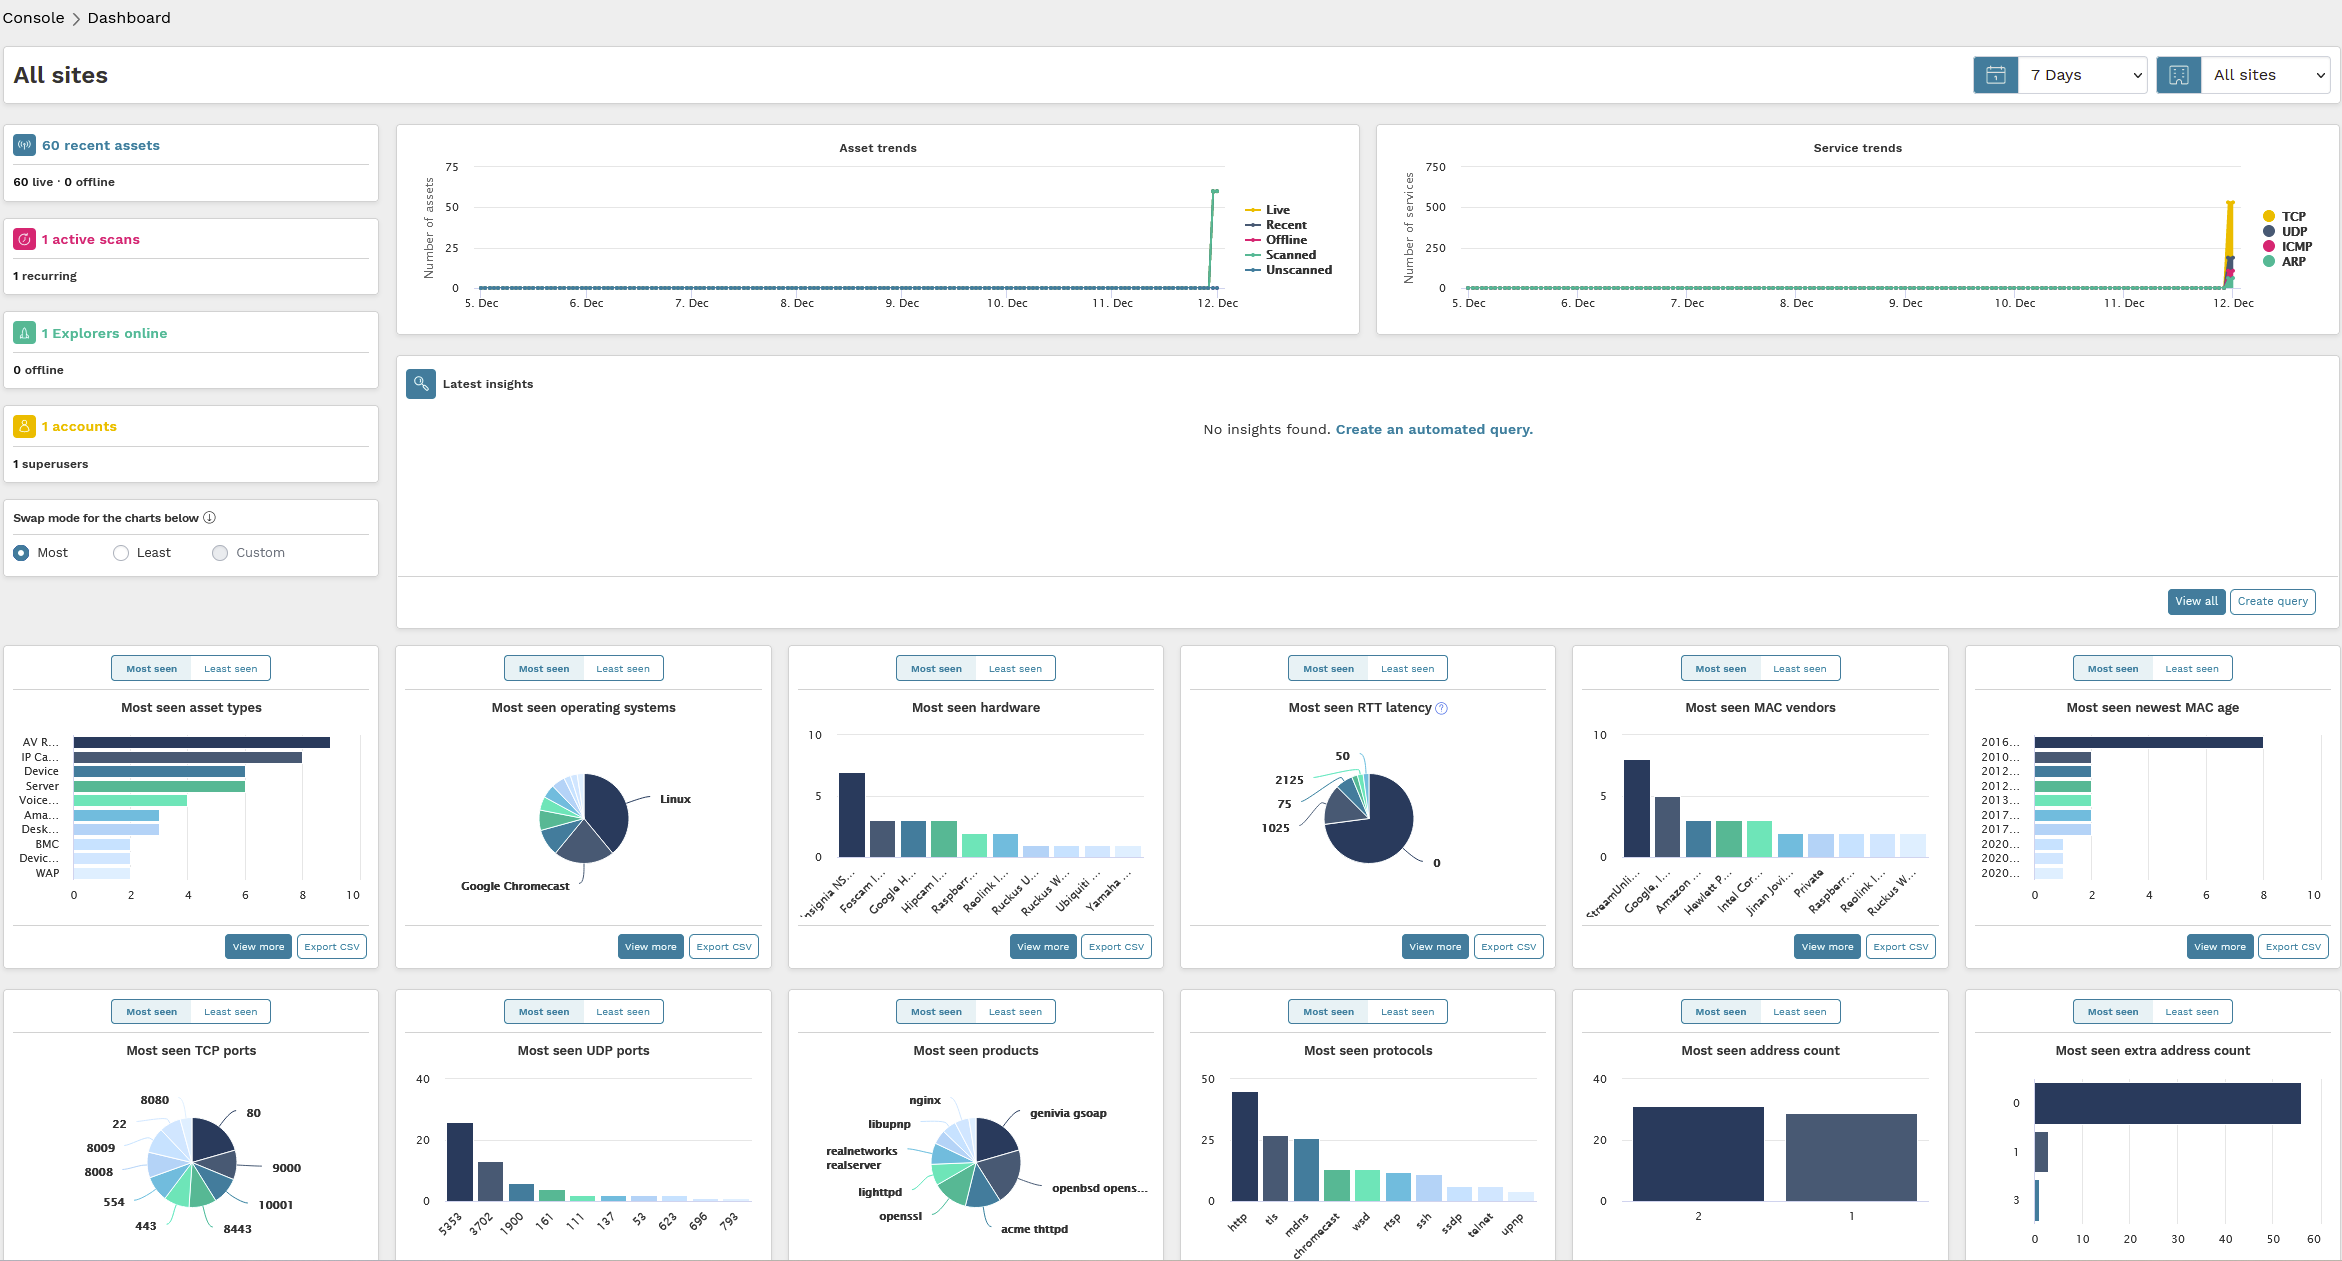
You now can browse around the various features of runZero. Start with the summary screen, and then drill down in areas that interest you. As the scanner scans the network on the cadence you set, new devices that have been introduced will be added to your web portal.
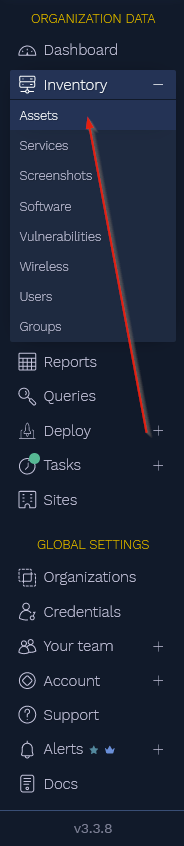
The real power comes when we are trying to identify / correlate information across the entire enterprise. Let's say, for example, we want to see everywhere TLS 1.1 was detected. Select Inventory -> Assets
In the search window, you can now type: attribute:"tls.stack" and tls.stack:="openssl=1.1"
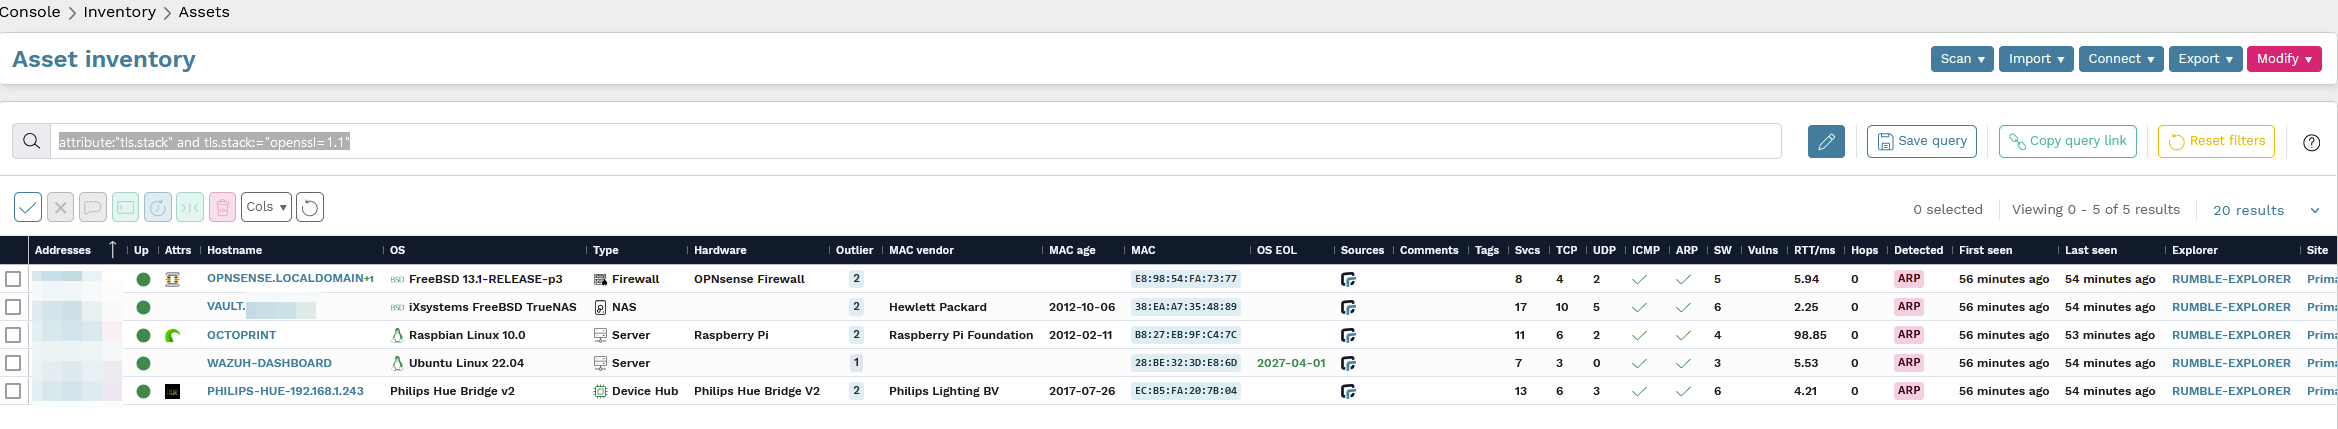
Look how quickly you can instantly gain valuable insight into the services / protocols running on your network. Next time a vuln drops for a certain library / piece of software...you will be MUCH better prepared to triage its impact.