4. Cleaning data for analysis - upalr/Python-camp GitHub Wiki
1 Data types
1.1 Prepare and clean data
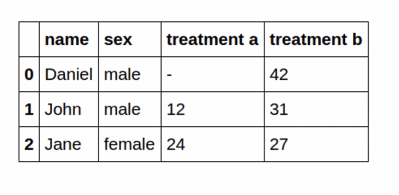
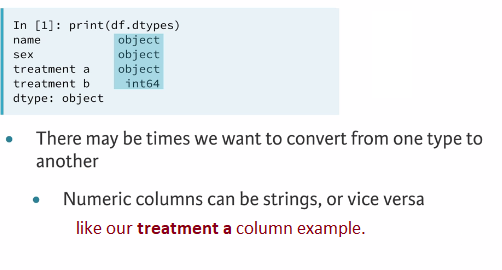
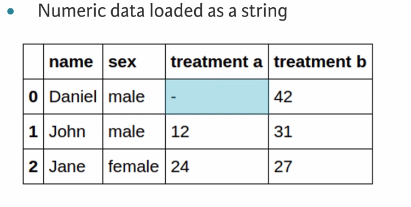
We expect the name and sex columns to be strings and both treatment values to be numerics. We can call the dtypes attribute on the data-frame to get the types of column
INFO: The object dtype is a general representation in python that is typically encoded as strings.
1.2 Data types
1.3 Converting data types
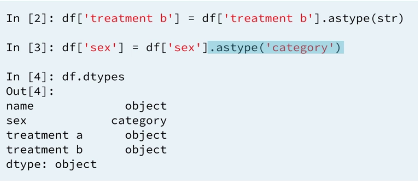
When to convert Which data types:
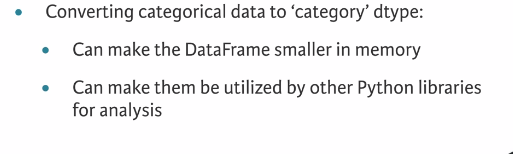
1.3.1 Categorical data
1.3.1.1 Example 1: Converting data types (How category reduce memory)
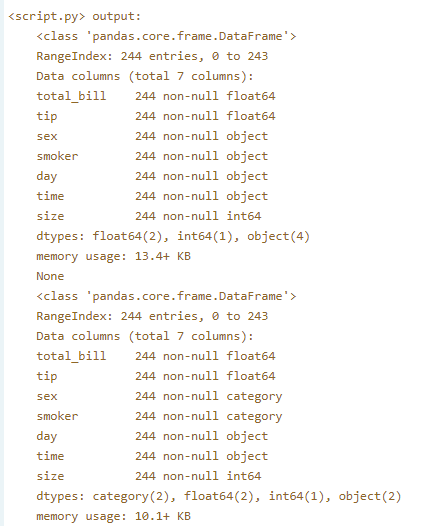
In this exercise, you'll see how ensuring all categorical variables in a DataFrame are of type category reduces memory usage.
print(tips.info())

# Convert the sex column to type 'category'
tips.sex = tips.sex.astype('category')

# Convert the smoker column to type 'category'
tips.smoker = tips.smoker.astype('category')

# Print the info of tips
print(tips.info())
Result:
Excellent! By converting sex and smoker to categorical variables, the memory usage of the DataFrame went down from 13.4 KB to 10.1KB. This may seem like a small difference here, but when you're dealing with large datasets, the reduction in memory usage can be very significant!
1.3.2 Cleaning Numeric data
If we expect the column to be a numeric dtype but has been loaded as a string this is a typical sign of bad data that needs cleaning. In the example, missing value stored as a (-) dash.
1.3.2.1 Solution: cleaning bad data and make the column type numeric
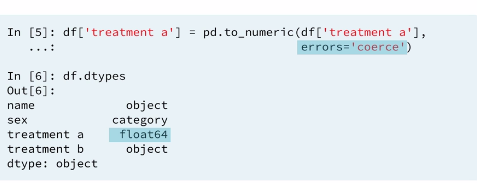
This will convert all the values in the column into numeric and for invalid values in the column it will be set as a NAN
missing value. If we do not pass in the errors='coerce' argument than python will return an error because it will not know how to turn the string dash (-) into a numeric value.
1.3.2.2 Example 2 : Working with numeric data
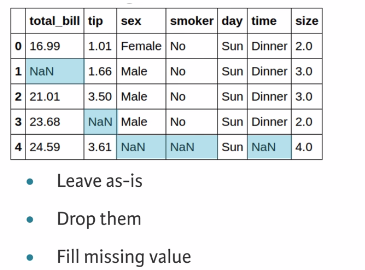
If you expect the data type of a column to be numeric (intor float), but instead it is of type object, this typically means that there is a non numeric value in the column, which also signifies bad data.
You can use the pd.to_numeric() function to convert a column into a numeric data type. If the function raises an error, you can be sure that there is a bad value within the column. You can either use the techniques you learned in Chapter 1 to do some exploratory data analysis and find the bad value, or you can choose to ignore or coercethe value into a missing value, NaN.
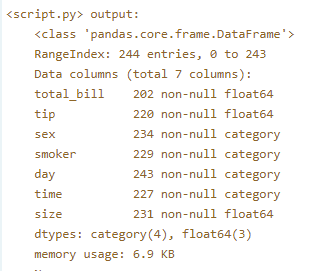
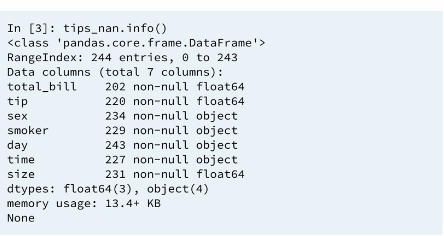
A modified version of the tips dataset has been pre-loaded into a DataFrame called tips. For instructional purposes, it has been pre-processed to introduce some 'bad' data for you to clean. Use the .info() method to explore this. You'll note that the total_bill and tip columns, which should be numeric, are instead of type object. Your job is to fix this.
# Convert 'total_bill' to a numeric dtype
tips['total_bill'] = pd.to_numeric(tips['total_bill'], errors='coerce')

# Convert 'tip' to a numeric dtype
tips['tip'] =  pd.to_numeric(tips['tip'], errors='coerce')

# Print the info of tips
print(tips.info())
Result:
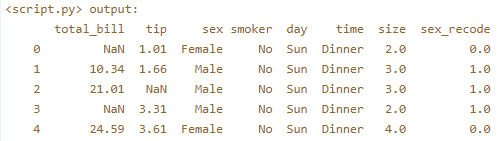
Great work! The 'total_bill' and 'tip' columns in this DataFrame are stored as object types because the string 'missing' is used in these columns to encode missing values. By coercing the values into a numeric type, they become proper NaN values.
2 Using regular expressions to clean strings
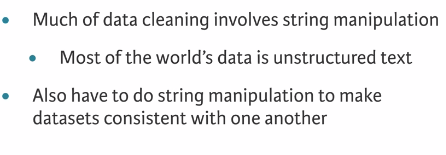
2.1 String manipulation
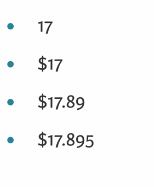
2.2 valid values
2.3 String manioulation

2.4 Example match
When working with data, it is sometimes necessary to write a regular expression to look for properly entered values.
2.4.1 Example 3:
US phone numbers Pattern: xxx-xxx-xxxx.
Regex:
prog = re.compile('\d{3}-\d{3}-\d{4}')
2.4.2 Example 4:
Extracting numbers from strings is a common task, particularly when working with unstructured data or log files.
Say you have the following string:
'the recipe calls for 6 strawberries and 2 bananas'.
It would be useful to extract the 6 and the 2 from this string to be saved for later use when comparing strawberry to banana ratios.
When using a regular expression to extract multiple numbers (or multiple pattern matches, to be exact), you can use the re.findall() function. Dan did not discuss this in the video, but it is straightforward to use: You pass in a pattern and a string to re.findall(), and it will return a list of the matches.
INFO: \d is the pattern required to find digits. This should be followed with a + so that the previous element is matched one or more times. This ensures that 10 is viewed as one number and not as 1 and 0.
# Import the regular expression module
import re

# Find the numeric values: matches
matches = re.findall('\d+', 'the recipe calls for 10 strawberries and 1 banana')

# Print the matches
print(matches)
2.4.2 Example 5:
Write patterns to match:
-
A telephone number of the format
xxx-xxx-xxxx. You already did this in a previous exercise. -
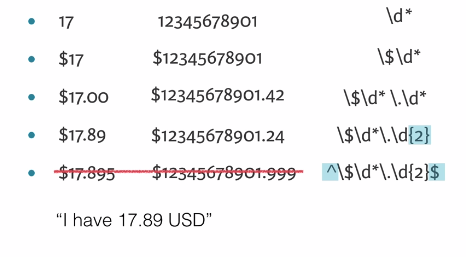
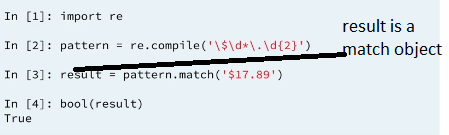
A string of the format: A dollar sign, an arbitrary number of digits, a decimal point, 2 digits.
- Use
\$to match the dollar sign,\d*to match an arbitrary number of digits,\.to match the decimal point, and\d{x}to matchxnumber of digits.
- Use
-
A capital letter, followed by an arbitrary number of alphanumeric characters.
- Use
[A-Z]to match any capital letter followed by\w*to match an arbitrary number of alphanumeric characters.
- Use
# Write the first pattern
pattern1 = bool(re.match(pattern='\d{3}-\d{3}-\d{4}', string='123-456-7890'))
print(pattern1)

# Write the second pattern
pattern2 = bool(re.match(pattern='\$\d*\.\d{2}', string='$123.45'))
print(pattern2)

# Write the third pattern
pattern3 = bool(re.match(pattern='[A-Z]\w*', string='Australia'))
print(pattern3)
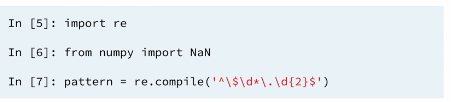
2.5 using regular expressions
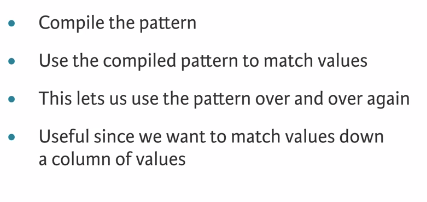
The regular expression module in python is re. When performing pattern matching on data, since the pattern will be used for a match across multiple rows, it's better to compile the pattern first using re.compile(), and then use the compiled pattern to match values.
3 Using functions to clean data
3.1 Complex cleaning
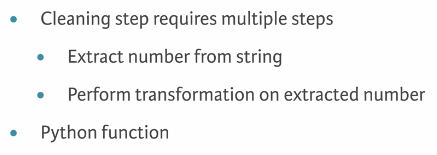
3.2 apply
Just to remember : tb_melt['sex'] = tb_melt.variable.str[0]
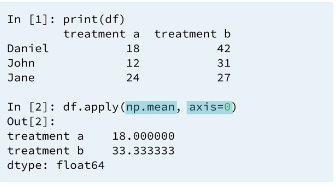
3.2.1 apply (column wise)
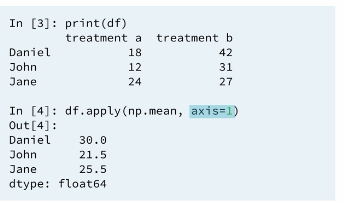
3.2.2 apply (row wise)
3.3 Applying functions
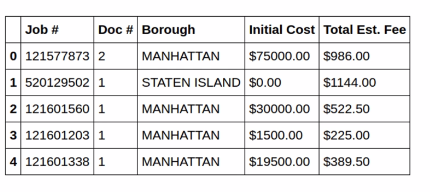
3.4 Write the regular expression
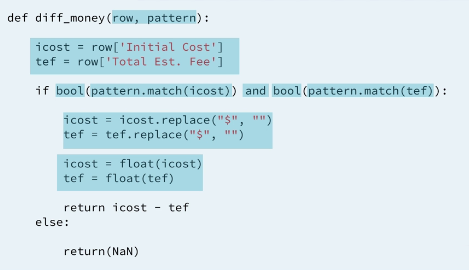
3.5 Writing a function
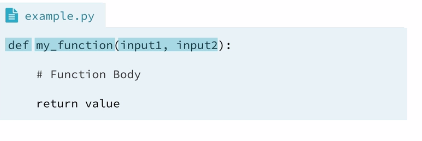
3.6 Write the function
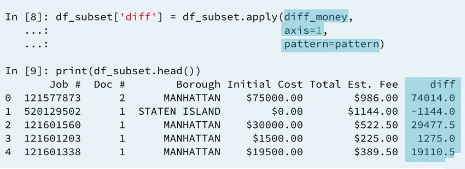
When we apply a function across rows of a Data-frame what get passed into the function is the row of data even though we only need a few values from the row, the entire row will be passed into the function.
3.6.1 Example 6: Custom functions to clean data
As Dan showed you in the videos, you can use the .apply() method to apply a function across entire rows or columns of DataFrames. However, note that each column of a DataFrame is a pandas Series. Functions can also be applied across Series. Here, you will apply your function over the 'sex' column.
# Define recode_sex()
def recode_sex(sex_value):

    # Return 1 if sex_value is 'Male'
    if sex_value == 'Male':
        return 1

    # Return 0 if sex_value is 'Female'
    elif sex_value == 'Female':
        return 0

    # Return np.nan
    else:
        return np.nan

# Apply the function to the sex column
tips['sex_recode'] = tips.sex.apply(recode_sex)

# Print the first five rows of tips
print(tips.head())
Output:
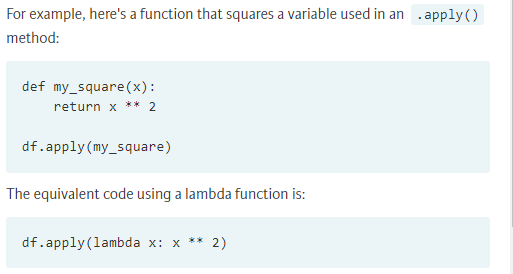
3.6.2 Example 7: Lambda functions
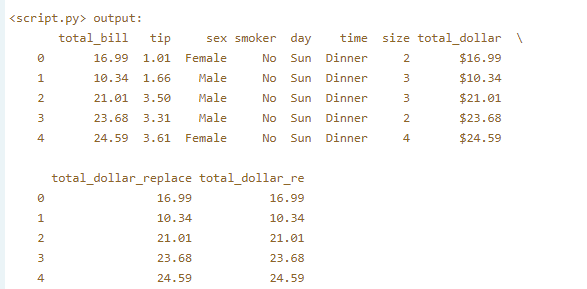
Your job is to clean its 'total_dollar' column by removing the dollar sign. You'll do this using two different methods: With the .replace() method, and with regular expressions. The regular expression module re has been pre-imported.
# Write the lambda function using replace
tips['total_dollar_replace'] = tips.total_dollar.apply(lambda x: x.replace('$', ''))

# Write the lambda function using regular expressions
tips['total_dollar_re'] = tips.total_dollar.apply(lambda x: re.findall('\d+\.\d+', x)[0])

# Print the head of tips
print(tips.head())
4 Duplicate and missing data
4.1 Duplicate data
Duplicate data causes a variety of problems. From the point of view of performance, they use up unnecessary amounts of memory and cause unneeded calculations to be performed when processing data. In addition, they can also bias any analysis results.
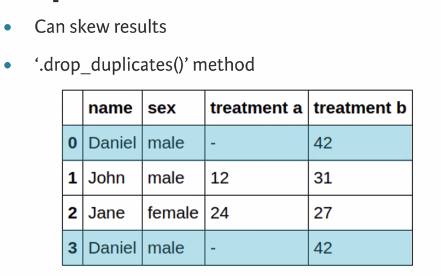
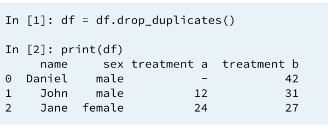
4.2 Drop duplicates
4.3 Missing data
4.4 Count missing values
We have missing values in each columns
4.5 Drop missing values
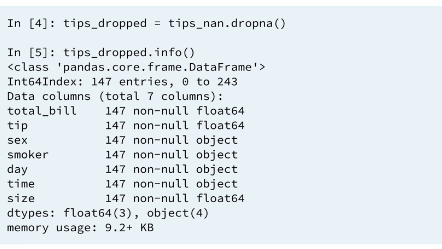
if we look at the info() of our new data-frame, We now only have total 147 entries and each column also has 147 entries. We get a complete data-frame with only complete cases. That is, If a row contains a missing value then the row will be dropped from the data-frame. We lost about 40% of our data with this method. If we lost only few observations that would be reasonable but with this many observations dropped from our data set we need to deal with missing data differently. keep in mind droping columns is also a possibility if most of the missing values are from a particular set of columns.
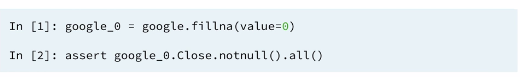
4.6 Fill missing values with .fillna()
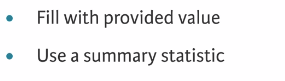
4.6.1 Fill NAN missing value with user provided value
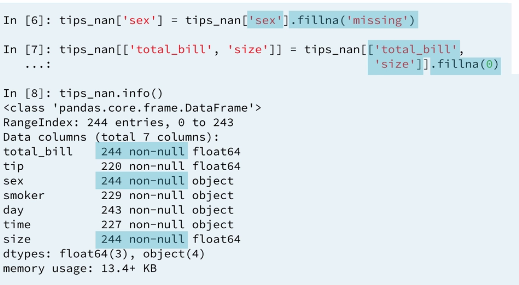
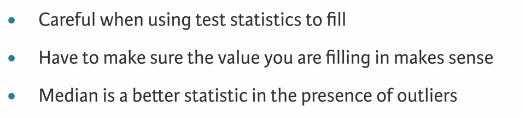
4.6.2 Fill missing values with a test statistic
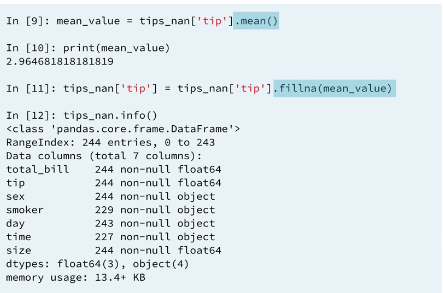
4.6.3 Filling missing data (imputation) by group
5 Testing with asserts
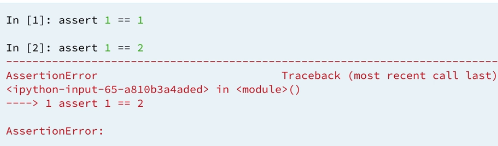
5.1 Assert statements
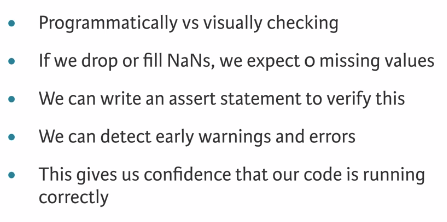
5.2 Asserts
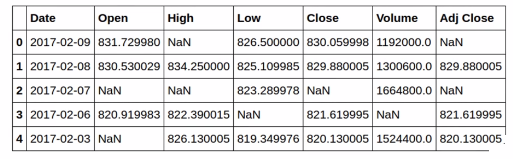
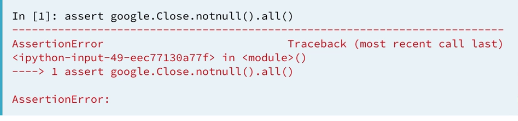
5.3 Google stock data
5.4 Test column
5.4.1 Example 7:
Here, you'll practice writing assert statements using the Ebola dataset from previous chapters to programmatically check for missing values and to confirm that all values are positive. The dataset has been pre-loaded into a DataFrame called ebola.
In the video, you saw Dan use the .all() method together with the .notnull() DataFrame method to check for missing values in a column. The .all() method returns True if all values are True. When used on a DataFrame, it returns a Series of Booleans - one for each column in the DataFrame. So if you are using it on a DataFrame, like in this exercise, you need to chain another .all() method so that you return only one True or False value. When using these within an assert statement, nothing will be returned if the assert statement is true: This is how you can confirm that the data you are checking are valid.
Note: You can use pd.notnull(df) as an alternative to df.notnull()
Instructions :
- Write an assert statement to confirm that there are no missing values in
ebola.- Use the
pd.notnull()function onebola(or the.notnull()method ofebola) and chain two.all()methods (that is,.all().all()). The first.all()method will return a True or False for each column, while the second.all()method will return a singleTrueorFalse.
- Use the
- Write an assert statement to confirm that all values in ebola are greater than or equal to
0.- Chain two
all()methods to the Boolean condition(ebola >= 0).
- Chain two
# Assert that there are no missing values
assert pd.notnull(ebola).all().all()
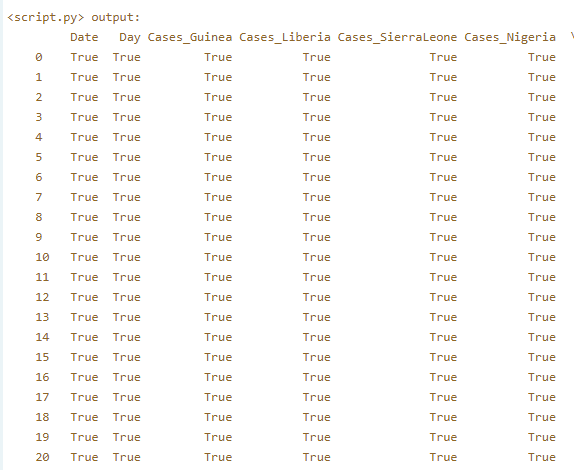
print(pd.notnull(ebola))
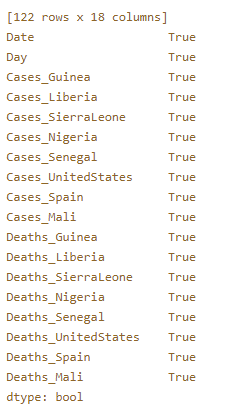
print(pd.notnull(ebola).all())
print(pd.notnull(ebola).all().all())
# Assert that all values are >= 0
assert (ebola >= 0).all().all()
Results:
Excellent job! Since the assert statements did not throw any errors, you can be sure that there are no missing values in the data and that all values are >= 0!
print(pd.notnull(ebola)):
print(pd.notnull(ebola).all()):
print(pd.notnull(ebola).all().all())
