3. Rearranging and reshaping data - upalr/Python-camp GitHub Wiki
1 Pivoting DataFrames
pivot is a reshaping tool for dataframes.
More
- "melting" multiple columns
- "pivot" reshaping dataframe + create column
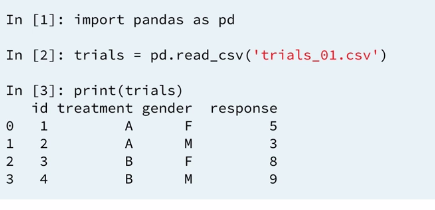
1.1 Clinical trails data
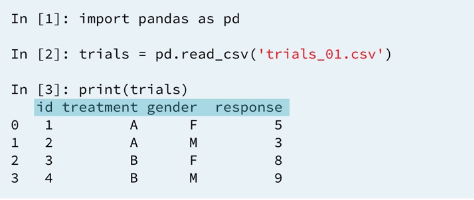
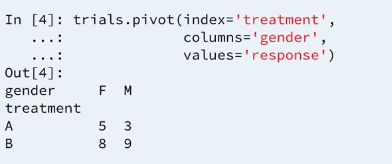
But perhaps you want to reshape the table to make easier to see relationships between the response values and the specific treatments and gender. This is an example of what is called pivoting a dataframe.
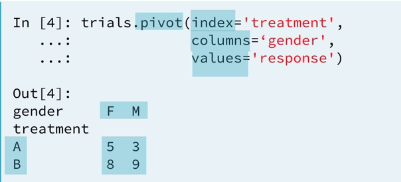
Notice how in the pivoted DataFrame, the index is labeled treatment, the columns are labeled gender, and the values are populated by the number of response.
1.2 Reshaping by pivoting
1.3 Pivoting multiple columns
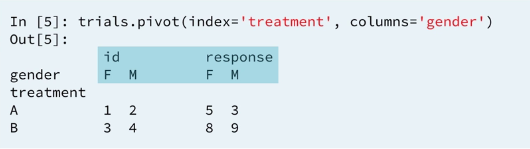
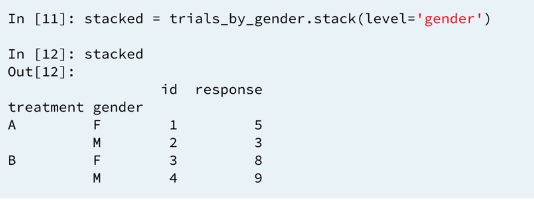
However, we can also leave out this specification (values). In that case, all remaining columns are used as the values. The resulting datafarame has multi indexed columns with the id and response stratified by gender.
1.4 Example 1
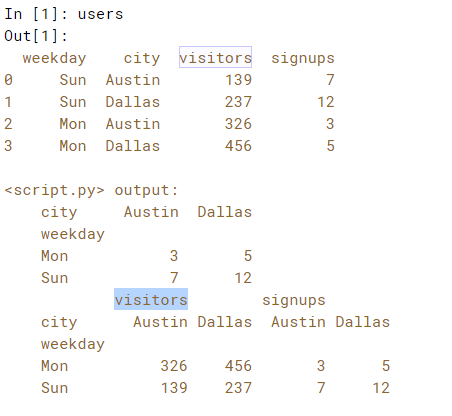
If you do not select any particular variables, all of them will be pivoted. In this case - with the users DataFrame - both 'visitors' and 'signups' will be pivoted, creating hierarchical column labels.
You will explore this for yourself now in this exercise.
# Pivot users with signups indexed by weekday and city: signups_pivot
print(users)
signups_pivot = users.pivot(index='weekday', columns='city', values='signups')

# Print signups_pivot
print(signups_pivot)

# Pivot users pivoted by both signups and visitors: pivot
pivot = users.pivot(index='weekday', columns='city')

# Print the pivoted DataFrame
print(pivot)
Result:
2 Stacking & unstacking DataFrames
Stacking & unstacking is for multi-level index, because pivot don't work in multi-level index
2.1 creating a multi-level index
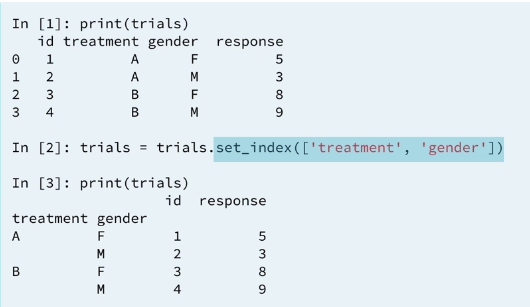
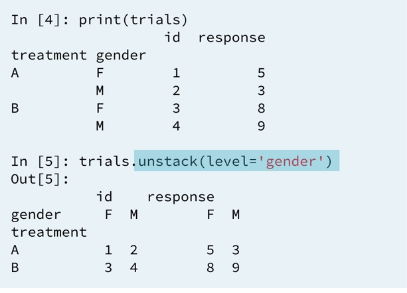
The pivot method won't work directly with this dataframe because of the multi-level index. In this case, we might want to move some of the index levels to columns making our dataframe shorter and wider. More columns, fewer rows. To do this, we can move the second level of the index (gender) to the column using unstack. The data are now divided in columns by gender. This gives a similar result as the pivot method. The principal difference is now we have hierarchical columns.
2.2 Unstacking a multiple-index (1)
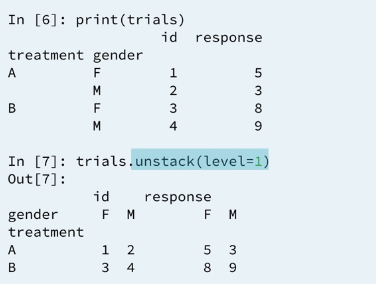
2.3 Unstacking a multiple-index (2)
2.4 Stacking dataframes
The opposite of unstack is stack. this can be used to make wide dataframe thinner and longer. with unstack you specify a level hierarchical columns to be moved to the index.

2.5 Swapping levels
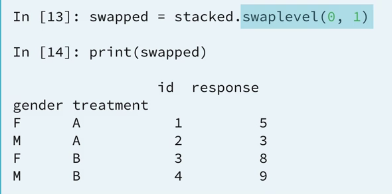
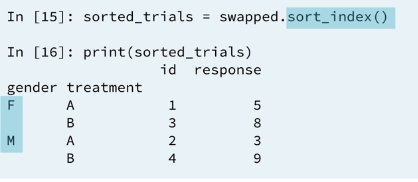
You will now use .swaplevel(0, 1) to flip the index levels. Note they won't be sorted. To sort them, you will have to follow up with a .sort_index(). You will then obtain the original DataFrame. Note that an unsorted index leads to slicing failures.
Suppose you want to have the gender level outer most and the treatment level inner most.
2.6 Sorting rows
3 Melting DataFrames
3.1 Clinical trails data
3.2 Clinical trails after pivoting
3.3 Clinical trails data
3.4 Melting Dataframe
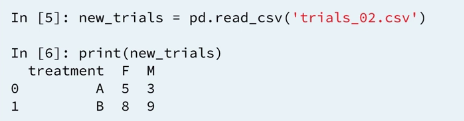
There are various contexts in which it is useful to switch from this pivoted summery to the original dataframe. To restore the pivoted dataframe to its original from pandas provides melt.
3.5 Specifying id_vars
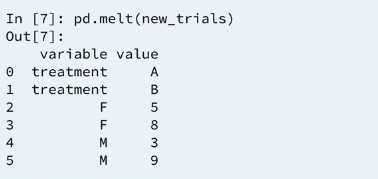
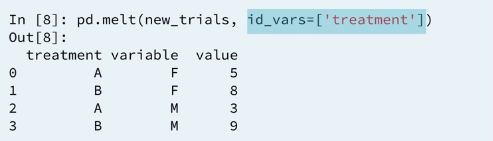
The melt function converts our column labels from F and M into one column name 'gender' but the treatment index values are gone. This in not what we wanted . We can fix this by specifying the columns that should remain in the reshaped dataframe. to do this we specify id_vars=['treatment']
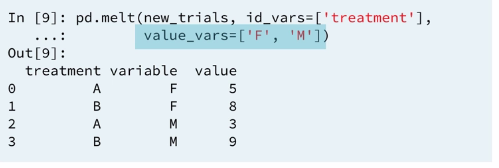
3.6 Specifying value_vars
We can also list explicitly which columns to convert to values in the variable column of the melted dataframe.

3.7 Specifying value_name
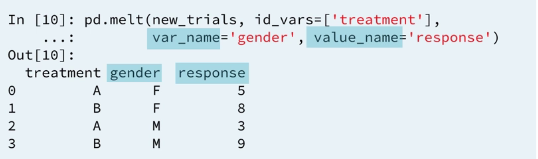
3.8 Example 2 : Adding names for readability
3.9 Example 3 : Obtaining key-value pairs with melt()
Obtaining key-value pairs with melt()
4 Pivot table
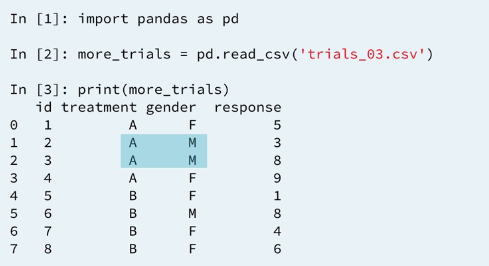
Pivot doesn't always work. As an example consider the following one
4.1 More clinical trails data
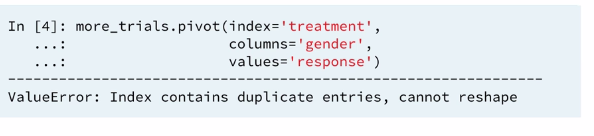
4.2 Rearranging by pivoting
If we want to apply pivot to summarize the response values by treatment and gender. The repeated pairs make that impossible. Said another way pivot requires unique index, column pairs to identify values in the new table. This is where pivot tables comes in.
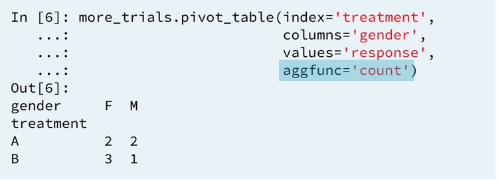
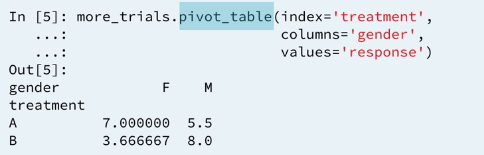
4.3 Pivot table
By default the reduction is a average.
4.4 Other aggregations