ERPLAB Studio Panels: Spectral Analysis - ucdavis/erplab GitHub Wiki
The Spectral Analysis panel in the ERP tab allows you to view the frequency spectrum for the selected ERPsets. Spectra are shown for each bin and channel selected in the Bin & Channel Selection panel. You choose the minimum and maximum frequencies to be plotted using the Frequency Range text box. The maximum frequency can be no higher than ½ the sampling rate.
This tool is designed simply to give you informal information about the frequency content of your ERPs, not for any formal analyses. The tool can plot the spectra but cannot save the values as numbers.
You can show the amplitude, the power, the phase, or the log of the amplitude (dB). Ordinarily, a Hamming window is applied to the data before the spectrum is computed, but this can be disabled.

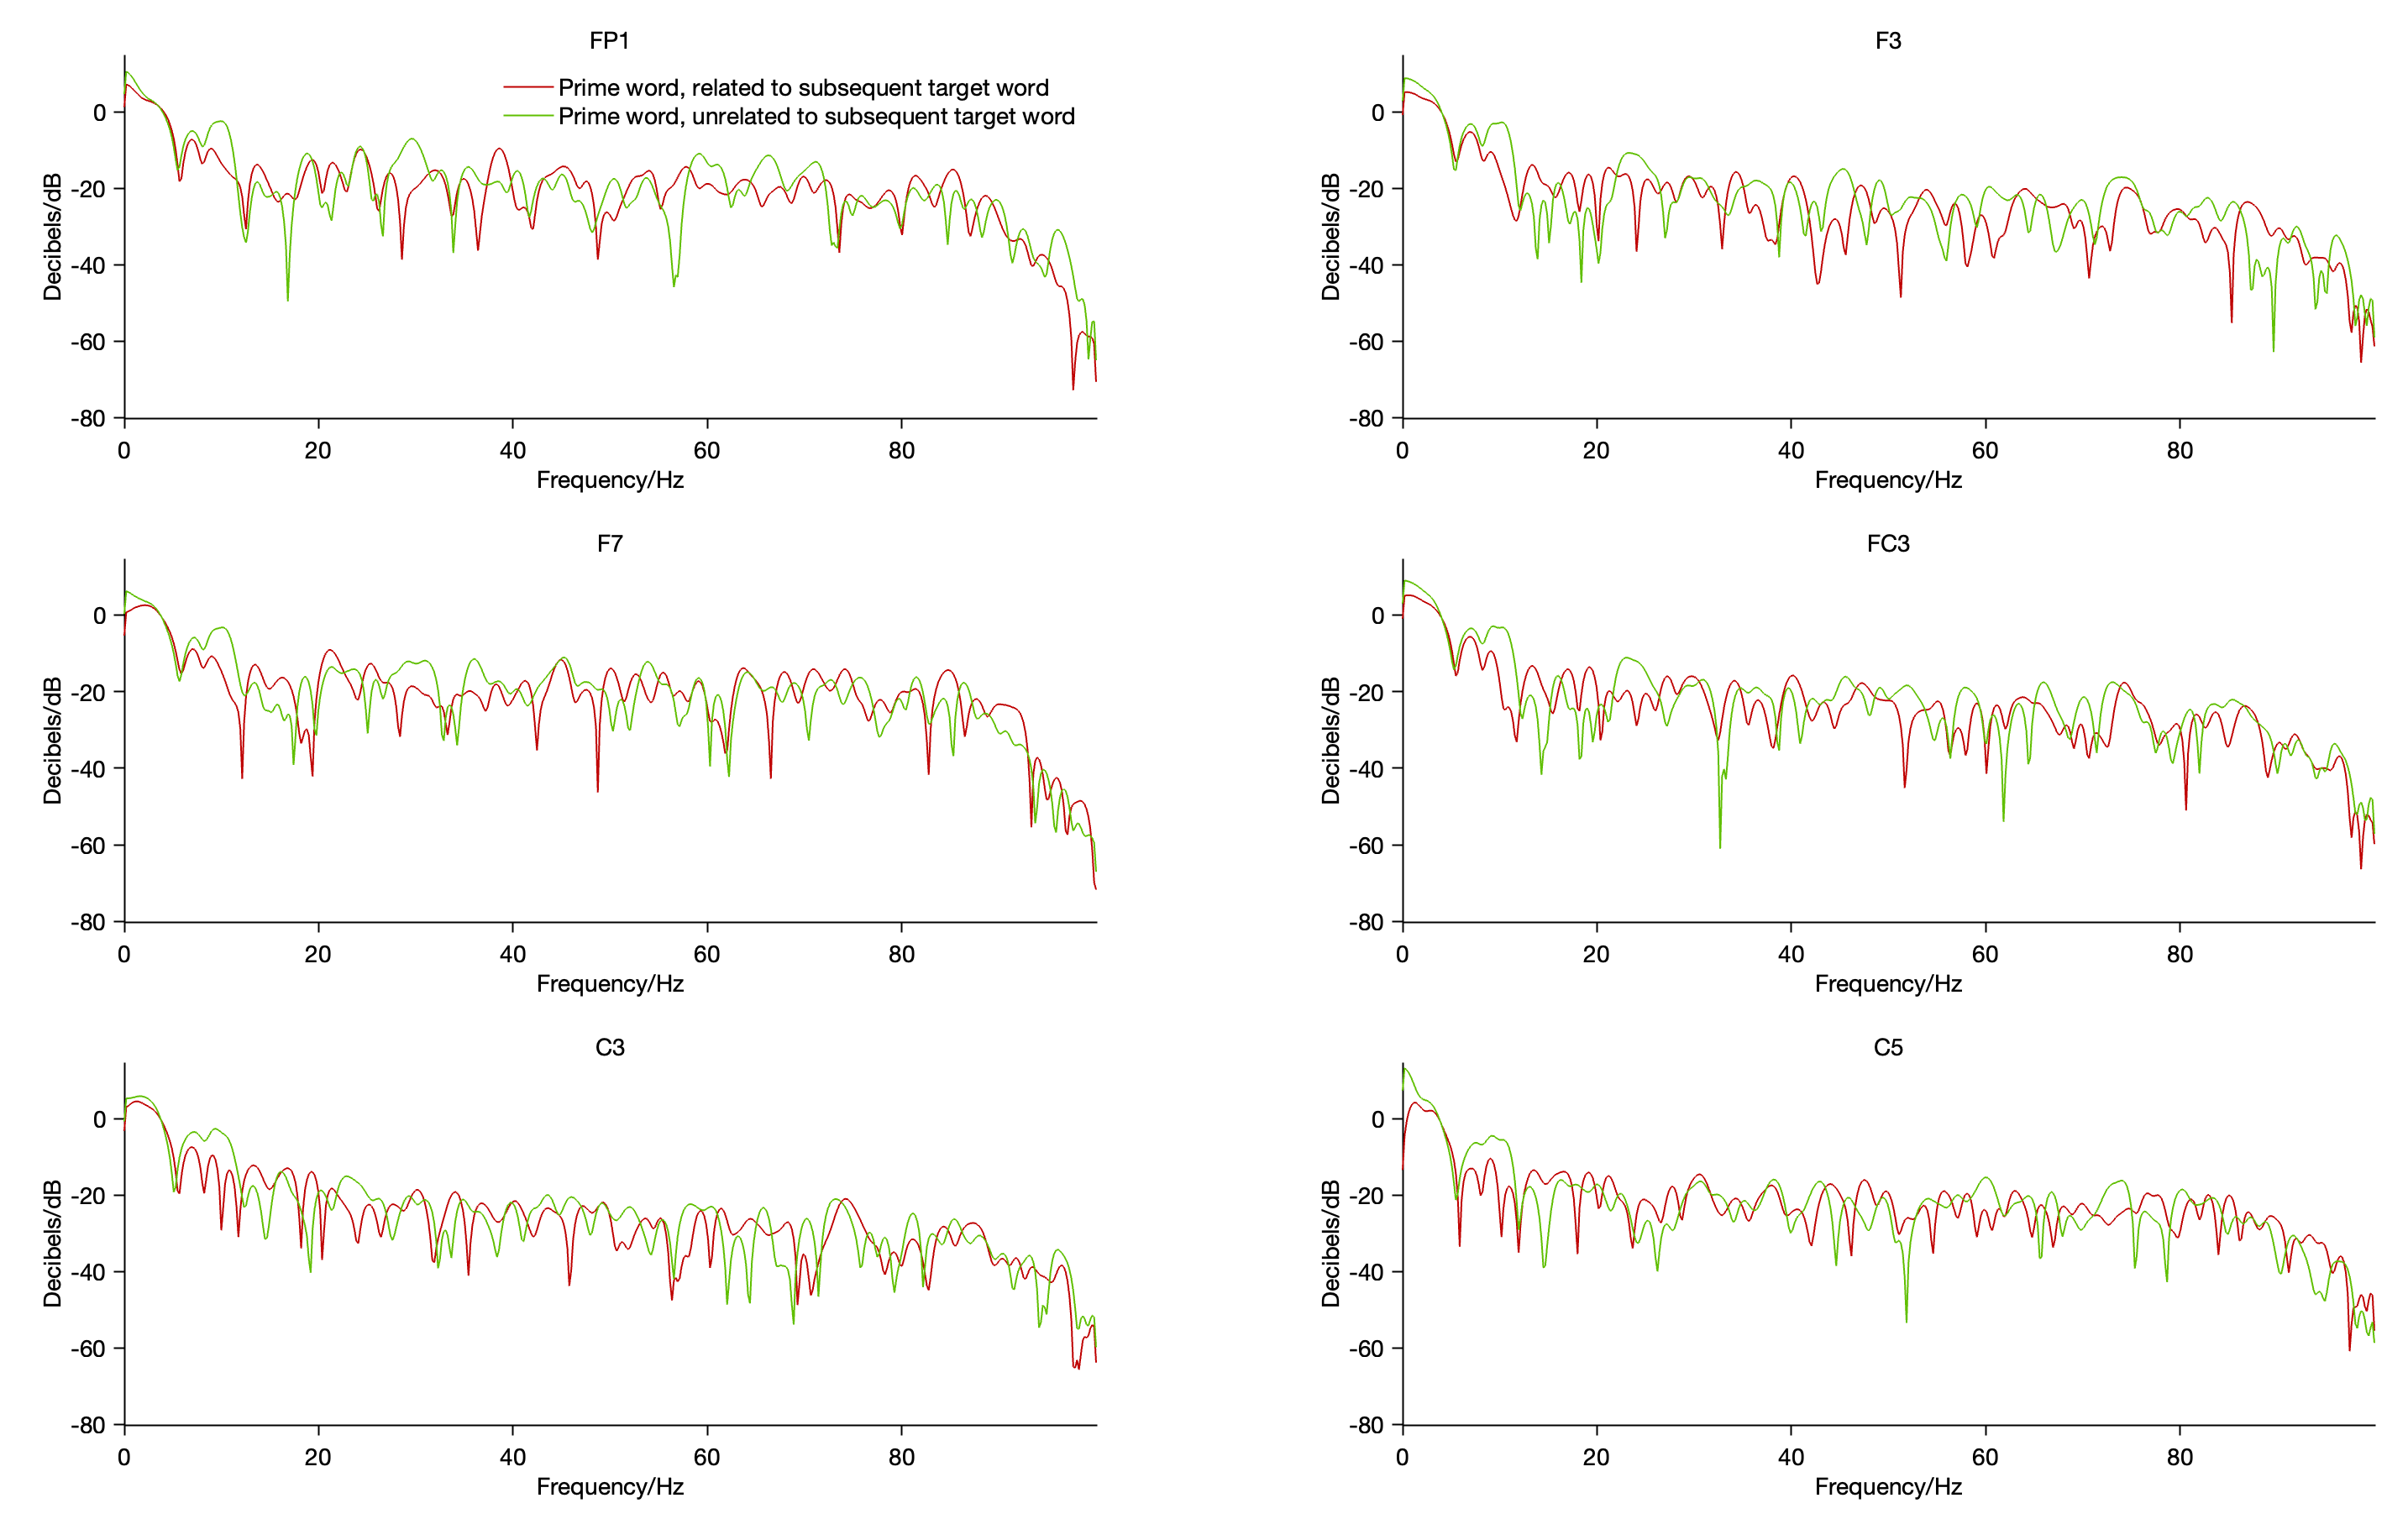
Here is an example, showing the spectra for two bins at each of six different channels: