03 Manage_OKD4 - tothti/okd4_training GitHub Wiki
Table of Contents
- About the CLI
- Installing the CLI on Linux
- Logging in to the CLI
- Using the CLI
- Web UI
- Projects
-
Application management
- Creating an application from source code using the CLI
- Creating an application from an image
- Creating an application from a template
- Object created with
new-appcommand - Specifying environment variables
- Searching for images, templates, and other inputs
- Viewing pods using the CLI
- Viewing pod logs using the CLI
- Importing, Exporting and Configure Kubernetes Resources
- Monitoring
With the OKD command-line interface (CLI), you can create applications and manage OKD projects from a terminal. The CLI is ideal in situations where you:
- Work directly with project source code.
- Script OKD operations.
- Are restricted by bandwidth resources and can not use the web console.
You can install the OpenShift CLI (oc) binary on Linux by using the following procedure.
- Navigate to https://mirror.openshift.com/pub/openshift-v4/clients/oc/latest/ and choose the folder for your operating system and architecture.
- Download
oc.tar.gz. - Unpack the archive:
tar xvzf <file> - Place the
ocbinary in a directory that is on yourPATH. To check yourPATH, execute the following command:
echo $PATH
After you install the CLI, it is available using the oc command:
oc <command>
You can log in to the oc CLI to access and manage your cluster.
Log in to the CLI using the oc login command and enter the required information when prompted.
oc login
Example output:
Server [https://localhost:8443]: https://openshift.example.com:6443
The server uses a certificate signed by an unknown authority.
You can bypass the certificate check, but any data you send to the server could be intercepted by others.
Use insecure connections? (y/n): y

Authentication required for https://openshift.example.com:6443 (openshift)
Username: user1
Password:
Login successful.

You don't have any projects. You can try to create a new project, by running

	oc new-project <projectname>

Welcome! See 'oc help' to get started.
oc new-project my-project
Example output:
Now using project "my-project" on server "https://openshift.example.com:6443".
oc status
Example output:
In project my-project on server https://openshift.example.com:6443

svc/cakephp-ex - 172.30.236.80 ports 8080, 8443
  dc/cakephp-ex deploys istag/cakephp-ex:latest <-
    bc/cakephp-ex source builds https://github.com/sclorg/cakephp-ex on openshift/php:7.2
    deployment #1 deployed 2 minutes ago - 1 pod

3 infos identified, use 'oc status --suggest' to see details.
oc project
Example output:
Using project "my-project" on server "https://openshift.example.com:6443".
oc new-app https://github.com/sclorg/cakephp-ex
Example output:
--> Found image 40de956 (9 days old) in imagestream "openshift/php" under tag "7.2" for "php"

...

    Run 'oc status' to view your app.
oc get pods -o wide
oc logs cakephp-ex-1-deploy
oc api-resources
Example output:
NAME                                  SHORTNAMES       APIGROUP                              NAMESPACED   KIND
bindings                                                                                     true         Binding
componentstatuses                     cs                                                     false        ComponentStatus
configmaps                            cm                                                     true         ConfigMap
...
oc whoami
oc logout
Get a list and description of all available CLI commands:
oc help
Get help about a specific CLI command:
oc <command> --help
After you install the oc CLI tool, you can enable tab completion to automatically complete oc commands or suggest options when you press Tab.
- Save the Bash completion code to a file.
oc completion bash > oc_bash_completion
- Copy the file to /etc/bash_completion.d/
sudo cp oc_bash_completion /etc/bash_completion.d/
You can also save the file to a local directory and source it from your .bashrc file instead.
The OKD web console is a user interface accessible from a web browser. Developers can use the web console to visualize, browse, and manage the contents of projects.
JavaScript must be enabled to use the web console. For the best experience, use a web browser that supports WebSockets.
The web console runs as a Pod on the master. The static assets required to run the web console are served by the Pod. Once OKD is successfully installed, find the URL for the web console and login credentials for your installed cluster in the CLI output of the installation program. For example:
INFO Install complete!
INFO Run 'export KUBECONFIG=<your working directory>/auth/kubeconfig' to manage the cluster with 'oc', the OpenShift CLI.
INFO The cluster is ready when 'oc login -u kubeadmin -p <provided>' succeeds (wait a few minutes).
INFO Access the OpenShift web-console here: https://console-openshift-console.apps.demo1.openshift4-beta-abcorp.com
INFO Login to the console with user: kubeadmin, password: <provided>
Use those details to log in and access the web console.
Access the OKD dashboard, which captures high-level information about the cluster, by navigating to Home → Dashboards → Overview from the OKD web console.
The OKD dashboard provides various cluster information, captured in individual dashboard cards.
The OKD dashboard consists of the following cards:
-
Details provides a brief overview of informational cluster details.
Status include ok, error, warning, in progress, and unknown. Resources can add custom status names.- Cluster ID
- Provider
- Version
-
Cluster Inventory details number of resources and associated statuses. It is helpful when intervention is required to resolve problems, including information about:
- Number of nodes
- Number of Pods
- Persistent storage volume claims
- Bare metal hosts in the cluster, listed according to their state (only available in metal3 environment).
-
Cluster Capacity charts help administrators understand when additional resources are required in the cluster. The charts contain an inner ring that displays current consumption, while an outer ring displays thresholds configured for the resource, including information about:
- CPU time
- Memory allocation
- Storage consumed
- Network resources consumed
-
Cluster Utilization shows the capacity of various resources over a specified period of time, to help administrators understand the scale and frequency of high resource consumption.
-
Events lists messages related to recent activity in the cluster, such as Pod creation or virtual machine migration to another host.
-
Top Consumers helps administrators understand how cluster resources are consumed. Click on a resource to jump to a detailed page listing Pods and nodes that consume the largest amount of the specified cluster resource (CPU, memory, or storage).
The OKD web console provides two perspectives:
- the Administrator perspective and
- the Developer perspective.
The default web console perspective that is shown depends on the role of the user. The Developer perspective is displayed by default if the user is recognised as a developer.
The Developer perspective in the OKD web console provides workflows specific to developer use cases.
You can access the Developer perspective from the web console as follows:
- Log in to the OKD web console using your login credentials. The default view for the OKD web console is the Administrator perspective.
- Use the perspective switcher to switch to the Developer perspective. The Topology view with a list of all the projects in your cluster is displayed.

- Select an existing project from the list or use the Project drop-down list to create a new project.
If you have no workloads or applications in the project, the Topology view displays the available options to create applications. If you have existing workloads, the Topology view graphically displays your workload nodes.
A project allows a community of users to organize and manage their content in isolation from other communities.
Projects starting with
openshift-andkube-are default projects. These projects host cluster components that run as Pods and other infrastructure components. As such, OKD does not allow you to create Projects starting withopenshift-orkube-using theoc new-projectcommand. Cluster administrators can create these Projects using theoc adm new-projectcommand.
oc new-project <project_name> --description="<description>" --display-name="<display_name>"
Creating a new project will automatically change the current project of your session to the new project
When viewing projects, you are restricted to seeing only the projects you have access to view based on the authorization policy.
List projects:
oc get projects
* signifies the current project
Change current project:
oc project <project_name>
oc status
This command provides a high-level overview of the current project, with its components and their relationships.
When you delete a project, the server updates the project status to Terminating from Active. Then, the server clears all content from a project that is in the Terminating state before finally removing the project. While a project is in Terminating status, you cannot add new content to the project. Projects can be deleted from the CLI or the web console.
oc delete project <project_name>
- Navigate to Home → Projects.
- Click Create Project.
- Enter your project details.
- Click Create.
- Click the Project drop-down menu to see a list of all available projects. Select Create Project.
- In the Create Project dialog box, enter a unique name, such as
myproject, in the Name field. - Optional: Add the Display Name and Description details for the project.
- Click Create.
- Use the left navigation panel to navigate to the Project view and see the dashboard for your project.
- Navigate to Home → Projects.
- Select a project to view.
On this page, click the Workloads button to see workloads in the project.
- Navigate to Home → Projects.
- Select a project to see its status.
- Navigate to Home → Projects.
- Locate the project that you want to delete from the list of projects.
- On the far right side of the project listing, select Delete Project from the Options menu
 .
.
If you do not have permissions to delete the project, the Delete Project option is not available.
- When the Delete Project pane opens, enter the name of the project that you want to delete in the field.
- Click Delete.
https://docs.okd.io/latest/applications/projects/working-with-projects.html
With the new-app command you can create applications from source code in a local or remote Git repository.
The new-app command creates a build configuration, which itself creates a new application image from your source code. The new-app command typically also creates a deployment configuration to deploy the new image, and a service to provide load-balanced access to the deployment running your image.
oc new-app /<path to source code>
oc new-app https://github.com/sclorg/cakephp-ex
You can deploy an application from an existing image. Images can come from imagestreams in the OKD server, images in a specific registry, or images in the local Docker server.
Create an application from the DockerHub MySQL image, for example:
oc new-app mysql
Create an application using an image in a private registry, specify the full container image specification:
oc new-app myregistry:5000/example/myimage
Create an application from an existing imagestream and optional imagestreamtag:
oc new-app my-stream:v1
You can create an application from a previously stored template or from a template file, by specifying the name of the template as an argument. For example, you can store a sample application template and use it to create an application.
Upload an application template to your current project’s template library. The following example uploads an application template from a file called examples/sample-app/application-template-stibuild.json:
oc create -f examples/sample-app/application-template-stibuild.json
Then create a new application by referencing the application template. In this example, the template name is ruby-helloworld-sample:
oc new-app ruby-helloworld-sample
To create a new application by referencing a template file in your local file system, without first storing it in OKD, use the -f|--file argument. For example:
oc new-app -f examples/sample-app/application-template-stibuild.json
The new-app command generates OKD objects that build, deploy, and run the application that is created.
| Object | Description |
|---|---|
| BuildConfig | A BuildConfig is created for each source repository that is specified in the command line. The BuildConfig specifies the strategy to use, the source location, and the build output location. |
| ImageStreams | For BuildConfig, two ImageStreams are usually created. One represents the input image. With Source builds, this is the builder image. With Docker builds, this is the FROM image. The second one represents the output image. If a container image was specified as input to new-app, then an imagestream is created for that image as well. |
| DeploymentConfig | A DeploymentConfig is created either to deploy the output of a build, or a specified image. The new-app command creates emptyDir volumes for all Docker volumes that are specified in containers included in the resulting DeploymentConfig. |
| Service | The new-app command attempts to detect exposed ports in input images. It uses the lowest numeric exposed port to generate a service that exposes that port. In order to expose a different port, after new-app has completed, simply use the oc expose command to generate additional services. |
| Other | Other objects can be generated when instantiating templates, according to the template. |
When generating applications from a template, source, or an image, you can use the -e|--env argument to pass environment variables to the application container at run time:
oc new-app openshift/postgresql-92-centos7 \
    -e POSTGRESQL_USER=user \
    -e POSTGRESQL_DATABASE=db \
    -e POSTGRESQL_PASSWORD=password
oc new-app https://github.com/openshift/ruby-hello-world --name=myapp
oc new-app https://github.com/openshift/ruby-hello-world -n myproject
To search for images, templates, and other inputs for the oc new-app command, add the --search and --list flags. For example, to find all of the images or templates that include PHP:
oc new-app --search php
oc get pods -o wide
get all resources within current project:
oc get all
oc logs -f <resource_type>/<resource_name>
Example:
oc logs -f bc/cakephp-ex
You can use the -o yaml (or -o json) flags with get command to print the output as yaml (or json) format.
This output can be saved as a file, which contains the OKD resource's parameters (kind of a backup of that resource's configuration).
oc get -o yaml <resource> > <resource>.yaml
oc get -o json <resource> > <resource>.json
oc create -f <resource>.yaml
oc create -f <resource>.json
You can replace an existing resource from file or stdin. This will apply the resource with the same name, but modified content.
oc replace <resource>.yaml
Apply a config to a resource by filename or stdin
oc apply -f <resource>.yaml
Extract the contents of a ConfigMap or secret. Each key in the ConfigMap or secret is created as a separate file with the name of the key.
oc extract
Copy contents of a directory to or from a running Pod container. Only changed files are copied using the rsync command from your operating system.
oc rsync <path to files> <pod to copy to>
OKD includes a pre-configured, pre-installed, and self-updating monitoring stack that is based on the Prometheus open source project and its wider eco-system. It provides monitoring of cluster components and includes a set of alerts to immediately notify the cluster administrator about any occurring problems and a set of Grafana dashboards. The cluster monitoring stack is only supported for monitoring OKD clusters.
- To access Prometheus, navigate to the "Monitoring" → "Metrics" page.
- To access the Alerting UI, navigate to the "Monitoring" → "Alerting" page.
- To access Grafana, navigate to the "Monitoring" → "Dashboards" page.
The Alerting UI is accessible by clicking Monitoring → Alerting in the OKD web console.
The three main pages of the Alerting UI are the Alerts, the Silences, and the Alerting rules pages.
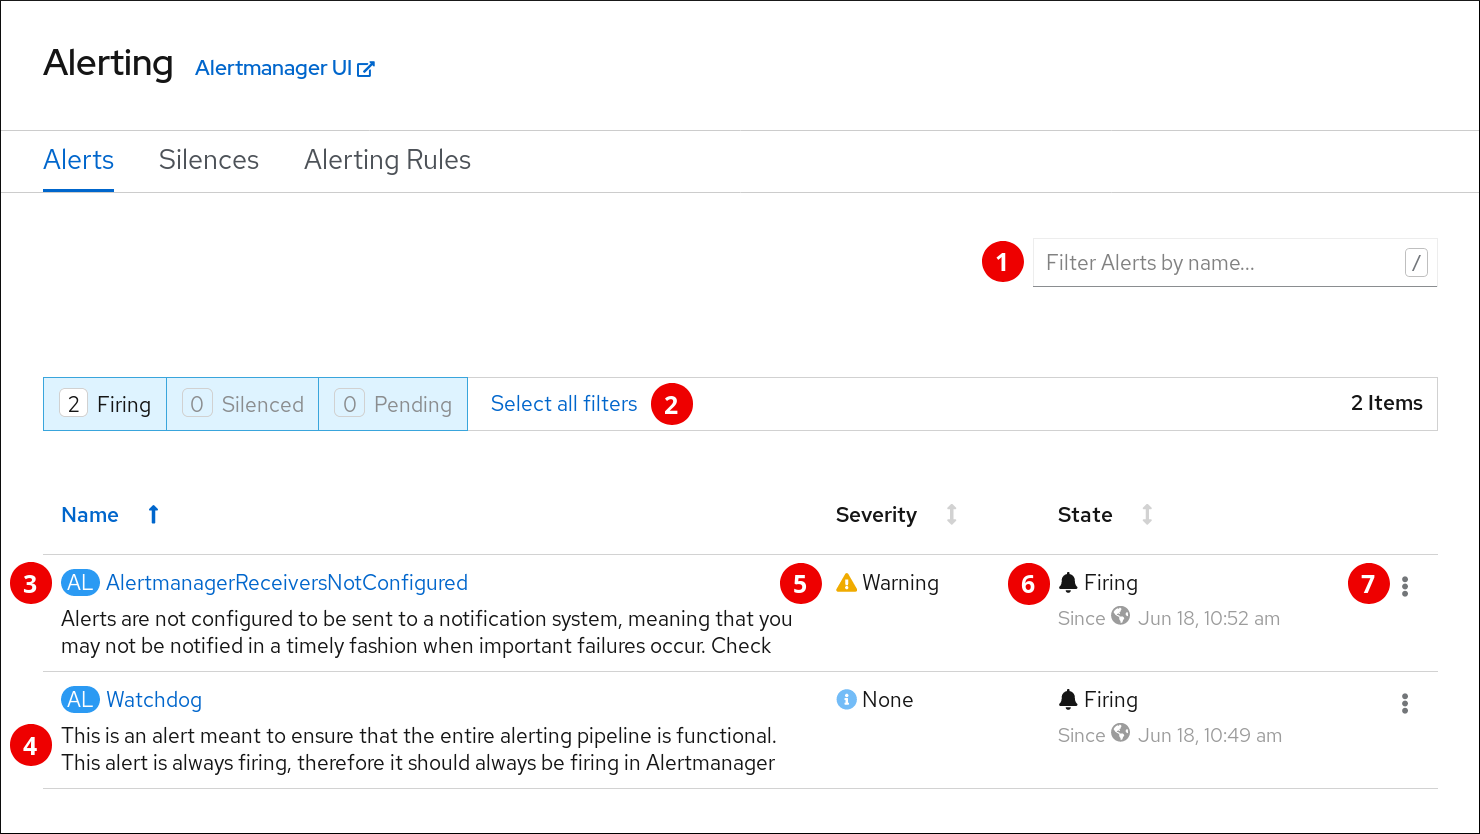
- Filtering alerts by their names.
- Filtering the alerts by their states. To fire, some alerts need a certain condition to be true for the duration of a timeout. If a condition of an alert is currently true, but the timeout has not been reached, such an alert is in the Pending state.
- Alert name.
- Description of an alert.
- Value of the Severity label of the alert.
- Current state of the alert and when the alert went into this state.
- Actions you can do with the alert.

- Creating a silence for an alert.
- Filtering silences by their name.
- Filtering silences by their states. If a silence is pending, it is currently not active because it is scheduled to start at a later time. If a silence expired, it is no longer active because it has reached its end time.
- Description of a silence. It includes the silence name and the specification of alerts that it matches.
- Number of alerts that are being silenced by the silence.
- Current state of the silence. For active silences, it shows when the silence ends. For pending silences, it shows when the silence starts.
- User that created the silence.
- Actions you can do with a silence.

- Filtering Alerting Rules by their name.
- Filtering Alerting Rules by their states.
- Alerting Rule name.
- Value of the Severity label of the Alerting Rule.
- State of the Alert defined by the Alerting Rule.
Also, next to the title of each of these pages is a link to the Alertmanager interface.
OKD Latest provides a web interface to Prometheus, which enables you to run Prometheus Query Language (PromQL) queries and examine the metrics visualized on a plot. This functionality provides an extensive overview of the cluster state and enables you to troubleshoot problems.
The Metrics page is accessible by clicking Monitoring → Metrics in the OKD web console.

- Actions.
- Add query.
- Expand or collapse all query tables.
- Delete all queries.
- Hide the plot.
- The interactive plot.
- The catalog of available metrics.
- Add query.
- Run queries.
- Query forms.
- Expand or collapse the form.
- The query.
- Clear query.
- Enable or disable query.
- Actions for a specific query.
- Enable or disable query.
- Show or hide all series of the query from the plot.
- Delete query.
- The metrics table for a query.
- Color assigned to the graph of the metric. Clicking the square shows or hides the metric’s graph.
Additionally, there is a link to the old Prometheus interface next to the title of the page.
Events are associated with a namespace, either the namespace of the resource they are related to or, for cluster events, the default namespace. The default namespace holds relevant events for monitoring or auditing a cluster, such as Node events and resource events related to infrastructure components.
The master API and oc command do not provide parameters to scope a listing of events to only those related to nodes.A simple approach would be to use grep:
oc get event -n default | grep Node
Example output:
1h 20h 3 origin-node-1.example.local Node Normal NodeHasDiskPressure ...
oc get events -n <project_name>
Example:
oc get events -n openshift-config
Using the oc log command, you can view container logs, Buildconfigs and Deploymentconfigs in real time. Different can users have access different access to logs:
- Users who have access to a project are able to see the logs for that project by default.
- Users with admin roles can access all container logs.
To save your logs for further audit and analysis, you can enable the cluster-logging add-on feature to collect, manage, and view system, container, and audit logs. You can deploy, manage, and upgrade cluster logging through the Elasticsearch Operator and Cluster Logging Operator.
https://docs.okd.io/latest/security/container_security/security-monitoring.html
With the top command we can check usage statistics of resources on the server. (This is a one time query, it's not displaying data dynamically.)
Examples:
oc adm top node
oc adm top pod